1. Introduction
The Shiyang River basin, located in northwest China, has the highest population, highest water utilization rate, sharpest water conflict, most severe eco-environmental problems and the strongest water conditionality on economy and society among the inland river basins of China (Kang et al., Reference Kang, Su, Shen, Shi and Yang2004). In recent decades, rapid economic growth and increasing population pressure has resulted in the excessive use of water resources in the region (Yang et al., Reference Yang, Feng, Huang and Lin2008). The conflict between economic water use and ecological water demand has gradually resulted in the eco-environmental deterioration of this area. Downstream regions of the Shiyang River, especially the Minqin oasis, are suffering from desertification and ecosystem degradation, which has endangered local livelihoods and will continue to threaten the sustainable development of these regions (MWR, 2004).
As a critical ecosystem service, water resources are important for both economic development and the environment (MEA, 2005), which challenges policy makers to pursue the most appropriate trade-offs between economic development and ecosystem health. The upstream area is the source of the Shiyang River, where irrigation agriculture accounts for approximately 86.4 per cent of all water use (MWR, 2004). Thus, a potential means to increase the water supply is through the reduction of irrigation and the associated change in land cover in the upper reaches of the Shiyang River basin.
Globally, there has been a shift from traditional subsidy and trade policies to policies that provide farmers with incentives to increase the supply of ecosystem services from agriculture (Immerzeel et al., Reference Immerzeel, Stoorvogel and Antle2008). This is referred to as payments for ecosystem services (PES). PES have attracted increasing interest as a mechanism to translate external, non-market values of the ecosystem services into real financial incentives for local actors to provide these services (Engel et al., Reference Engel, Pagiola and Wunder2008). A formal definition is provided by Wunder (Reference Wunder2005): A PES scheme is a voluntary, conditional agreement between at least one ‘seller’ and one ‘buyer’ over a well-defined ecosystem service or a land use presumed to produce that service. In the last decade or so, hundreds of PES initiatives have emerged around the globe. Costa Rica, Mexico and China, among other nations, have initiated large-scale programs that give direct payments to landowners for undertaking specific land use practices that could increase the provision of ecosystem services (Landell-Mills and Porras, Reference Landell-Mills and Porras2002; Wunder et al., Reference Wunder, Engel and Pagiola2008).
There have been an increasing number of efforts aiming to protect the quality and quantity of water resources by using PES (FAO, 2007). In water conservation policies, the focus has been primarily on the development of water pricing instruments (Dinar, Reference Dinar2000). In this paper we used an economic model developed by Antle and Valdivia (Reference Antle and Valdivia2006), which does not require complicated site-specific data, to assess whether it would be economically feasible to pay farmers to reduce water consumption by changing from irrigation to rain-fed crop production and thus increase the water supply for the middle and lower reaches of the basin. The concept of PES applied in this study can be interpreted as a means to implement an efficient water pricing policy wherein farmers are assigned the initial rights to use irrigation water, and downstream users (or governments) pay farmers to reduce water use. The analysis presents an economic assessment of farmers' willingness to change cultivation practices and simulates a water supply curve to the middle and downstream users. This water supply curve can be used by policy makers to assess how much water farmers are willing to supply at a given price per unit of water. Combined with an assessment of how much water is worth to other water users, an efficient water policy can then be implemented.
1.1. Study area
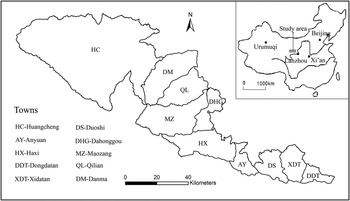
This paper focus on the upper reaches of the Shiyang River basin, which is located between 101°14′ and 103°46′ E and between 36°45′ and 38°13′ N, in the eastern portion of the Hexi Corridor of western Gansu Province (figure 1). The annual mean temperature is −0.1°C, and the average annual precipitation is 408.9 mm. The total accumulated annual sunshine hours is 2,600 h. The geography of the study area is dominated by the Qilian Mountains. The altitude in this area ranges from 2,042 to 5,126 m above sea level with an average of 3,200 m above sea level. It includes six origin branches of the Shiyang River. The glacial melt from the Qilian Mountains is the major water source in the downstream of the Shiyang River basin, especially in the dry season.
Location of study area

The study area covers some 714,980 ha, including 10 towns (figure 1): Huangcheng (HC), Anyuan (AY), Haxi (HX), Dongdatan (DDT), Xidatan (XDT), Duoshi (DS), Dahonggou (DHG), Maozang (MZ), Qilian (QL) and Danman (DM). Irrigation agriculture is found below 3,000 m above sea level, where the main crop is wheat. Irrigated agriculture accounts for about 86.4 per cent of all water use. The study area currently has a population of 0.13 million, with 85 per cent classified as rural. Most of the study area belongs to Tianzhu, which is a national-level poor county with an average per capita income of CNY (yuan) 2,139 in 2008 – well below the national average of CNY 4,761 (Statistics Bureau of Tianzhu, 2009).
2. Economic model for analysis of ecosystem service supply
To implement the economic analysis, we used the minimum data (MD) approach developed by Antle and Valdivia (Reference Antle and Valdivia2006) to model the supply of ecosystem services from agriculture. This approach exploits the structure of the PES problem to obtain an approximation of the ecosystem services supply curve using relatively simple secondary data. The MD model assumes farmers are rational economic men who make land use and management decisions to maximize their perceived economic returns. These decisions may impact on ecosystem function and the supply of ecosystem services by affecting biological and physical systems through a number of mechanisms. As a result, the provision of this ecosystem service is driven by the farmer's economic motivation and ignores the demand for that ecosystem service, e.g., other water users. To increase the supply of ecosystem services, demanders must provide farmers with economic incentives stimulating farmers to change their land use management in ways that increase those services.
In this study, for each town, we consider two practices, a being irrigation farming, and b being rain-fed farming, as competing land uses. The rain-fed case b is a water-conserving practice and produces more ecosystem service (water resource) than practice a (irrigation). We assume that a quantity of ecosystem service of e(s) units per ha per time period is produced at site s when practice b is adopted, and zero services are produced when practice a is in use at the site. The parameter e(s) is interpreted as the rate of ecosystem service obtained from changing land use in site s.
Now we consider a model of a farmer's choice between two production systems, a and b. We consider a farmer at a site s using practice a, which provides an expected net return each period equal to v(p, s, a), given product and input prices p. For practice b, the expected net return is v(p, s, b). In some cases, there may be costs of adjustment associated with changing practices. These costs of adjustment may involve capital investments or learning about alternative management practices. However, according to local conditions, no additional investment is needed when rain-fed production is adopted. A survey conducted in the lower reaches of the Shiyang River basin in 2009 showed that farmers are reluctant to invest in crop production even when there is no irrigation water, because of the high cost and risk associated with this investment, especially when the returns from crop production are already low (Tang et al., Reference Tang, Xu, Wu and Liu2010b). In a previous study conducted in the Heihe River basin, which is another typical inland river basin located in northwest China, researchers obtained similar results (Tang et al., Reference Tang, Huang and Xu2010a). This means, in this case, that there are no significant costs of adjustments associated with changing from irrigation to rain-fed production. Thus, we assume for simplicity that the adjustment costs associated with changing practices are negligible. Under these assumptions, when a farmer is not provided with any other financial incentives, he/she will choose practice a if

and b is chosen otherwise. ω is the difference of expected net returns between two practices. Thus, ω can be interpreted as the opportunity cost of changing from practice a to practice b. Therefore, ω/e is the opportunity cost per unit of ecosystem service.
Defining the density function of ω/e as  , the proportion of land in practice b without payments is then given by

The initial supply of water without other financial incentives is given by

where H is total area of cropland. To increase the supply of water above the baseline quantity S(p), we assume that a payment p e(CNY m−3) is offered to the farmers to stimulate them to change their land use from practice a to b. A farmer will receive p e for each m3 that is produced above baseline. Therefore, a farmer receives v(p, s, a) for using practice a, and v(p, s, a) + e · p e for using practice b. Accordingly, a farmer will choose to adopt practice a if

and practice b if otherwise. This equation implies that farmers are willing to change practices to receive the payment if ω/e ≤ p e, i.e., if the opportunity cost per unit of water conserved is less than the price paid for the water. The fraction of the total number of farmers who change from practice a to b is given by

The increase of ecosystem services relative to the baseline is

The total supply of ecosystem services in this case equals

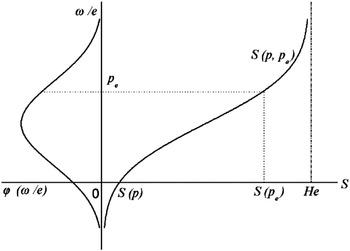
Figure 2 demonstrates how the supply of water is derived from the spatial distribution of opportunity costs for changing practices. The left side of this figure shows the spatial distribution of opportunity cost per unit of ecosystem service, ω/e. The right side of the figure shows the supply curve. The shape of the supply curve (S(p, p e)) is determined by the form of the spatial distribution of opportunity cost ( . The supply curve approaches a vertical asymptote equal to the maximum amount of ecosystem service H·e that can be produced when all cropland switches from practice a to b.
Derivation of the supply of ecosystem services from the spatial distribution of opportunity cost per unit of ecosystem services (Antle and Valdivia, Reference Antle and Valdivia2006)
Notes: e, ecosystem service rate; p e, price per unit of ecosystem service; ω/e, opportunity cost per unit of ecosystem service; φ(ω/e), spatial distribution of ω/e; H, total area; p, vector of input and output prices; S, total supply of ecosystem service.

2.1. Rate of ecosystem service supply, e
According to the above definition, e is the quantity of water saved by rain-fed production compared to irrigation production. The average irrigation water quota is 3,600 m3 ha−1 year−1 in the study area. However, the water saved by rain-fed production is less than that. Because a portion of irrigation water is returned as stream flow or groundwater flow through direct runoff and infiltration, on a catchment scale, this part of the water was not lost from the system and can be reused downstream. Only a very small proportion is lost from the catchment through percolation to the deep aquifer (1 mm year−1) (Immerzeel et al., Reference Immerzeel, Stoorvogel and Antle2008). In the long term, the water in the soil and the deeper aquifer will come to equilibrium. Based on this analysis, it is concluded that the water conservation in a study area is roughly equal to the difference of water consumed between two production systems (irrigation and rain-fed). From the view of water balance, water consumed is expressed as evapotranspiration (Sinclair et al., Reference Sinclair, Tanner and Bennett1998). Accordingly, e is defined as the difference in evapotranspiration between two practices.
Evapotranspiration is determined by a variety of relatively local factors, including climatic and soil conditions; however, data derived from field experiments are not available in sufficient detail to account for all these factors across the full range of the study area. As the study area is relatively modest in size (714,980 ha), the variability in natural condition between different towns is small and, as such, the difference in evapotranspiration between different towns is not expected to be large. Furthermore, according to Antle et al. (Reference Antle, Capalbo, Mooney, Elliott and Paustian2003, Reference Antle, Diagana, Stoorvogel and Valdivia2010) and Antle and Valdivia (Reference Antle and Valdivia2006), if the goal of PES is to obtain a total quantity of ecosystem service in the region and not to obtain a specific quantity at a given site, the results based on an average rate of services are close approximations to those of using site-specific data. Consequently, we used the average rate of the whole region. According to previous research, the average evapotranspiration rate for traditional irrigation land and rain-fed land is 420 mm year−1 and 260 mm year−1, respectively (Ruan and Xu, Reference Ruan and Xu1996). Therefore, e equals 1,600 m3 ha−1 year−1.
3. Results
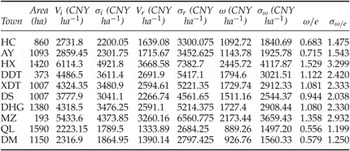
Table 1 shows the input data for the economic model. The mean, V i, and standard deviation, σi, of irrigation production for each town was obtained from the local statistical bureau. The proportion of rain-fed cropland in this area is very small due to the lower return and the relative abundance of water resources in this area and consequently we did not have enough samples to estimate the net returns of rain-fed production. This means that returns to irrigated crops are always higher than returns to rain-fed crops and we can make a cautious assumption that opportunity cost of irrigation is always positive. According to local experience, the yield of rain-fed production is approximately 60 per cent that of production using irrigation (Ma, Reference Ma1998). The cost of production is assumed to be proportional to yield in each town (Antle and Capalbo, Reference Antle and Capalbo2001) and so the cost of the rain-fed case was estimated accordingly. The mean net return, V i, of rain-fed production for each town is calculated in table 1.
Input for the economic analysis

Notes: V i, average net return of irrigation production; σi, standard deviation in net return of irrigation production; V r, average net return of rain-fed production; σr, standard deviation in net return of rain-fed production; ω, difference of net returns between the two practices; ω/e, average opportunity cost per unit of ecosystem service; σω/e, standard deviation in opportunity cost per unit of ecosystem service.
Source: Authors' assumptions based on a review of previous estimates.
Because irrigation allows farmers to apply water at the most beneficial times for the crop, instead of being subject to the timing of rainfall, the yield of irrigation production is more viable than that of rain-fed cases. The standard deviation, σr, of rain-fed production is assumed to be 1.5 times that of irrigation production. Since this correlation is not readily observed, sensitivity analysis was used to assess the impact of alternative values (see section 4).
According to a previous study conducted in Minqin (Tang et al., Reference Tang, Xu, Wu and Liu2010b), which is located in the lower reaches of the Shiyang River basin, the difference of returns between irrigated and rain-fed production was specified to lognormal distribution based on a non-parametric test. The opportunity cost, ω, is assumed to be a lognormal distribution in this study, and the expectation of opportunity cost for each town is simply ω = V i − V r (table 1), with the standard deviation of opportunity cost σω, calculated according to the following equations:


where σir2 is the covariance and ρir is the correlation coefficient between net returns of irrigation and rain-fed production. Logic suggests that the net return of rain-fed crops is highly correlated to the return of irrigated crops, although yields of irrigated crops are generally high. As the ρir cannot be observed directly, in this study, the correlation coefficient is assumed to be 0.85. In order to explore the effect of this assumption, we conducted a sensitivity analysis for a plausible range of correlation (see section 4).
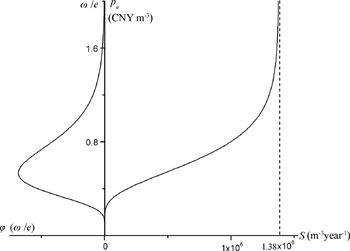
Figure 3 shows the results of the economic simulation of Huangcheng (HC). The left side of the graph shows the distribution of the difference in net returns between two production practices per unit of ecosystem services, ω/e. The tail of the distribution approaches 0 at ω/e = 1.8 CNY m−3, meaning that the opportunity cost per unit ecosystem service for nearly all farmers in HC ranges from 0 to 1.8 CNY m−3.
The spatial distribution of opportunity cost per unit of ecosystem service (left side) and the derived supply curve (right side) for Huangcheng town

The right side of the graph shows the associated supply curve for HC. The curve is positively sloped as predicted by economic theory and shows that the water supply increases with payment level, p e. Because the opportunity cost for all farmers in HC is above 0 (the lognormal assumption), no farmers will adopt rain-fed practice if no additional financial incentives are provided (p e = 0), and the amount of ecosystem service equals 0. As p e increases, the supply curve approaches the vertical asymptote equal to 860 ha × 1,600 m3 ha−1 year×1 = 1.38 × 10⁶ m3 year−1 (nearly all land changed from irrigation to rain-fed production).
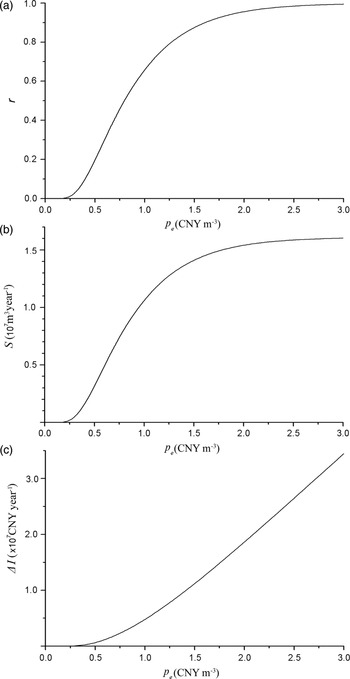
Figure 4 shows the accumulated results for the entire area. At low payment levels (p e < 0.25 CNY m−3), few farmers choose rain-fed production and little water would be saved. Conversely, water supply increases rapidly at payments above 0.25 CNY m−3. The slope of the supply curve is greatest at a price of 0.56 CNY m−3. At this point, approximately 26.2 per cent of the land enters into a contract of changing production from irrigation to rain-fed production and the supply of water equals 4.22 × 10⁶ m3 year−1. When p e = 3 CNY m−3, nearly all cropland in the study area changes from irrigation to rain-fed production (r ≈ 100 per cent). At this point, the supply curve approaches the upper bound on the supply of water in the region (approximately 1.61 × 10⁷ m3 year−1); however, payments above 2 CNY m−3 do not significantly increase water supply, as over 95 per cent of land has been converted to rain-fed production at this point.
Accumulated results for the entire study area
Notes: p e, the price for ecosystem service; r, the fraction of land participating in a payment contract; S, the total amount of ecosystem service produced per year; Δ I, the total additional income generated compared to the base scenario (no payment).

In addition to the conservation of water, PES will have another economic impact in the study area. As the majority of farmers will make rational decisions favoring safe economic return, it can be expected that individuals will not change their land management choice without an extra profit from this change. We can safely conclude that there would be considerable additional income generated by the farmers (as is shown in figure 4C).
4. Sensitivity analysis
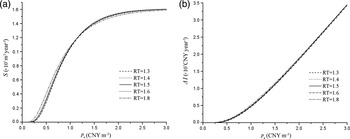
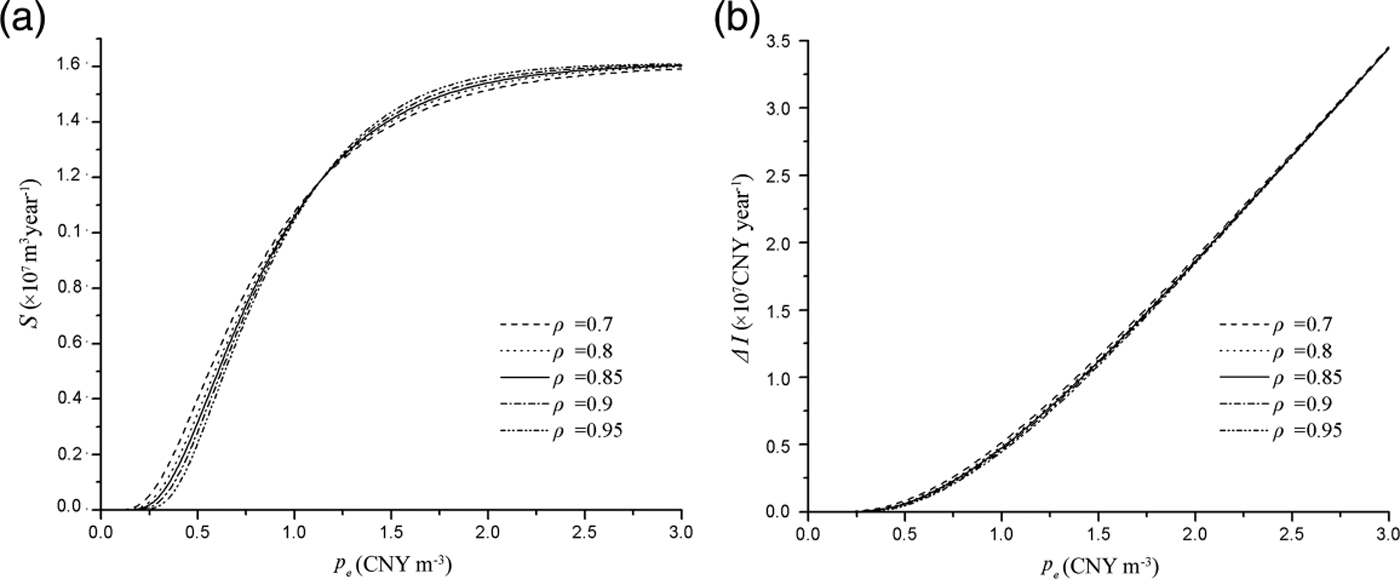
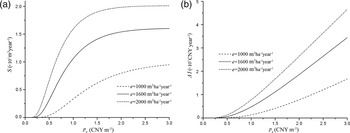
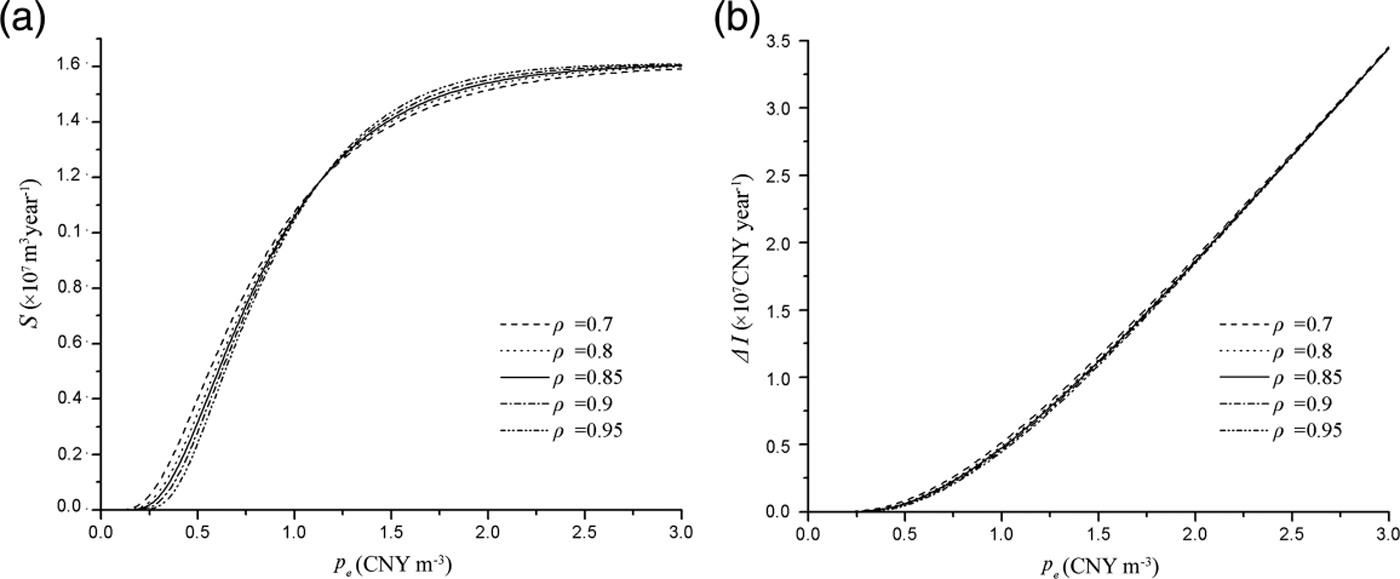
Sensitivity analysis was used to assess the effects some of the key assumptions in our calculations have on the supply of ecosystem services. Three parameters were chosen, RT (the ratio of σr to σt), ρ (the correlation coefficient between net returns of the two practices) and e (the rate of ecosystem service). The results of the sensitivity analysis are presented in figures 5–7. To facilitate comparison across scenarios, we present results using the ecosystem service supply S and the total additional income ΔI.
Sensitivity of supply and additional income to RT

Sensitivity of supply and additional income to ρ (relation coefficient)
Sensitivity of supply and additional income to ecosystem service rate (e)

Figure 5 provides a sensitivity analysis of S and ΔI to RT, holding ρ = 0.85 and e = 1, 600 m3 ha−1 year−1. According to equations (8)–(9), we know that the variance of opportunity cost can be calculated as:

where σi2 is the variance in net returns of irrigation production. Note that with RT > 1 and ρ < 1, we can conclude that RT is positive related to σω2. As presented in Antle and Valdivia (Reference Antle and Valdivia2006), the variance of the opportunity cost of changing practices plays an important role in determining the shape of the supply curve of ecosystem services. As the variance decreases and approaches zero, the supply curve approaches the shape of a step function with the step occurring at the value of p e where the mass of the distribution lies. While figure 5A shows that the RT does affect the supply curve as the theory predicts, the fact that the RT varies from 1.3 to 1.8 and supply changes by relatively small amounts suggests that the supply curve will not be substantially impacted by small errors in the estimation of RT.
Regarding ΔI, the smaller RT tends to produce a smoother curve (figure 5B); however, the difference between curves is very small and again, the ΔI is not sensitive to RT.
Figure 6 presents a sensitivity analysis of S and ΔI to ρ, holding the RT = 1.5 and e = 1600 m3 ha−1 year−1. Following equation (10), ρ is negatively related to σω2. Thus, as ρ increases, the supply curves become smoother (figure 6A) and the additional income curve (figure 6B) becomes steeper. The curves for different scenarios are reasonably close. This indicates that the correlation coefficient ρ did not have a significant impact on the ecosystem service supply S and total additional income ΔI.
Figure 7 presents a sensitivity analysis of S and ΔI to e, holding ρ = 0.85 and e = 1, 600 m3 ha−1,year−1. Contrary to RT and ρ, S and ΔI are very sensitive to e. In order to explore the impact of e quantificationally, the sensitivity analysis was performed at a fixed p e level (0.92 CNY m−3), which equals the mean opportunity cost per unit of ecosystem service for entire region. As we can see, a decrease of 37.5 per cent in e (from 1,600 m3 ha−1 year−1 to 1,200 m3 ha−1 year−1) results in a decrease of 71.1 per cent in S (from 9.7 × 10⁶ m3 year−1 to 2.8 × 10⁶ m3 year−1) and a reduction of 73.7 per cent in ΔI (from 3.91 × 10⁶ CNY m−3 to 1.03 × 10⁶ CNY m−3). An increase of 25 per cent in e (from 1,600 m3 ha−1 year−1 to 2,000 m3 ha−1 year−1) results in an increase of 54.6 per cent in S (from 9.7 × 10⁶ m3 year−1 to 1.5 × 10⁷ m3 year−1) and a reduction of 66.8 per cent in ΔI (from 3.91 × 10⁶ CNY year−1 to 6.52 × 10⁶ CNY year−1).
The price of outputs and inputs may also have a large influence on the water supply. An increase in output prices will increase the difference in returns between the two practices and more farmers will adopt irrigation production at the same p e. An increase in input price may make the crop production less profitable, which will cause more farmers to shift from irrigation to rain-fed production.
5. Discussion and conclusions
PES has the potential to contribute to the preservation of water in the upper reaches of the Shiyang River. In this study, we have shown that when sufficient economic incentives are provided to farmers to change production practice, substantial water savings could be yielded and river discharge can be increased accordingly, preventing desertification and ecosystem degradation in the whole basin, particularly in the vulnerable Minqin oasis. The results show that reduction in irrigation could generate up to 1.61 × 10⁷ m3 year−1. Due to the relatively high price elasticity of water supply (figure 4), half of this potential could be achieved at a relatively low price (0.8 CNY m−3). A recent study reported that the average cost of the western route of the South-to-North water transfer project is about 1 CNY m−3 (Tu et al., Reference Tu, Wang, Ding and Tang2010). This means the PES scheme could be competitive with other proposed policies such as the water transfer project. The irrigation water price is low (0.157 CNY m−3) in the Shiyang River basin. Under this payment level, little water would be conserved in the study area. However, the urban domestic water price and industrial water price are respectively 1.5 CNY m−3 and 1.9 CNY m−3. Under these payment levels, 40 per cent and 70 per cent of the land, respectively, can be expected to change from irrigation water to rain-fed production and, taking into account the administrative and transport costs of urban water supply (0.826 CNY m−3, according to the Government of Wuwei, 2007), over 6.44 × 10⁶ m3 year−1 and 1.27 × 10⁷ m3 year−1 could be conserved and provided downstream. This also means that the PES is practicable in the upper reaches of the Shiyang River basin and the provision of financial incentives to farmers for water conservation through changes in cropland management practices is economically feasible.
The PES approach was conceptualized and undertaken as a mechanism to improve the efficiency of natural resources management; however, it also has a significant distributional implication. According to our analysis, besides providing more water downstream, there will be considerable additional income for local farmers after the implementation of a PES scheme. As the study area is located in a national-level poor county, such a PES scheme would also contribute positively to the alleviation of poverty.
Payments for farmers to conserve water can be provided in two forms: payments for each hectare on which they change practices (area-based payments) or payments based on the quantity of ecosystem services provided (quantity-based payments). In this study, we used quantity-based payments. Because we used an average ecosystem service rate for the entire area, the results would remain the same if the area-based payment method were used. However, e is determined by a variety of relatively local factors, including climatic conditions, soil characteristics and historical land-use patterns, among other things, which are heterogeneous across land plots. When the spatial heterogeneity is taken into account, the situation will be different. Following economic principles, the payment that directly targets the ‘desired product’ is more efficient. Antle et al. (Reference Antle, Capalbo, Mooney, Elliott and Paustian2003) and Pautsch et al. (Reference Pautsch, Kurkalova, Babcock and Kling2001) show that area-based payments could potentially be up to five times more costly than quantity-based payments in carbon sequestration contracts. Furthermore, the efficiency of quantity-based payments is likely to depend on the spatial scale at which the measurement of e is made. If the measurement is made at the same scale as that at which farmers make management decisions (i.e., at the field scale), then the quantity-based payment is fully efficient in the sense that farmers have an incentive to adopt the most efficient practice on each land unit. When the goal of the decision maker is to obtain a total quantity of ecosystem service in the study area and not to obtain a specific amount at a given site, the payments could be based on an average rate of ecosystem services for the region (Antle et al., Reference Antle, Capalbo, Mooney, Elliott and Paustian2003, Reference Antle, Diagana, Stoorvogel and Valdivia2010; Antle and Valdivia, Reference Antle and Valdivia2006).
We have shown that the reduction of irrigation can contribute to water conservation through the reduction of water lost through evapotranspiration. This would enhance the discharges of the Shiyang River, which can increase the water supply of the middle and lower reaches of the basin. In this study we have only compared rain-fed agriculture with irrigated agriculture, although there may be other production practices, such as the adoption of water-saving crops and water-saving technologies. As rain-fed agriculture still consumes a considerable amount of water, it might also be a viable option to pay farmers to leave their fields partially fallow.
There is insufficient long-term locally measured data available to calibrate the results. It was shown that the output of the model is plausible and subsequently a sensitivity analysis was performed for the most important physical and economic parameters in the model, to indicate the range in which realistic results may be expected. According to the sensitivity analysis, certain assumptions and variables (such as RT and ρ) proved to have no significant influence on the simulation results, and other factors (such as e) play an important role in determining economic potential for water conservation in this region. One implication of these findings is that we may reasonably and accurately simulate the ecosystem service at the basin level without accurate knowledge of RT and ρ; however, providing a better estimate of the ecosystem service rate is critical.
Another potential issue is that we have not yet incorporated the transaction costs associated with measuring, monitoring and implementing a PES scheme. The costs are likely to vary significantly depending on the features of the program and the range of activities covered. At this point, we know little about the cost structures. Full consideration of transaction costs would likely show that the costs of water conservation in real-world situations are higher than our present estimate. This situation might lead to overstatement of the role of a PES mechanism. Thus, the transaction costs of the implementation of PES require further investigation. Moreover, there are other factors that might affect a farmer's decision making, e.g., risk aversion (Smart, Reference Smart2009) and other institutional constraints. To better assess the economic potential of PES for water conservation, detailed farm data, economic constraints and institutional factors needed to be addressed.
The objective of this study was to show that the PES concept can be applied for the conservation of water in the rural area of northwest China. The purpose of the analysis is to provide an assessment of the economic feasibility of PES with readily available data that can be carried out in a timely manner to support policy decision making. It is not intended to be a complete assessment of all the possible factors. As argued by Antle and Valdivia (Reference Antle and Valdivia2006), the MD approach, which was used in this study, is motivated by the fact that policy makers demand timely, quantitative information with a sufficient level of detail, which needs to be accurate within an order of magnitude.
Conservation of water is not straightforward. Hence, we believe that our research is an incomplete attempt to quantify this issue. Notwithstanding these limitations, this study has produced some important findings, which might help to raise awareness about the potential of PES to conserve water. Also, there are many policy questions which remain unaddressed. Further research and pilot projects are needed to better assess the magnitude of transaction costs and other factors that are related to water conservation for small-scale farmers in areas such as the rural regions of China.