Introduction
The long-established view of intellectual abilities in autism spectrum disorders (ASDs) was that up to 75% of individuals had an intellectual disability (previously referred to as ‘mental retardation’; Schalock et al. Reference Schalock, Luckasson, Shogren, Borthwick-Duffy, Bradley, Buntinx, Coulter, Craig, Gomez, Lachapelle, Reeve, Snell, Spreat, Tasse, Thompson, Verdugo, Wehmeyer and Yeager2007), defined by an IQ <70, alongside accompanying impairment in everyday functioning (Volkmar et al. Reference Volkmar, Lord, Bailey, Schultz and Klin2004; Tsatsanis, Reference Tsatsanis, Volkmar, Paul, Klin and Cohen2005). Furthermore, a widespread clinical view is that Performance IQ (PIQ) was commonly higher than Verbal IQ (VIQ) (e.g. Lincoln et al. Reference Lincoln, Allen, Kilman, Schopler and Mesibov1995; Mayes & Calhoun, Reference Mayes and Calhoun2003). It has been reported that individuals who show a particularly discrepant PIQ–VIQ profile (those with a non-verbal advantage) have higher levels of social impairment, increased head circumference and enlarged brain volume (Joseph et al. Reference Joseph, Tager-Flusberg and Lord2002; Tager-Flusberg & Joseph, Reference Tager-Flusberg and Joseph2003; Black et al. Reference Black, Wallace, Sokoloff and Kenworthy2009). Another widely accepted view is that, at a subtest level (e.g. on Wechsler intelligence tests), a characteristic profile of strengths (or ‘peaks’) on subtests such as Block Design and weaknesses (or ‘troughs’) on subtests such as Comprehension is found (Happé, Reference Happé1995; Lincoln et al. Reference Lincoln, Allen, Kilman, Schopler and Mesibov1995; Mayes & Calhoun, Reference Mayes and Calhoun2003; de Bruin et al. Reference de Bruin, Verheij and Ferdinand2006).
However, many of these widely held views about the intelligence of children with an ASD were first formed several decades ago when our conceptualization of autism, in terms of to whom the diagnosis is applied and how prevalent the disorder is, was very different from today and historical data might not apply to children who currently receive an ASD diagnosis (Charman et al. Reference Charman, Pickles, Chandler, Wing, Bryson, Simonoff, Loucas and Baird2009; Fombonne, Reference Fombonne2009). Most studies have used clinically ascertained cohorts and there has been limited evidence presented within an epidemiological framework. The prevalence of ASD is now recognized to be between 60 and 116 per 10 000, depending on the strictness with which the diagnostic criteria are applied (Baird et al. Reference Baird, Charman, Baron-Cohen, Cox, Swettenham, Wheelwright and Drew2000, Reference Baird, Simonoff, Pickles, Chandler, Loucas, Meldrum and Charman2006; Chakrabarti & Fombonne, Reference Chakrabarti and Fombonne2005; Green et al. Reference Green, McGinnity, Meltzer, Ford and Goodman2005; CDC, 2009).
There is evidence from epidemiological studies by Bertrand et al. (Reference Bertrand, Mars, Boyle, Bove, Yeargin-Allsopp and Decoufle2001) and Chakrabarti & Fombonne (Reference Chakrabarti and Fombonne2005) that only approximately 50% of children with ASD have intellectual disability (IQ<70), although this rose to approximately 60% and 70% respectively for the more narrowly defined autism group. However, both of these studies had only moderate sample sizes (n=42; Bertrand et al. Reference Bertrand, Mars, Boyle, Bove, Yeargin-Allsopp and Decoufle2001; n=57, with cognitive data; Chakrabarti & Fombonne, Reference Chakrabarti and Fombonne2005). By contrast, in another prevalence study with a much larger sample (n=987, of whom n=880 had psychometric or developmental test data), 68% had intellectual disability (Yeargin-Allsopp et al. Reference Yeargin-Allsopp, Rice, Karapurkar, Doernberg, Boyle and Murphy2003).
As part of a prevalence study of ASD we assessed a group of 158 children aged 9–14 years with an ASD drawn from a geographically defined population in the Special Needs and Autism Project (SNAP; see Baird et al. Reference Baird, Simonoff, Pickles, Chandler, Loucas, Meldrum and Charman2006 for details). A sample weighting procedure enabled us to estimate characteristics of the total population of children with an ASD. This provided us with the opportunity to examine the following questions regarding the profile of cognitive abilities and adaptive behaviour of children with ASD within an epidemiological framework:
(1) What proportion of children with an ASD have severe/profound, moderate and mild intellectual disability?
(2) What proportion of children with an ASD have average or above average intellectual ability?
(3) Does intellectual ability differ in girls and boys with an ASD?
(4) Is there a characteristic PIQ–VIQ profile and are there peaks (e.g. in Block Design) and troughs (e.g. in Comprehension) on the Wechsler subtests?
(5) What is the level of adaptive behaviour in children with ASD and what characteristics are associated with adaptive behaviour?
Method
The study was approved by the South East Multicentre Research Ethics Committee (REC) (00/01/50).
SNAP cohort
The SNAP sample was drawn from a total population cohort of 56 946 children. As it was not possible to screen all children for ASD efficiently, we adopted a screening, stratification and weighted epidemiological design to target the subgroup most at risk for ASD (see Baird et al. Reference Baird, Simonoff, Pickles, Chandler, Loucas, Meldrum and Charman2006 for details). All those with a current local clinical diagnosis of ASD (n=255) or considered ‘at risk’ for being an undetected case on the grounds of having a statement of Special Educational Needs (SEN; n=1515) but not with a local clinical diagnosis were surveyed (mean age 10.3 years, s.d.=1.1) using the Social Communication Questionnaire (SCQ; Berument et al. Reference Berument, Rutter, Lord, Pickles and Bailey1999). A statement of SEN is a legal document issued by UK local education authorities when children require significant additional support in school due to any learning and/or behavioural problems. Note that this is likely to skew captured cases to the lower IQ cases but it does allow an epidemiological design to be adopted using a statistical weighting procedure based on all those approached for screening. A stratified subsample (coincidently also n=255; 223 boys, 32 girls) drawn from across the range of SCQ scores received a comprehensive diagnostic assessment including standardized clinical observation [Autism Diagnostic Observation Schedule – Generic (ADOS-G); Lord et al. Reference Lord, Risi, Lambrecht, Cook, Leventhal, DiLavore, Pickles and Rutter2000] and parent interview assessments of autistic symptoms [Autism Diagnostic Interview – Revised (ADI-R); Lord et al. Reference Lord, Rutter and Lecouteur1994], language and IQ, psychiatric co-morbidities and a medical examination.
The age at which participants were assessed ranged from 9.8 to 14.5 years (mean 11.5 years, s.d.=0.9). On the basis of all available information, the team used ICD-10 (WHO, 1993) research criteria to derive a clinical consensus diagnosis of childhood autism (n=81; 77 boys, four girls) and ‘other ASDs’ (n=77; 65 boys, 12 girls). Of the 77 cases with consensus diagnosis of ‘other ASDs’, six met ICD-10 criteria for ‘atypical autism’ due to late onset, 61 for ‘atypical autism’ due to subthreshold symptomatology, seven for ‘pervasive developmental disorder unspecified’ due to lack of information (incomplete assessment, adopted children for whom early history was not available) and three for ‘overactive disorder associated with mental retardation and stereotyped movements’ (see Baird et al. Reference Baird, Simonoff, Pickles, Chandler, Loucas, Meldrum and Charman2006 for details). Ninety-seven children did not meet clinical consensus diagnosis for childhood autism or other ASD, although with one exception they met criteria for another ICD-10 neurodevelopmental condition. The present paper does not report further on these non-ASD cases.
Measures
Adaptive behaviour was assessed using the Vineland Adaptive Behavior Scales – Expanded Edition (VABS; Sparrow et al. Reference Sparrow, Balla and Cichetti1984; n=140). IQ was measured using the Wechsler Intelligence Scale for Children (WISC-III-UK; Wechsler, Reference Wechsler1992; n=127), Raven's Standard Progressive Matrices (SPM) or Coloured Progressive Matrices (CPM; Raven, Reference Raven, Court and Raven1990 a, Reference Raven, Court and Ravenb), depending on the child's ability. For the 21 cases where SPM (n=2) or CPM (n=19) but not WISC full-scale IQ (FSIQ) values were available, imputed FSIQs were obtained using the regression relationship of FSIQ to SPM/CPM IQ within each diagnostic group. For the 10 cases where no direct cognitive testing was possible, eight cases had an Adaptive Behaviour Composite (ABC) score on the VABS below 20 and these cases were assigned an IQ score of 19 to reflect their profound level of intellectual disability; two cases had no IQ test data and no VABS data and were excluded from the current analysis, leaving a final sample of n=156 (81 childhood autism, 75 other ASD; 16 girls, 140 boys).
Statistical analysis
Stratification of the screened ASD/SEN sample was based on whether a child had a locally recorded ASD diagnosis (yes/no) and four levels of SCQ score [low score (<8), moderately low score (8–14), moderately high score (15–21), high score (>22); see Fig. 1 in Baird et al. Reference Baird, Simonoff, Pickles, Chandler, Loucas, Meldrum and Charman2006 for details]. Use of weights allowed all statistics such as proportions, means and group differences to be presented as target population estimates, taking account not only of the differences in sampling proportions according to SCQ score and local ASD diagnosis but also the differential response to the SCQ associated with a prior local ASD diagnosis, health district and child's sex. All reported frequencies are unweighted. Standard deviations, Wald test statistics (adjusted t and F tests) and p values were calculated using the linearization version of the robust parameter covariance matrix as implemented by the svy procedures of Stata 9 (Stata, 2005).
Results
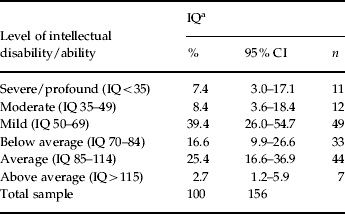
The weighted mean (s.d.) IQ for the total ASD sample was 69.4 (24.1). IQ was similar for the childhood autism [67.9 (24.0)] and other ASD [70.1 (24.2)] groups (t=0.43, p=0.67). Table 1 shows the mean weighted proportion [with 95% confidence intervals (CIs)] of the sample falling into each of the ICD-10 categories of ‘intellectual disability’ (‘mental retardation’), and also those falling into the below average (70–84), average (85–99, 100–114) and above average (>115) IQ ranges.
IQ for the total ASD sample (weighted %; 95% CIs; actual n)

ASD, Autism spectrum disorder; CI, confidence interval.
a Imputed IQ; see text for details of imputation.
Of the total ASD sample, 55.2% (95% CI 42.1–67.7) were in the intellectual disability range (IQ<70), 39.4% in the mild (50–69), 8.4% in the moderate (35–49) and 7.4% in the severe (20–34, 1.9%) or profound (<20, 5.5%) intellectual disability ranges. These proportions were similar for the childhood autism and other ASD subgroups who did not differ from one another [childhood autism: 53.2% (<70), 35.2% (50–69), 10.1% (35–49), 7.9% (<35) versus other ASD: 56.2% (<70), 41.5% (50–69), 7.5% (35–49), 7.2% (<35); weighted χ2=0.13, p=0.94]. Of the children outside the intellectual disability range, 16.6% of the total ASD sample were in the below average IQ range (70–84), 25.4% in the average (85–114) and 2.7% in the above average (>115). These proportions were similar for the childhood autism and other ASD subgroups who did not differ from one another [childhood autism: 18.4% (70–84), 26.5% (85–114), 1.9% (>115) versus other ASD: 15.7% (70–84), 24.9% (85–114), 3.1% (>115); weighted χ2 = 0.11, p = 0.93].
The mean (s.d.) imputed IQ of 61.8 (16.3) for girls (actual n=16, weighted n=37) was marginally lower than that for boys [71.7 (25.6); actual n=140; weighted n=119] (t=1.97, p=0.05). A total of 78.4% (95% CI 43.7–94.5) of girls had an intellectual disability (IQ<70) compared to 48.0% (95% CI 35.9–60.5) of boys, a proportion that just missed significance (weighted χ2=3.64, p=0.06).
Of the total ASD sample (61 childhood autism, 66 other ASD; 116 boys, 11 girls), 127 were able to complete 10 subtests (five Performance, five Verbal) of the WISC-III. Table 2 presents the FSIQ, PIQ and VIQ scores for the total ASD sample and the childhood autism and other ASD subgroups, and for the groups with and without intellectual disability. Using weighted paired t tests, PIQ was marginally higher than VIQ (t=1.85, p=0.07) for the total ASD sample but not for the childhood autism or other ASD subgroups (both p>0.10). For the subgroup with WISC-FSIQ <70, PIQ and VIQ were not different and for the subgroup with WISC-FSIQ >70, PIQ was marginally higher than VIQ (t=1.75, p=0.09).
Mean (s.d.) WISC-III FSIQ, PIQ and VIQ scores for the total ASD sample and the diagnostic and IQ subgroups

WISC-III FSIQ, Wechsler Intelligence Scale for Children III, full-scale IQ; PIQ, Performance IQ; VIQ, Verbal IQ; ASD, autism spectrum disorder; s.d., standard deviation.
Values in rows with different superscripts are significantly different from each other.
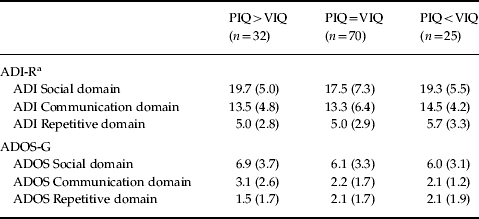
However, the above analyses apply to group mean differences only. To determine the PIQ–VIQ discrepancy profiles at the level of the individual child, the proportion of children with a clinically significant PIQ–VIQ discrepancy from the standardization of the test of ⩾12 points (Wechsler, Reference Wechsler1992) was examined by creating three groups: PIQ >VIQ, PIQ=VIQ and PIQ <VIQ. The (weighted) proportions of the respective three groups were: 28.3, 58.8 and 12.9% for the total ASD sample, 26.9, 52.7 and 20.4% for the childhood autism subgroup and 28.9, 61.3 and 9.8% for other ASD subgroup. In each case the most common subgroup was the PIQ=VIQ subgroup. However, when the proportions of children with clinically discrepant profiles (i.e. PIQ>VIQ versus PIQ<VIQ excluding children with PIQ=VIQ) were compared using weighted logistic regression, there was a significantly higher proportion of children with PIQ>VIQ than PIQ<VIQ in the total ASD sample (t=2.10, p=0.04) and a non-significant trend to such a difference in the other ASD group (t=1.92, p=0.07). Weighted regressions show that the PIQ–VIQ profile groups did not differ on either their past symptom severity (ADI-R 4-to-5/ever algorithm scores) or their current symptom severity (ADOS-G algorithm scores) (all p>0.18); see Table 3.
Mean (s.d.) ADI-R and ADOS-G scores for the PIQ–VIQ discrepancy subgroups

ADI-R, Autism Diagnostic Interview-Revised; ADOS-G, Autism Diagnostic Observation Schedule-Generic; PIQ, Performance IQ; VIQ, Verbal IQ; ASD, autism spectrum disorder; s.d., standard deviation.
a ADI-R 4-to-5-years or ever domain scores according to the manual algorithm.
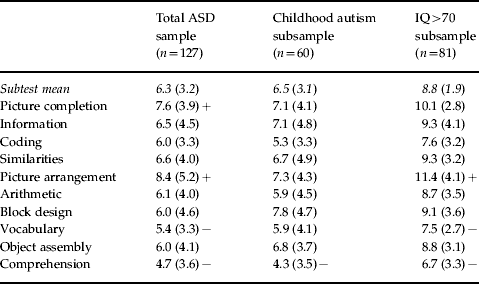
The individual WISC subtest scores and the mean subtest score are shown in Table 4 for the total ASD sample and the childhood autism and high IQ (>70) subgroups, with the latter two subgroups being selected as most likely to show the characteristic subtest profile for parsimony. To examine the subtest profile, a series of weighted paired tests was conducted to determine whether each subtest score was significantly different from the subtest mean score across 10 subtests. To take account of multiple comparisons, a Bonferroni correction was applied so that significance was set at p<0.05/30 (or p<0.001). Table 4 shows which subtests were above (+) and below (−) the mean. For the total ASD sample and the high IQ subsample, Picture arrangement was above the subtest mean and Vocabulary and Comprehension were below the subtest mean. For the total ASD sample, only Picture completion was also above the subtest mean. For the childhood autism subgroup, no subtests were above the subtest mean and only Comprehension was below.
Weighted mean (s.d.) subtest scores on the WISC-III

WISC-III, Wechsler Intelligence Scale for Children Third Edition; ASD, autism spectrum disorder; s.d., standard deviation.
+ Subtest significantly above subtest mean (p<0.001); −, Subtest significantly below subtest mean (p<0.001).
In total, 124 participants completed the SPM and the WISC-III. Following Dawson et al. (Reference Dawson, Soulières, Gernsbacher and Mottron2007) and Bölte et al. (Reference Bölte, Dziobek and Poustka2009), we compared the IQ scores across the different instruments. SPM IQ [88.3 (18.1)] was significantly higher (weighted paired t test) than both the WISC FSIQ [75.6 (20.4)] and WISC PIQ [79.9 (21.9)] scores (t=7.78 and t=4.37, both p<0.001). Of the children who completed the SPM, 14.5% (95% CI 7.3–26.8) had an SPM IQ <70.
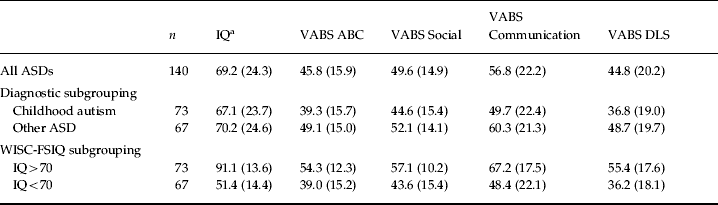
Adaptive behaviour
Adaptive behaviour scores as measured by the VABS are shown in Table 5, which also shows the imputed IQ for the participants with VABS data (excluding the eight cases who had no WISC, SPM or CPM test score and who were assigned an imputed IQ score of 19 on the basis of their VABS standard score <20). ABC was lower than IQ for the total ASD sample (t=7.73, p<0.001; weighted paired t test) and for the childhood autism and other ASD subgroups (t=15.3 and t=5.1, both p<0.001) and high and low IQ subgroups (t=16.5 and t=4.3, both p<0.001). Analysing the between-domain differences for the total ASD only (for reasons of parsimony as the pattern was similar across all four subgroups), showed that Communication domain scores were higher than Social and Daily Living Skills (DLS) domain scores (t=2.64, p<0.01 and t=8.24, p<0.001 respectively) and DLS domain scores were lower than Social domain scores (t=224, p<0.03). A weighted multivariate linear regression was run to identify the unique associations to adaptive behaviour (VABS ABC score) with imputed IQ, previous symptom severity (ADI-R 4-to-5 years Social, Communication and Repetitive domain scores) and current symptom severity (ADOS-G Social, Communication and Repetitive domain scores) entered as predictors. Only IQ (β=0.33, t=4.97, p<0.001) and ADI-R 4-to-5 years Social domain score (β=−0.99, t=3.73, p<0.001) were associated with adaptive functioning.
VABS standard scores for the total ASD sample and the diagnostic and IQ subgroups

ASD, Autism spectrum disorder; VABS, Vineland Adaptive Behavior Scale; ABC, Adaptive Behavior Composite; DLS, Daily Living Skills; WISC-FSIQ, Wechsler Intelligence Scale for Children, full-scale IQ.
Values given as mean (standard deviation).
a Imputed IQ; see text for details of imputation.
Discussion
This study adds to our understanding of the level and profile of intelligence of children with an ASD in several ways. First, it confirms findings from other recent epidemiological studies that only approximately half of individuals with ASD have intellectual disability (Bertrand et al. Reference Bertrand, Mars, Boyle, Bove, Yeargin-Allsopp and Decoufle2001; Chakrabarti & Fombonne, Reference Chakrabarti and Fombonne2005) and fewer than one in five have moderate to severe disability (IQ<50). The present sample is considerably larger than in both these previous studies and the coverage of modern, well-standardized IQ assessments is more complete. The childhood autism and other ASD groups did not differ from one another, either in terms of the group mean IQ (~70 in both groups) or in the proportion of children who met criteria for intellectual disability (IQ<70). Second, we report for the first time within an epidemiological study that the proportion of children with an ASD with average intelligence (85–114) is approximately one quarter and the proportion with above average IQ (<115) is a few per cent. Marginally more girls than boys had an intellectual disability; however, the low number of girls assessed (n=14) means that the CIs for these analysis are wide and overlapping and this finding requires confirmation in future studies.
These findings need to be understood in the context of the particular sampling framework that we adopted in the prevalence study (see Method and Baird et al. Reference Baird, Simonoff, Pickles, Chandler, Loucas, Meldrum and Charman2006). We only screened children with a statement of SEN or a local clinical diagnosis of ASD; this was to avoid screening all 57 000 children, which would have been both impractical and inefficient. There are a many reasons why children in the area in the late 1990s would have received statements, but problems in development and learning, in addition to problems in behaviour, and/or a known medical condition that might require recognition and/or support at school would be the most common reasons. Thus, we will have not have ascertained some cases of ASD who had not been recognized by local teams by the age of 10 years and who had not been deemed in need of support in school. These are likely to have been cases of average or above average intelligence. That is, our sampling frame was biased in the direction of lower intelligence individuals, making it likely that our finding that half of children with an ASD have an IQ of ⩾70 should be considered a minimum estimate.
In terms of IQ profiles, we found weak support for a distinctive PIQ–VIQ profile. Although at a group mean level PIQ was higher than VIQ (but only by a few points), when examined at the level of clinically meaningful PIQ–VIQ discrepancies the most common profile was for PIQ to be similar to VIQ. When the frequency of PIQ >VIQ was compared to the opposite pattern (VIQ>PIQ) it was found to be slightly more common. These findings are a contrast to some previous studies that found larger PIQ advantages compared to VIQ (e.g. Lincoln et al. Reference Lincoln, Allen, Kilman, Schopler and Mesibov1995; Mayes & Calhoun, Reference Mayes and Calhoun2003). We found no support for the idea that individuals with a non-verbal advantage have higher levels of social impairment, casting doubt on this as a putative meaningful subgroup (Joseph et al. Reference Joseph, Tager-Flusberg and Lord2002; Tager-Flusberg & Joseph, Reference Tager-Flusberg and Joseph2003; Black et al. Reference Black, Wallace, Sokoloff and Kenworthy2009).
There was some support for a distinctive profile at the WISC subtest level but it was only partly consistent with much of the previous literature. In line with other studies we found that performance on the Vocabulary and Comprehension subtests was poor compared to other abilities. However, neither Block design nor Object assembly were significant strengths, as has been reported previously (Happé, Reference Happé1995; Lincoln et al. Reference Lincoln, Allen, Kilman, Schopler and Mesibov1995; Mayes & Calhoun, Reference Mayes and Calhoun2003; Caron et al. Reference Caron, Mottron, Berthiaume and Dawson2006). Instead, Picture completion and Picture arrangement, which both rely heavily on visual materials, were areas of strength (‘peaks’) in the total ASD sample and in the subgroup with IQ >70, although somewhat counter-intuitively the latter also taps some level of social understanding (order events in time, many with drawn human characters).
The fact that some widely held clinical views about the relative strengths and weakness of the intelligence in individuals with ASD were not supported in this epidemiological study might have reflected the fact that, in clinical samples, language delay and weaker verbal than non-verbal skills are an essential part of the reason for referral for many children with ASD. We were able to test this in the current study by looking at the profiles for children who had received a local clinical diagnosis as opposed to a research ICD-10 consensus diagnosis as part of the research study, using the sampling design to estimate prevalence (weighted estimates were 58% of children with childhood autism and 23% of children with other ASD had a local clinical diagnosis; see Baird et al. Reference Baird, Simonoff, Pickles, Chandler, Loucas, Meldrum and Charman2006 for details). The children with a local diagnosis seen as part of the present study (n=87) had a higher IQ [80.0 (20.3)] than the cases with an ICD-10 research diagnosis, probably because many of the children who, within the study design following independent and thorough assessment, met our research ASD criteria had low IQ and a local clinical diagnosis of developmental delay/intellectual disability. However, there was little evidence of a PIQ [80.9 (19.4)] versus VIQ [82.7 (21.9)] discrepancy and at the level of WISC subtests their pattern was very similar to that reported in Table 4, with the two lowest subtests being Coding and Comprehension and the two highest being Picture completion and Picture arrangement (data not shown, available on request from the corresponding author).
IQ measured by the SPM was 20 points higher than WISC-FSIQ, as has been reported previously by Dawson et al. (Reference Dawson, Soulières, Gernsbacher and Mottron2007) and Bölte et al. (Reference Bölte, Dziobek and Poustka2009), and only 14.5% scored <70. There has been discussion as to whether this represents an isolated skill for individuals with ASD or whether it is indicative of intact cognitive processing abilities that are not represented in the higher-order cognitive processing abilities tapped by broader intelligence tests, such as the WISC, that in part test social learning in addition to intelligence (see Dawson et al. Reference Dawson, Soulières, Gernsbacher and Mottron2007; Bölte et al. Reference Bölte, Dziobek and Poustka2009).
Overall adaptive outcome was significantly lower than IQ and the discrepancy was most notable in the high IQ subgroup, where adaptive behaviour scores lagged ~35 points behind IQ. This demonstrates that the picture seen in clinical cohorts (Carpentieri & Morgan, Reference Carpentieri and Morgan1996; Liss et al. Reference Liss, Harel, Fein, Allen, Dunn, Feinstein, Morris, Waterhouse and Rapin2001; Klin et al. Reference Klin, Saulnier, Sparrow, Cicchetti, Volkmar and Lord2007; Saulnier & Klin, Reference Saulnier and Klin2007) is true more generally of the whole population of children with ASD and is not an artefact of referral bias of the more adaptively impaired children to clinical services. Also notable was the fact that it was in the domain of DLS that children with ASD lagged furthest behind their age peers. Higher IQ and less severe social ASD symptoms at 4–5 years were associated with better overall adaptive outcome at age 11 years. Although in a cross-sectional study we are unable to securely answer the question as to how social impairments lead to poorer development of adaptive competencies, autism significantly impairs everyday functioning. One important clinical conclusion is that, because a child scores well on an IQ test, notwithstanding the promise this suggests in terms of academic progress, this should not be mistaken for their ability to cope in the everyday world, which can be considerably impaired even for the most ‘high functioning’ individual.
Strengths and limitations of the present study
The strengths of the present study include: the epidemiological framework of the study using a stratification design and population weighting procedure; and the comprehensive diagnostic assessment and use of a clinical consensus decision-making process that was corroborated by independent expert rating (see Baird et al. Reference Baird, Simonoff, Pickles, Chandler, Loucas, Meldrum and Charman2006). However, although the epidemiological stratification design allows us to derive population estimates using sampling weights, the decision to only screen cases with a local clinical diagnosis and/or children with a statement of SEN means that we will not have captured all higher IQ children with an ASD. Another limitation of the present study is that the study is cross-sectional and included children of one age only drawn from an 18-month birth cohort. Consequently, we are unable to comment on how the profile of IQ and adaptive behaviour might vary at a group or an individual level across childhood. The age of the sample is also a strength, in that diagnosis by this age is relatively secure, and in that direct cognitive testing is possible at this age with all but the most profoundly intellectually disabled children.
Conclusions
Some long-held clinical views were not supported at a population level: only half of the children with ASD had an intellectual disability; children with ASD did not show the commonly understood characteristic profile on the WISC either in terms of PIQ–VIQ discrepancy or in terms of peak skills on particular WISC subtests. Adaptive behaviour was significantly poorer than other skills, reflecting how maladaptive it is to grow up as a child with autism in a world where social interaction and communication are central to so much of everyday life. One further feature that is notable in the present epidemiological sample that has been previously described in clinical and research cohorts (Charman et al. Reference Charman, Taylor, Drew, Cockerill, Brown and Baird2005; Lord et al. Reference Lord, Risi, DiLavore, Shulman, Thurm and Pickles2006) is the variability of outcome by middle children in terms of IQ, and to a lesser extent adaptive behaviour. An important task for future work, including in both prospective studies of population cohorts and in intervention trials, is determining endogenous and exogenous factors that explain this great variability in outcome.
Acknowledgements
We are grateful to the children and families who participated in the study and to the clinical teams in South Thames, whose collaboration made the study possible. We thank the expert group, P. Bolton, A. Cox, A. Gilchrist, R. Landa, A. Le Couteur, C. Lord, L. Pedersen and M. Rutter. Thanks also to I. Carcani-Rathwell, G. Pasco, S. Ross, E. Rowley, V. Slonims and M. Turner for their help with assessments. The study was funded by the Wellcome Trust and the Department of Health, UK.
Declaration of Interest
A.P. receives royalties from the SCQ and ADOS-G.