1. Introduction
The environmental impact of aviation continues to provide an impetus for aircraft designers to pursue more energy-efficient commercial transport aircraft. Due to the significant reduction in skin friction that can be achieved in a laminar boundary layer compared with a turbulent boundary layer, the implementation of laminar flow surfaces can make a substantial impact in this area. Despite the large potential gains in performance, this approach is only recently beginning to make its way onto commercial transport aircraft due to the technical challenges associated with maintaining laminar flow on operational aircraft, particularly those with swept wings. While some companies are already implementing natural laminar flow on their transport aircraft surfaces, such as Boeing's 737 MAX Winglet and the 787 engine nacelles (Malik et al. Reference Malik, Crouch, Saric, Lin and Whalen2016), the wings, which provide a much larger surface area and, therefore, much more potential for drag reduction, remain largely untapped. Reliably avoiding premature transition when small protuberances or excrescences are present on the surface remains a significant challenge, as this could result in a significant or even complete loss of any drag reduction benefit. These excrescences could be the result of insect contamination during operation, or the result of necessary manufacturing defects, such as steps, gaps or bolts. In order to maintain confidence in the sustainability of the transition delay over substantial portions of the flight time, achievable (i.e. not too conservative) manufacturing tolerances need to be defined. To do this, we need to be able to accurately predict critical roughness heights.
Understanding the mechanisms that cause transition when surface imperfections are present will aid in the development of better prediction models for acceptable roughness levels. In addition to improving our predictive capability with regards to surface excrescences, the flow over a backward-facing step (BFS) is of interest for a variety of other reasons. The flow field topology is similar to other separated flows, such as that caused by adverse pressure gradients, and, therefore, the findings could be applied to improve our understanding of the transition process in other separated flow fields. Additionally, as will be shown in this study, a BFS (and, in particular, a swept BFS) sets up a rich steady and unsteady instability environment in which complex instability interactions can be studied in detail. This is of great interest from a fundamental perspective.
Backward-facing steps can impact the boundary-layer transition process through different physical mechanisms, including the destabilization of convective instabilities, increased receptivity to free-stream disturbances, global or absolute instabilities associated with the recirculation region that forms downstream of the step, or some combination of these mechanisms. The fundamental understanding of two-dimensional (2-D) BFS flows has received a significant amount of attention in the literature, though most of these studies were performed for internal channel flows and involve very large steps relative to the boundary-layer thickness. Thus, the instability mechanisms from these studies may not be directly applicable to the present study. In particular, these BFS channel flows are often characterized by the presence of absolute instabilities (Gartling Reference Gartling1990; Gresho et al. Reference Gresho, Gartling, Torczynski, Cliffe, Winters, Garratt, Spence and Goodrich1993; Barkley, Gomes & Henderson Reference Barkley, Gomes and Henderson2002; Loiseau et al. Reference Loiseau, Robinet, Cherubini and Leriche2014). Absolute instabilities are not expected to occur in the present case due to the very low value of the maximum recirculation velocity ( ${<}0.05\ U_e$), which is well below even the minimum values (16 %–20 %
 $U_e$) found in the literature required for the presence of absolute instabilities (Hammond & Redekopp Reference Hammond and Redekopp1998; Diwan Reference Diwan2009).
Kelvin–Helmholtz (KH) instabilities can be introduced by the step due to the shear layer formed by the separated region downstream of the step. This has been observed in both internal and external flows (Kaltenbach & Janke Reference Kaltenbach and Janke2000; Rani & Sheu Reference Rani and Sheu2006; Rani, Sheu & Tsai Reference Rani, Sheu and Tsai2007; Schäfer, Breuer & Durst Reference Schäfer, Breuer and Durst2009; Schröder et al. Reference Schröder, Schanz, Heine and Dierksheide2013; Hu, Hickel & Van Oudheusden Reference Hu, Hickel and Van Oudheusden2020), though typically these studies were performed for relatively large BFS heights ( $h>\delta$). It is also well known that a BFS can cause the destabilization of already-existent boundary-layer instabilities, in particular, Tollmien–Schlichting (TS) waves (Wang & Gaster Reference Wang and Gaster2005; Crouch, Kosorygin & Ng Reference Crouch, Kosorygin and Ng2006; Hildebrand, Choudhari & Paredes Reference Hildebrand, Choudhari and Paredes2020). In fact, this forms the basis for a semi-empirical transition prediction method known as the
 $\Delta N$ method (Wörner, Rist & Wagner Reference Wörner, Rist and Wagner2002; Crouch et al. Reference Crouch, Kosorygin and Ng2006; Drake et al. Reference Drake, Bender, Korntheuer, Westphal, McKeon, Gerashchenko, Rohe and Dale2010), which is a higher-fidelity alternative to the historical empirical correlations (Holmes et al. Reference Holmes, Obara, Martin and Domack1985). An empirical equation is used to estimate an expected increment in
 $N$-factor (i.e. the
 $\Delta N$) across the 2-D excrescence. More recent work by Hildebrand et al. (Reference Hildebrand, Choudhari and Paredes2020) resulted in better agreement with experimental results across a broad range of parameters by computing the
 $N$-factor envelope for the basic state distorted by the BFS.
These studies have focused on 2-D (unswept) geometries, but the effect of 2-D steps on swept-wing transition has gained more interest recently. The inclusion of sweep is important as this impacts the types of instabilities that are present in the flow. In particular, the addition of sweep introduces crossflow instabilities into the flow. This work has generally been limited to observing the behaviour of the transition front as the step height is increased (Perraud & Seraudie Reference Perraud and Seraudie2000; Duncan, Crawford & Saric Reference Duncan, Crawford and Saric2013), but more recently, researchers have begun to study the flow in more detail. These studies are important because of the complexity of the transition process over excrescences. Duncan et al. (Reference Duncan, Crawford, Tufts, Saric and Reed2014) performed hot-wire measurements downstream of forward- and backward-facing steps to determine the effect of the steps on stationary crossflow (SCF) instabilities. They found that the steps destabilized the SCF instabilities. The forward-facing step (FFS) caused a larger growth of the SCF than the BFS. Tufts et al. (Reference Tufts, Reed, Crawford, Duncan and Saric2017) performed direct numerical simulations to study the interaction between SCF instabilities and a 2-D step excrescence. The BFS was found to have only a small impact on the SCF instability, as also observed experimentally by Duncan et al. (Reference Duncan, Crawford, Tufts, Saric and Reed2014) and Eppink et al. (Reference Eppink, Wlezien, King and Choudhari2018). This also agrees with the direct numerical simulations of Balakumar, King & Eppink (Reference Balakumar, King and Eppink2014).
Tufts et al. (Reference Tufts, Reed, Crawford, Duncan and Saric2017) also computed the existence of a travelling crossflow instability using biglobal stability analysis. This instability was destabilized only in the recirculation region downstream of the step. Most recently, Cooke (Reference Cooke2020) performed linearized harmonic Navier–Stokes (LHNS) computations for several swept-wing excrescence types, including forward- and backward-facing steps. Downstream of the BFS, several unstable regions were identified using linear stability theory, and they found the travelling crossflow instability to be much more dangerous than the SCF instability. However, the LHNS computations generally predicted a stabilizing effect of the BFS, leading the authors to draw the conclusion that the instability mechanisms occurring shortly downstream of a BFS are highly nonlinear. Experiments by Eppink et al. (Reference Eppink, Wlezien, King and Choudhari2018) revealed the existence of three families of unsteady instabilities downstream of the BFS, the lowest frequency of which corresponded to a spanwise-travelling crossflow-like mode, but with a wavelength on the order of 3–4 times the SCF wavelength. The higher-frequency instabilities were identified as TS and KH instabilities, the former of which was destabilized by the introduction of the adverse pressure gradient downstream of the step, and the latter of which was destabilized by the shear layer that forms due to the recirculation downstream of the step. These unsteady instabilities were only measured when the step was present, and they existed with and without artificial forcing of the SCF instabilities. The unsteady instabilities were found to be modulated due to interactions with the SCF vortices. In a similar experiment, Saeed, Mughal & Morrison (Reference Saeed, Mughal and Morrison2016) applied 2-D strips on a swept wing, and found a similar range of unsteady instabilities that were destabilized.
Recent work has also explored the impact of shaping the step, using ramps, to mitigate the impact of the step (Eppink Reference Eppink2020a). For the large step height under consideration (76 % of the boundary-layer thickness), a very long ramp ( $\approx$20 times the step height) was necessary to significantly delay transition, though the full laminar flow length of the baseline case was not restored. The long ramp was necessary in order to prevent or significantly attenuate the impact of the recirculation region that forms downstream of the step. The ramp appeared to be very successful at damping out the low-frequency travelling crossflow instability, indicating this instability is primarily linked to the recirculation region, as observed by Tufts et al. (Reference Tufts, Reed, Crawford, Duncan and Saric2017). However, in our previous measurements (Eppink et al. Reference Eppink, Wlezien, King and Choudhari2018), this instability continued to grow downstream of reattachment, which may indicate that nonlinear interactions contribute to the persistence of this instability. Additionally, the ramp was not completely successful at preventing the higher-frequency instabilities, corresponding to TS or shear-layer instabilities, the latter of which existed due to the shear layer that bounds the recirculation region.
These results highlight the complex nature of the flow field established by a BFS. Due to the limited nature of hot-wire measurements, many of the details of these flows could not be explored in previous studies, and many questions remained unanswered, particularly in regards to the nature of the interactions between the different types of instabilities and the mechanism(s) by which transition occurred. In swept-wing flows, the SCF instability is typically the dominant transition mechanism, leading to breakdown via the amplification of high-frequency secondary instabilities. However, with the addition of the step, unsteady instabilities are introduced, of similar amplitude to the SCF vortices, and the breakdown scenario is much less well understood. Instability interactions have been studied in other contexts, including the interaction between KH and Klebanoff modes, which leads to a spanwise modulation of the KH instability (Hosseinverdi & Fasel Reference Hosseinverdi and Fasel2018). Similarly, the interaction of stationary and travelling crossflow instabilities leads to the spanwise modulation of the unsteady fluctuations associated with the travelling instability (Bippes Reference Bippes1999). Similar spanwise modulations of the unsteady instabilities have been seen in the present scenario, resulting from interactions of the unsteady instabilities with the SCF vortices. Bonfigli, Kloker & Wagner (Reference Bonfigli, Kloker and Wagner2003) computationally studied the same case as Bippes (Reference Bippes1999) and found that the interaction of the stationary and travelling crossflow vortices resulted in a complex interaction, characterized by mutual induction of the velocity fields associated with the two instabilities, and resulting in the formation of interaction vortical structures (IVS) associated with each SCF vortex. They also associate the passage of these interaction vortices with the generation of a spike-like velocity signal. Wassermann & Kloker (Reference Wassermann and Kloker2005) studied the interaction between SCF and TS instabilities in adverse pressure gradient flow. The interaction of the TS-instability with the crossflow vortices resulted in the formation of an oblique pair of TS modes, which acted as ‘low-frequency secondary modes’. In some cases, these secondary modes represented detuned modes – i.e. modes with a larger wavelength than the spanwise vortex spacing, and with a phase shift (in time) from vortex to vortex. This was shown to result in the asynchronous appearance of the secondary instabilities along the SCF vortices.
With the implementation of stereo time-resolved particle image velocimetry (TRPIV) measurements, we are able to obtain time-resolved measurements of all three velocity components. This allows for a detailed probing of the flow and a deeper understanding of the complex interactions that lead to transition. The goal of the current work is to better understand the interactions occurring between the instabilities, and to study the mechanisms leading to transition. The paper is laid out as follows. Section 2 provides a description of the experimental set-up and the cases that were studied. Section 3 provides background on some of the data analysis techniques used throughout the paper. Finally, the results and discussion are presented in § 4, beginning with a brief discussion of the effects of the step on the mean flow (§ 4.1) and the SCF instability (§ 4.2), and concluding with an in-depth analysis of the unsteady instabilities in §§ 4.3–4.6.
2. Experimental set-up
The experiment was performed in the  $2\, {\rm ft} \times 3\, {\rm ft}$ low speed boundary-layer channel at the NASA Langley Research Center. The tunnel is a closed circuit facility with a 0.61 m high by 0.91 m wide by 6.1 m long test section. The tunnel can reach speeds up to 45 m s
 $^{-1}$ (
 $Re'=2.87\times 10^6$ m
 $^{-1}$) in the test section. Free-stream turbulence intensity levels,
 $Tu=({1}/{U_{\infty }})\sqrt {\frac {1}{3}(u^{'2}+v^{'2}+w^{'2})}$, were measured using a crosswire in an empty test section to be less than 0.06 % for the entire speed range of the tunnel, and less than 0.05 % for the test speed of 26.5 m s
 $^{-1}$. This value represents the total energy across the spectrum, high-pass filtered at 0.25 Hz. Thus, this tunnel can be considered a low-disturbance facility for purposes of conducting transition experiments (Saric & Reshotko Reference Saric and Reshotko1998).
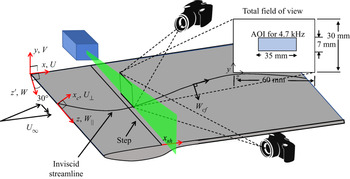
The 0.0127 m thick flat plate model consists of a 0.41 m long leading edge piece, swept at 30 $^{\circ }$, and a larger downstream piece with unswept trailing edge (see figure 1). The model is 0.91 m wide (thus, spanning the width of the test section) and 2.54 m long on the longest edge (i.e. top edge in figure 1). The plate-normal placement of the downstream or leading edge pieces can be adjusted relative to each other using precision shims to create either forward-facing or backward-facing 2-D steps of different heights, parallel with the leading edge. The leading edge piece was polished to a surface finish of 0.2
 $\mathrm {\mu }$m root mean square (r.m.s.), and the larger downstream plate had a surface finish of 0.4
 $\mathrm {\mu }$m r.m.s. A leading edge contour was designed for the bottom side of the plate in order to make the suction-peak less severe and, therefore, avoid separation, which could potentially cause unsteadiness in the attachment line.
Top view of PIV set-up.

A three-dimensional (3-D) pressure body along the ceiling was designed to induce a streamwise pressure gradient, which, along with the sweep, causes SCF growth. A second purpose of the ceiling liner was to simulate infinite swept-wing flow within a midspan measurement region of width 0.3 m. This was achieved by designing the liner such that the  $C_p$ contours were parallel with the leading edge within the measurement region. The ceiling liner was fabricated out of a hard foam using a computer-controlled milling machine.
Due to the complexity of the flow field, it is sometimes necessary to examine different components of velocity. The coordinate systems used are defined in figure 1. The streamwise direction (i.e. tunnel axis) is denoted by  $x$, whereas
 $x_c$ denotes the chordwise direction normal to the swept leading edge. The velocity components along the
 $x$ and
 $x_c$ directions are denoted by
 $U$ and
 $U_{\perp }$, respectively. The direction parallel to the leading edge is denoted by
 $z$, with the velocity component in that direction denoted by
 $W_{\parallel }$. Finally, the velocity in the direction normal to the local inviscid streamline is denoted by
 $W_{cf}$. The mean disturbance quantities, which are acquired by subtracting the spanwise-averaged profile from each individual profile at a given
 $x_c$ location, are denoted using capital letters with an apostrophe, such as
 $U'$. The time-fluctuating components are denoted using lower-case letters with an apostrophe, e.g.
 $u'$.
All measurements were performed at a free-stream velocity of 26.5 m s $^{-1}$ (
 $Re=1.69\times 10^6$ m
 $^{-1}$). The current experiment utilized a leading edge roughness configuration consisting of discrete roughness elements (DREs) with a diameter of 4.4 mm. The DREs were applied approximately 50 mm downstream of the leading edge (near the computed SCF branch-I position) with a spanwise spacing,
 $\lambda _z$, of 11 mm and were approximately 20
 $\mathrm {\mu }$m thick. In one case, the DREs were stacked to create a total thickness of 40
 $\mathrm {\mu }$m. The spacing of the DREs (11 mm) corresponds to the most amplified SCF wavelength calculated for the baseline case with no step. For more details of the experiment set-up, refer to Eppink et al. (Reference Eppink, Wlezien, King and Choudhari2018).
A high-speed double-pulsed Nd:YLF laser provided the laser sheet for the PIV measurements (see figure 1). The laser sheet was set up parallel with the leading edge and the BFS. The two high-speed 4 Mpixel cameras that were used to acquire the TRPIV measurements were placed downstream of the step. One was placed on the outboard side of the test section at approximately 30 $^{\circ }$ to the laser sheet, and the second camera was placed on the inboard side (in backward scattering) at an angle of approximately 45
 $^{\circ }$ to the laser sheet (figure 1). To achieve the desired field of view and resolution, 300 mm lenses were utilized, resulting in a total possible measurement area of approximately
 $60\,\textrm {mm}\times 30\,\textrm {mm}$ along the
 $z$ and
 $y$ directions, respectively. For the majority of the measurements, the area of interest was reduced to approximately
 $35\,\textrm {mm}\times 7\,\textrm {mm}$ to obtain an acquisition rate of 4.7 kHz. This area allowed acquisition of approximately three wavelengths of the SCF instability in a single frame, while still acquiring approximately 15 points (using 75 % overlap and
 $32\times 32$ pixel interrogation size) inside the boundary layer, with wall-normal resolution of approximately 0.16 mm. For these measurements, 10 000 image pairs were acquired. All cameras and the laser were mounted on the same traversing system, which allowed measurements at multiple locations with relative ease. An oil-based fog machine generated the seeding with a particle size of approximately 1
 $\mathrm {\mu }$m, which was introduced downstream of the test section.
2.1. Overview of cases studied
Three different BFS heights were studied for the present work, corresponding to heights of 49 %, 51 % and 57 % of the local unperturbed boundary-layer thickness at the step location. The smallest step height studied,  $h/\delta =0.49$, corresponds to the largest step height that was reported in the hot-wire campaign for the same experimental set-up (Eppink et al. Reference Eppink, Wlezien, King and Choudhari2019). This step height is just beyond the critical step height, in that transition had begun to move upstream when the step height was increased to this height. For all three cases, results were acquired with a single layer of approximately 20
 $\mathrm {\mu }$m-thick DREs applied to the leading edge. In addition, a fourth case was included to determine the effect of the initial SCF instability amplitude on the results. For the BFS height of
 $h/\delta =0.49$, two layers of DREs were stacked, resulting in a final DRE height of approximately 40
 $\mathrm {\mu }$m. Unless otherwise indicated, the results throughout this paper refer to the cases with a single layer of DREs. Some dimensional quantities of interest for the present study are included in table 1.
Dimensional quantities of interest.

For most cases, time-resolved results were acquired in sparsely spaced planes that were generally spaced approximately 12.7 mm apart in the streamwise direction. However, for the  $h/\delta =0.49$, 20
 $\mathrm {\mu }$m DRE case, time-resolved results were acquired with a finer streamwise spacing of approximately 6.35 mm. In addition, measurements were performed in two planes upstream of the
 $h/\delta =0.49$ BFS for both DRE configurations in order to determine the SCF amplitudes before any interaction with the step occurred. Due to physical constraints with the current PIV set-up, measurements could only be acquired up to approximately 94 mm downstream of the step.
One additional case is briefly discussed in this work, primarily as a means to verify some of the data processing techniques that are used. This case was part of a different measurement campaign, and is not well suited for direct comparison to the current measurements; however, it does provide some important clarifying information. This case consisted of measurements performed over a larger BFS,  $h/\delta =0.73$, with a single layer of DREs, and with forcing supplied by a set of speakers located in the settling chamber upstream of the test section, at a frequency of 1 kHz. The TRPIV measurements were phase locked to the signal supplied to the speakers, and were performed at a higher sampling rate of 8 kHz. To obtain this higher sampling rate, a smaller sampling region was acquired, approximately 12 mm wide in the spanwise direction. For these measurements, the streamwise spacing of the planes was set to 2 mm, and the data were acquired up to approximately 40 mm downstream of the step. In the interest of time, only 6000 image pairs were obtained for these measurements. The phase-locked measurements allow rebuilding of the 3-D velocity field at the forcing frequency by performing phase averaging.
3. Data analysis techniques
3.1. Validation and uncertainty
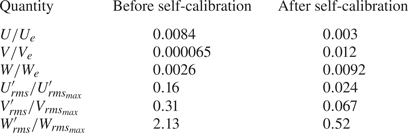
Particle image velocimetry measurements have not been utilized very frequently for boundary-layer transition studies and, thus, it is beneficial to examine how well this measurement technique compares with a well-trusted technique, such as hot-wire anemometry. In addition, the current set-up is challenging, particularly due to the large focal length and magnification. This measurement technique can be beneficial for many reasons, including the fact that it allows instantaneous measurements of all three velocity components, if a stereo configuration is utilized. However, for the current set-up, the primary flow direction is out-of-plane, and the smallest velocity component ( $V$) is one to two orders of magnitude smaller than this primary velocity. This makes it difficult to resolve the smaller velocity components accurately. Without an understanding of the uncertainty in the measurements, it is difficult to confidently draw conclusions based on the results. Thus, a rigorous attempt was made to estimate the uncertainty of the measurements and to validate the measurements against hot-wire measurements when possible. These results are presented by Eppink (Reference Eppink2019). Overall, the PIV and hot-wire measurements showed very good agreement in both the mean and unsteady measurements that we were able to compare. Since the hot-wire measurements were acquired using a single wire, only the streamwise velocity component was compared. The good agreement provides confidence that the PIV technique is not affecting transition (due to the introduction of particles into the flow), and that it is able to resolve the same types of instabilities that were measured with the hot wire. The uncertainty analysis also helped to provide confidence in the results, while also highlighting the main error sources that could occur. One of the biggest problems that can affect the accuracy of the results is stereo registration error, which results from a misalignment of the laser plane with the calibration plane. This misalignment results in an incorrect combination of velocities from the two cameras, resulting in a bias error. Typically, a self-calibration is applied to correct for the misalignment, but the self-calibration was found to have mixed results. In general, the self-calibration was quite effective at correcting the stationary crossflow amplitude, but would sometimes introduce additional error into the spanwise-averaged mean results. Thus, our approach was to perform our best attempt at a calibration, perform the self-calibration to correct for any small misalignment, and use a simple approach, presented in Eppink (Reference Eppink2019) to estimate the maximum error that would be encountered due to an assumed maximum misalignment of the laser plane and calibration target.
The stereo registration error results in discrepancies in velocity due to the velocity gradients that exist in the flow. Thus, the larger the velocity gradient, the larger the error. By extension, larger SCF amplitudes will result in larger errors. However, results for two different cases (no-step and  $h/\delta =0.7$ FFS cases) indicate that the percent error for the
 $U$ SCF amplitude is consistently around 16 %–17 % of the peak SCF amplitudes, which were 3.5 % and 9.6 % of
 $U_e$, respectively. The
 $V$-component of the SCF vortices was too low to measure above the noise for the no-step case, but for the 1.7 mm FFS case, the percent error was approximately 31 %, where the
 $V'_{rms}$ amplitude was approximately 0.7 %
 $U_e$. The
 $W$-perturbation profiles were affected the most by the stereo registration error. Maximum percent errors were 146 % and 213 %, where the max
 $W'_{rms}$ amplitudes were 3 % and 3.5 %
 $U_e$, respectively. After the self-calibrations were applied, these percent errors were reduced drastically to approximately 2.4 % for
 $U'_{rms}$, 6.7 % for
 $V'_{rms}$, and 52 % and 33 %, respectively, for
 $W'_{rms}$. Note that the
 $W'_{rms}$ errors are still quite large. However, for the purposes of this paper, we focus primarily on the
 $U'_{rms}$ and
 $V'_{rms}$ results, so the large
 $W'_{rms}$ error is not a major concern. The other quantities that are presented in this paper include spanwise-averaged mean profiles. The self-calibration had mixed results on the estimated errors for these spanwise-averaged profiles. The errors presented here are normalized by the
 $U_e$ velocity, rather than the local velocities, to provide a consistent comparison for each velocity component. The maximum errors for the spanwise-averaged profiles before the self-calibration is applied are 0.84 %, 0.0065 % and 0.26 % of
 $U_e$ for the
 $U$,
 $V$ and
 $W$ components, respectively. After the self-calibration is applied, these maximum percent errors become 0.3 %
 $U_e$, 1.2 %
 $U_e$ and 0.92 %
 $U_e$, respectively. Most notably, the percent errors increase substantially for the
 $V$ and
 $W$ components after the self-calibration is applied. This increased error primarily occurs near the free stream. The maximum errors that were estimated are also summarized in table 2 for ease of comparison. For the results presented in this paper, a self-calibration was performed after initially performing the physical calibration and attempting to align the calibration target as closely as possible to the actual laser plane. Thus, there may be some additional error caused by the self-calibration process, but we gain the benefit of the self-calibration on improving the accuracy of the stationary crossflow instabilities.
Maximum errors estimated from stereo PIV-measured profiles.

3.2. Spectral proper orthogonal decomposition
Spectral proper orthogonal decomposition (SPOD) is a modal decomposition technique that is similar to the snapshot proper orthogonal decomposition (POD) method, but provides the added benefit of including frequency information. The approach used in this paper is the one described by Schmidt & Colonius (Reference Schmidt and Colonius2020), in which POD is applied to the fast Fourier transform of the data. The SPOD results presented in § 4.3 were computed using a block size of 200 frames, with 50 % overlap. All three velocity components were included in the computation. The results from this specific SPOD analysis consisted of 99 modes for each of the 101 frequency bands, with a frequency resolution of  $\Delta f=23.5$ Hz. Because of the presence of the instabilities in the flow downstream of the step, the data are generally found to be low rank, which means that the data can be represented by a single or a small number of basis vectors. This can be inferred from the SPOD spectra (or eigenvalues), which are also returned for each mode as part of the SPOD analysis. It is generally found that, shortly downstream of the step, the first mode contains significantly more energy than the rest of the modes. Farther downstream, the second modes at some frequencies tend to become important, as will be discussed in § 4.3. Example spectra can be found later on in figure 11, which also includes 95 % confidence intervals for the first three modes (figure 11b,c). The confidence intervals are computed as described by Schmidt & Colonius (Reference Schmidt and Colonius2020), and are fairly consistent from case to case. The computed 95 % confidence intervals correspond to an approximately
 $\pm$8 % change in the amplitude of the velocities represented by each SPOD mode. Since the SPOD modes are used primarily to determine qualitative properties of the different instabilities in the flow, this level of uncertainty is deemed entirely acceptable. It should be noted that since SPOD relies on the Fourier transform of the data to perform the decomposition, the modes are necessarily assumed to be sinusoidal and stationary. Thus, it should be kept in mind that this approach will likely work well in the linear state, but not necessarily for the nonlinear state, and may result in the loss of some higher-order information. However, even in the most nonlinear of cases presented in this work (largest step height and largest SCF amplitude), a comparison of the SPOD modes with regular POD modes revealed no significant differences.
The SPOD modes that are returned as a result of the analysis are in the form of complex numbers, thus, they include phase and amplitude information and can be reconstructed throughout a cycle for a given frequency. For instance, the reconstructed velocity for SPOD mode  $m$,
 ${\mathsf{U}}_m$, corresponds to
 ${\mathsf{U}}_m = {\mathsf{A}}_m \sin (\varPhi _m + \phi )$, where
 ${\mathsf{A}}_m$, a 2-D matrix, is the magnitude of the SPOD mode at each (
 $y,z$) location,
 $\varPhi _m$, also a 2-D matrix, is the phase of the SPOD mode, and
 $\phi$ corresponds to the constant phase shift applied to the mode, which would cycle from 0 to 2
 ${\rm \pi}$ in the full cycle reconstruction of the mode. The modes presented in § 4.3 are shown as snapshots of the mode at a single time in the cycle (for example, see figure 12), as this is typically easier to present and understand physically than a 2-D map of the amplitude and phase, the latter of which can be difficult to unwrap in two dimensions, and, thus, can be misleading. Videos of each of the modes are also included in the supplemental material available at https://doi.org/10.1017/jfm.2021.925.
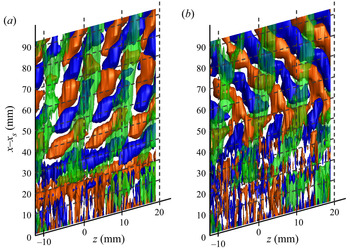
The SPOD results are also used to reconstruct a limited subsection of the results in three dimensions. The basic idea of this approach was used by Schmidt & Colonius (Reference Schmidt and Colonius2020) to reconstruct data in multiple streamwise planes by matching the phase of the modes at the boundaries of the planes. In the current paper, the data are acquired in spanwise planes, so reconstruction in three dimensions relies on a few assumptions. The first assumption is that the streamwise phase speed of the mode at a given frequency is already known. In the current case, we can rely on hot-wire measurements that were performed previously for the same set-up (Eppink et al. Reference Eppink, Wlezien, King and Choudhari2018), in which the phase speed and wave direction were computed by using simultaneous measurements from a fixed and traversing hot-wire. Given that the PIV results were already shown to compare favourably with the hot-wire measurements (Eppink Reference Eppink2019), it is likely safe to assume that the use of those measured phase speeds is valid in the current study. The second assumption is that the consecutive PIV measurement planes were acquired with a sufficiently small streamwise spacing to properly resolve the streamwise wavelength of the instability. Additionally, the primary SPOD mode under consideration must not change significantly between the consecutive stations. For the current measurements, this is only true for the smallest step height studied,  $h/\delta =0.49$, in which measurements were acquired at a finer streamwise resolution (6.35 mm) than for any of the other cases. In fact, even for this case, we are limited in the maximum frequency at which we can perform this reconstruction, because at frequencies greater than approximately 300 Hz, the streamwise spacing of the measurements is no longer sufficiently small to resolve the smaller streamwise wavelengths. Thus, this analysis is only performed for two frequencies: 117 and 260 Hz. The former lies in the lower-frequency band corresponding to a spanwise-travelling crossflow mode, while the latter corresponds to the primarily streamwise-travelling TS mode.
The reconstruction is performed as follows. First, the SPOD analysis is performed at each of the stations. The SPOD mode of interest (i.e. the first or second mode at a given frequency) is then extracted for each plane. Next, it is necessary to determine the phase shift,  $\phi$, to apply to the SPOD modes at each station, since we do not have an absolute phase reference. A sequential analysis is performed in which the SPOD mode at station
 $i+1$ is compared with the SPOD mode at station
 $i$ to find the correct phase shift to apply to the mode at station
 $i+1$ so that the reconstructed velocities match between the two stations (i.e. this would physically correspond to a streamwise phase speed of 0). The reconstructed velocity of the SPOD mode at station
 $i+1$,
 ${\mathsf{U}}_m^{i+1}$, is computed for each
 $\phi$ from 0 to 2
 ${\rm \pi}$. Then, the difference is computed between each of these
 ${\mathsf{U}}_m^{i+1}$, and the previous result at station
 $i$,
 ${\mathsf{U}}_m^i$, (which is fixed at its previously computed
 $\phi ^i$), to find the
 $\phi ^{i+1}$ that produces the minimum difference between the two modes:
 $min({\mathsf{U}}_m^{i+1}(\phi =0\cdots 2{\rm \pi} )-{\mathsf{U}}_m^i(\phi ^i))$. This difference is computed by comparing each pixel of the reconstructed velocities at the two stations. This process is repeated until the optimal
 $\phi$ is found at each station. Again, this process requires that the modes do not change substantially between each streamwise station, otherwise, it would not be possible to find a good match. This should be the case if the flow is adequately resolved in the streamwise direction. Finally, the previously measured phase speed is utilized to determine the additional phase shift required between each pair of adjacent stations to achieve the proper phase speed in the reconstructed results. Using the approach described above, we can reconstruct an entire cycle of the mode in three dimensions. Similar to the SPOD snapshots at a single plane, these results are presented as single snapshots in time in § 4.3 for illustrative purposes (see figure 18), but are also included as videos in the supplemental material. The results of this analysis can be useful for understanding the downstream development of the unsteady instabilities, but they must be interpreted with care, as it has not been extensively verified as being an accurate representation of the flow in three dimensions.
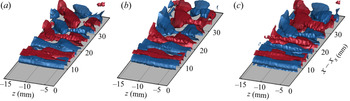
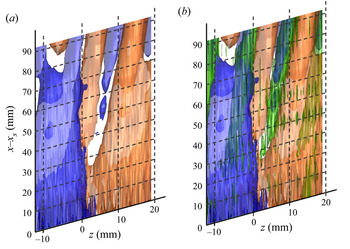
This reconstruction technique was tested by applying it to the data that were acquired downstream of the  $h/\delta =0.73$ step. Since these data were phase locked, it is possible to perform the SPOD reconstruction for the 1 kHz mode and compare with the phase-averaged results. For this analysis, we compare the SPOD reconstruction using the phase as measured (i.e. relying on the phase locking), and using the streamwise phase speed that was measured for the 1 kHz instability using two hot-wire probes downstream of the
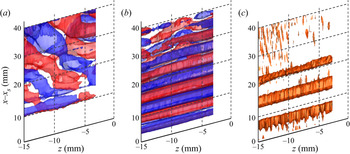
 $h/\delta =0.49$ BFS. The result from this analysis is illustrated in figure 2, as well as in the supplemental video for figure 2. There are some noticeable differences between the SPOD reconstructed result using the hot-wire measured phase speed (figure 2a), and the phase-averaged data (figure 2c), particularly when comparing the streamwise wavelength and the angle of the oblique structures farther downstream. However, the overall qualitative behaviour of the instability is still captured well by the SPOD reconstruction, namely, the transition from the 2-D wavefront near the step to the more oblique structure farther downstream. Given the rather significant difference in step height, as well as the fact that the large amount of forcing applied in the present case likely leads to some nonlinear behaviour, the agreement is really quite surprising. However, better agreement can be achieved by using the correct phase speed, which, in this case, can be done by relying on the phase locking with the applied forcing signal. In this case, that simply amounts to computing the SPOD modes and using a phase shift of 0 for every plane. No phase matching or phase shifting is necessary. These results, illustrated in figure 2(b) agree even better with the phase-averaged results. This illustrates that with the correct phase, one can use this technique to adequately reconstruct the flow field in three dimensions, in order to obtain a qualitative picture of the downstream development of the instability. Of course, in the following discussion of the results (§ 4.3), the measurements were not obtained with forcing or a phase reference of any kind. Therefore, we must rely on the previously measured (hot-wire) phase speeds, which are expected to match well given that the step height is the same for which the hot-wire measurements were acquired (
 $h/\delta =0.49$), and the fact that there is no forcing applied that would possibly change the behaviour of the instabilities.
Isosurfaces of positive (red) and negative (blue)  $u'$-velocity,
 $h/\delta = 0.73$ step with 1 kHz forcing. (a) Spectral POD reconstructed data using hot-wire measured phase speed for the
 $h/\delta =0.49$ BFS, (b) SPOD reconstructed data using measured phase (relying on phase locking), and (c) phase-averaged data.

3.3. Conditional space–time POD
The conditional space–time POD (Schmidt & Schmid Reference Schmidt and Schmid2019) is an approach that can be used to analyse rare or intermittent events occurring in time-resolved data. Essentially, the method consists of performing POD on a set of event realizations. The event realizations consist of space–time data, centred in time around the event occurrence, and consisting of a certain number of time steps, predetermined by the user. The resulting modes are coherent in space and over the predetermined time horizon.
The events first need to be identified using some predetermined criterion. In the present case, we are interested in studying an event that occurs at certain locations downstream of the step, which manifests as large amplitude velocity fluctuations. These so-called ‘spike’ events, which will be discussed in much more detail in § 4.6, occur intermittently, and, thus, are not captured well by the SPOD analysis. The events for the conditional space–time POD (CSTPOD) analysis, are chosen based on the occurrence of these large spikes in the velocity signal at a particular location. The spikes are first determined from the time-series data at a particular location. In order to remove any points that might be spuriously identified as a spike due to local noise in the PIV measurement, we first perform a POD reconstruction, rebuilding the data from the first 40 modes. Next, the skewness is computed at each point, and the regions of maximum negative skewness are identified. For example, in figures 22 and 23, the point of maximum skewness near  $z=-3$ mm is used. Once the point is identified, a peak-finding algorithm is applied to the time series data at this point, in order to locate the negative peaks in the
 $u'$-velocity below a certain threshold. The peaks must be separated by at least five points in time to be considered unique peaks. For consistency, this threshold is chosen as twice the r.m.s. of the
 $u'$-velocity at that point.
Once the event times are chosen, the time-resolved PIV data are broken into segments centred around those times. The length of these time segments was chosen to be 31 time steps (6.6E-3 seconds). It is possible that the events may be spaced closer than 31 time steps, resulting in overlapping time segments. Larger length time segments were also explored, but were not found to result in any additional insight.
3.4. Intermittency calculation
One way of quantifying the level of turbulence in a transitional boundary layer is to compute the intermittency of the flow. This value ranges from 0 to 1, and is essentially meant to be a measurement of the proportion of the signal that is turbulent due to the passage of turbulent spots. There are many different methods that have been developed to attempt to quantify the intermittency (Hedley & Keffer Reference Hedley and Keffer1974; Kuan & Wang Reference Kuan and Wang1990; Schneider Reference Schneider1995; Zhang, Chew & Winoto Reference Zhang, Chew and Winoto1996; Fransson, Matsubara & Alfredsson Reference Fransson, Matsubara and Alfredsson2005). However, there is no universal technique that works for every type of flow. The reason is that any intermittency calculation relies on the selection of a threshold value, which often involves a certain level of subjectivity. Even so, once the technique is applied consistently to a particular flow, the results can be useful. Generally, the computation of intermittency relies on the ability to detect the fine-scale features of the flow, typically applied by examining the high-frequency components of the fluctuating velocity at a given point in the flow field. In the present case, several problems are encountered when using the standard intermittency approaches. First, due to limitations of the experimental measurement technique, the sampling rate of the experiment (4700 Hz) is too low to adequately resolve the high-frequency components of the velocity fluctuations. Second, due to large intermittent velocity fluctuations (the so-called ‘spike’ events that will be described later), it is difficult to distinguish between these events (which are not turbulent), and the actual turbulent events by simply applying a threshold to the fluctuating velocity or the time derivative of the velocity signal. Thus, a different approach was developed in order to estimate the intermittency of the PIV measurements. The main premise of this approach is that the small scales caused by the breakdown of the flow can be distinguished in space, rather than in time. Since the spatial resolution that was obtained with these measurements was quite good (0.16 mm), we are more likely to obtain a good result using the spatial scales rather than temporal scales. In addition, since the spike events typically occur with spatial wavelengths of the order of 11 mm, this technique can be used to filter out those larger scales, and, thus, it will be immune to the effect of those large amplitude velocity fluctuations.
The first step of the current process, for each plane of data, is to obtain the spanwise wavenumber spectra at each wall-normal location, for each of the 10 000 snapshots. The spectra are then integrated above a cutoff wavenumber of 0.3 mm $^{-1}$ in order to exclude the larger scales, and averaged over all wall-normal locations from
 $y=0.5$ to 4 mm. The wavenumber cutoff of 0.3 mm
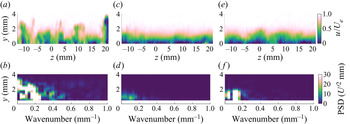
 $^{-1}$ was chosen based on the wavenumber content in most of the laminar snapshots due to the SCF instability wavelength of 11 mm. For illustration, several examples of flow fields and their corresponding wavenumber spectra are shown in figure 3. These figures include a snapshot in which the flow is undergoing breakdown to turbulence, a laminar snapshot and a snapshot in which the spike mechanism is occurring. In comparing the wavenumber content of the breakdown snapshot (a) to the laminar snapshot (c), there is a clear increase in the scales above
 $k=0.3$ mm
 $^{-1}$, in addition to an increase in energy of the larger wavelength scales. However, comparing to the spike snapshot (e), both flow fields exhibit an increase in the lower wavenumber content, but only the breakdown snapshot includes an increase in the smaller scales (larger wavenumbers). Note that the data points nearest to the wall (
 $y<0.5$ mm) are excluded from the wavenumber analysis because this helps to eliminate noisy measurements due to reflections, which can result in a large spurious increase in smaller wavelength content.
Example flow fields (a,c,e) and wavenumber spectra (b,d,f) for a (a,b) transitional snapshot, (c,d) laminar snapshot and (e,f) ‘spike’ snapshot.

Once the wavenumber spectra have been integrated above 0.3 mm $^{-1}$ and averaged over the
 $y$-axis for each snapshot, a threshold is applied to determine which of the snapshots correspond to mostly transitional or turbulent flow, and which ones correspond to laminar snapshots. This was done by examining individual snapshots and determining which value best represented a transitional value. As mentioned previously, this is a somewhat subjective decision. This decision was based primarily on the appearance of the snapshot in question, and whether it more closely resembled the mean flow (laminar) or had smooth regular contours (spike), or whether there was a significant amount of smaller wavelength content and the flow departed significantly from the mean flow (transitional). Despite the subjectiveness of the process, once the threshold was determined, we were able to apply the same threshold for every single case and location. Thus, the comparison between cases is consistent.
4. Results and discussion
4.1. Effect of steps on mean flow
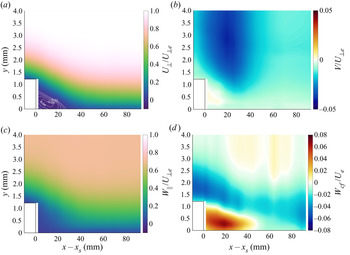
The time-averaged results are presented in this section. Figure 4 shows spanwise-averaged velocities upstream and downstream of the  $h/\delta =0.49$ BFS for each of the three velocity components, as well as the crossflow
 $W_{cf}$ component. The
 $x$–
 $y$ plane results presented throughout the paper are reconstructed from the spanwise planes that were acquired at multiple streamwise locations. The results presented in figure 4 were acquired with a streamwise resolution of 6.35 mm. The crossflow velocity component is the velocity in the direction normal to the external inviscid streamline. The angle between the
 $W_{\parallel }$ and
 $W_{cf}$ components ranges from approximately 35
 $^{\circ }$ to 36
 $^{\circ }$ over the measurement region. The white lines in figure 4(a) indicate regions of reversed flow, where the velocity normal to the step (
 $U_{\perp }$) is less than or equal to 0. Also note that measurements were started approximately 2 mm downstream of the step, so the white region downstream of the step at
 $x-x_s=0$ indicates a lack of measurement data in that region. Similar to previous measurements (Eppink et al. Reference Eppink, Wlezien, King and Choudhari2019), the recirculation velocity field is fairly weak (the largest contour is
 $-$0.04) and extends approximately 30 mm downstream of the step (which corresponds to approximately 12.5
 $\delta$). Figure 4(d) indicates the presence of a crossflow-reversal region downstream of the step. The typical crossflow direction (in the absence of the step) is negative, but, due to the adverse pressure gradient produced by the step, a region of positive crossflow occurs near the wall. The region of positive crossflow extends farther than the recirculating region, to approximately 50 mm downstream of the step. Similar behaviour has also been observed downstream of a FFS for the same experimental set-up (Eppink Reference Eppink2020b), though the crossflow-reversal region was typically quite small in those cases. The direction and strength of the crossflow velocity component can be important in determining the behaviour of the crossflow instabilities.
Spanwise-averaged velocity profiles upstream and downstream of the  $h/\delta = 0.49$ step, for the (a)
 $U_{\perp }$, (b)
 $V$, (c)
 $W_{\parallel }$ and (d)
 $W_{cf}$ velocity components. White lines in (a) indicate regions of reversed flow (
 $U_{\perp }\leq 0$).

In general, over the range of step heights studied, there were not many significant or interesting differences observed in the mean flow behaviour. While it is true that an increase in the step height led to a slight increase in the separation bubble length, the coarse spacing of measurement planes does not allow an accurate measurement of that value, particularly over such a small range of heights, in which the differences are likely very small. However, we can state that there was no reversed flow present by  $x-x_s=25$ mm for both of the
 $h/\delta =0.49$ cases, whereas for the two larger step heights, there was still some small amount of reversed flow at this location. For those two cases, the flow was fully reattached by the next measurement station,
 $x-x_s=38$ mm. The strength of the recirculation (i.e. maximum negative velocity) did increase slightly with step height, from approximately 4 % to 4.7 %
 $U_{\perp _e}$, across the range of step heights studied. There were also some noticeable differences in the crossflow velocity component, as illustrated in figure 5 for several selected locations downstream of the step. Interestingly, all cases are very similar near the step, except for the
 $h/\delta =0.57$ case, in which the peak negative and positive crossflow values are lower than all other cases, particularly the negative peak. However, as one might intuitively expect, the strength of the positive crossflow region near the wall increases for the larger step heights as the flow progresses downstream of the step.
Crossflow velocity profiles.

4.2. Effect of step height on SCF
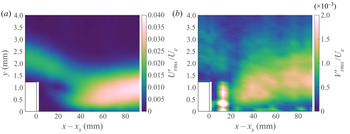
Figure 6 shows the  $U$- and
 $V$-perturbation profiles upstream and downstream of the
 $h/\delta =0.49$ BFS. The
 $U$-perturbation profiles are calculated from the r.m.s. of the steady disturbance velocity (
 $U'$) across the span (integrated across a wavelength range of 5 to 20 mm). The steady disturbance velocity (
 $U'$) is the time-averaged velocity at each location minus the spanwise-averaged velocity at the same wall-normal location. The
 $V$-perturbation profiles are computed in the same way using the
 $V$-velocity component. These profiles illustrate the behaviour of the SCF instability and are also typically referred to as the SCF profiles. The general behaviours of the
 $U$ and
 $V$-perturbation profiles are similar, but given the small amplitude of the
 $V$-component, it is much easier to accurately measure the
 $U$-component. Note that the bright spot near
 $x-x_s=10$ mm in figure 6(b) is due to noise in the data and is not a true measurement of the SCF profile. Focusing on figure 6(a), there is a clear peak upstream of the step, due to the incoming SCF instability. This peak decays somewhat in amplitude as it goes past the step, while a new peak begins to emerge near the wall starting approximately 20 mm downstream of the step. This lower peak increases in amplitude and appears to take over farther downstream, as the two peaks merge into one. The appearance of the lower peak occurs in the region of strong positive crossflow, indicating that it may be related to the occurrence of the crossflow reversal. Once again, this behaviour is similar to that seen downstream of the FFS (Eppink Reference Eppink2020b), in which double-peaked SCF modes were observed, presumably due to the highly inflectional profiles that occurred in the recirculation and crossflow-reversal flow regions.
Stationary perturbation profiles, bandpass filtered from 5 to 20 mm, upstream and downstream of the  $h/\delta = 0.49$ step, for the (a)
 $U$ and (b)
 $V$ velocity components.

The  $U$-perturbation profiles at several selected locations are compared in figure 7 for each of the step heights studied. At the location nearest the step (figure 7a), the shapes are all very similar, but the amplitude of the SCF mode for the largest step height is noticeably smaller than that of the smaller step heights. This is interesting, but perhaps not surprising, given that this peak is likely associated with the negative peak in the crossflow velocity profile, which was noticeably lower for the larger step height (see figure 5). The weaker negative crossflow component results in a smaller wall-normal velocity gradient of this velocity component, which is directly related to the growth of the SCF instability. By the next measurement station,
 $x-x_s=12$ mm (figure 7b), the profiles and amplitudes have collapsed to similar values, which is also in line with the crossflow profile measurements shown in figure 5. At this point, a lower peak, near
 $y=1$ mm, is starting to become visible. By the next station,
 $x-x_s=25$ mm, the double-peaked profiles have developed, with the upper peak amplitudes very similar among the step heights, but with increasing amplitude of the lower peak values as the step height increases. At the final station shown,
 $x-x_s=38$ mm (figure 7d), only a single peak is visible in the profile, and the amplitude again increases with increasing step height. These observations are also consistent with the observed increase in positive crossflow strength near the wall with increasing step height (figure 5).
Comparison of  $U$-perturbation profiles at (a)
 $x-x_s=2$ mm, (b)
 $x-x_s=12$ mm, (c)
 $x-x_s=25$ mm and (d)
 $x-x_s=38$ mm.

Figure 8 illustrates the growth of the peak amplitude of the SCF for each case, including the  $h/\delta =0.49,\ 40\,\mathrm {\mu }$m DRE case. The results are normalized differently in the two figures. In figure 8(a) the amplitudes are normalized by the SCF amplitude at the most upstream station (i.e. upstream of the step) for each of the two DRE configurations. Since the upstream measurements were only performed for the two
 $h/\delta =0.49$ step height cases, the results from the other two step heights are normalized by the value that was obtained from the
 $h/\delta =0.49,\ 20\,\mathrm {\mu }$m DRE case, as the initial amplitudes should be the same. In figure 8(b) the amplitudes are normalized by the edge velocity at each station. One thing to note from this figure is that doubling the DRE height results in twice the amplitude of the SCF upstream of the step. The former normalization (figure 8a) allows for a direct comparison of the SCF growth, even with different initial SCF amplitudes. All four curves initially collapse pretty well and the amplitudes decrease slightly until
 $x-x_s=23$ mm, which corresponds to the end of the reversed flow region. For the
 $h/\delta =0.49,\ 20\,\mathrm {\mu }$m DRE case, the amplitude grows continuously downstream of
 $x-x_s=23$ mm. The growth rate is initially large just downstream of reattachment, but eventually levels off somewhat. For the
 $h/\delta =0.49,\ 40\,\mathrm {\mu }$m DRE case, the initial growth rate downstream of
 $x-x_s=23$ mm is similar to its counterpart with
 $20\,\mathrm {\mu }$m DREs, but slightly larger. However, there is a clear nonlinear effect when comparing these two cases, as the amplitude for the 40
 $\mathrm {\mu }$m DRE case saturates near
 $x-x_s=60$, at an amplitude of approximately 6.5 %
 $U_e$, and decreases downstream. Some nonlinear behaviour is to be expected, since the initial SCF amplitude has doubled, and given that SCF vortices typically begin to display nonlinear behaviour at relatively low amplitudes. However, the relatively low saturation amplitude of approximately 6.5 %
 $U_e$ indicates that even with the larger SCF amplitude, SCF vortices are still not the dominant transition mechanism. The other two step heights show similar patterns to this case, with a peak in the SCF amplitude occurring near 60 mm downstream of the step, and with peak amplitudes increasing with increasing step height. The initial growth rate downstream of reattachment increases slightly as the step height is increased. This behaviour was also observed in figure 7. It is interesting that, for the largest step case (
 $h/\delta =0.57$), the amplitude initially saturates near
 $x-x_s=60$ mm, but then grows in amplitude at the farthest downstream station. The reason for this behaviour is unknown, and is only seen for this one case. The mean flow results for this case are not significantly different from that shown in figure 4 and does not provide any clue as to the reason for this behaviour.
Peak SCF amplitude vs  $x-x_s$;
 $U'_{rms}$ normalized by the (a) SCF amplitude upstream of the step, and (b) edge velocity.

4.3. Effect of step height on unsteady disturbance growth
While the effect of the BFS on the SCF instability is quite interesting and could warrant further investigation, it was shown in previous results (Eppink et al. Reference Eppink, Wlezien, King and Choudhari2018, Reference Eppink, Wlezien, King and Choudhari2019) that the unsteady instabilities that occur due to the presence of the step are the primary drivers of transition in these cases. The SCF instability was found to play a secondary role. To briefly summarize the previous findings, three different families of instabilities were identified downstream of the BFS, which were not present in the no-step case. These were identified as a travelling crossflow-like instability in the frequency range 80 to 200 Hz, a streamwise-travelling TS-like instability in the approximately 200 to 800 Hz range, and a streamwise-travelling shear-layer instability in the 800 to 1500 Hz range. When convenient throughout the paper, these will be referred to as the L, M and H-bands, respectively, for low, mid and high frequency. The SCF played a role in the transition process by causing a spanwise modulation of the instabilities. In addition, large fluctuations in velocity, referred to as ‘spikes’, were observed intermittently in the measurements downstream of reattachment and leading to transition. In the following sections we will attempt to further elucidate the features of the different unsteady instability modes, the effects of step height on those modes, discover the mechanisms through which they interact with the SCF instabilities, and attempt to further elucidate the velocity spike mechanism and the cause(s) of this mechanism.
In figure 9 spanwise-averaged velocity spectra of the three different velocity components are presented for each step height, at  $x-x_s=38$ mm. These spectra were taken at the wall-normal location of the maximum fluctuation amplitude, though this
 $y$-location can vary somewhat across the frequency range. The peak near
 $f=100$ Hz is very clear in the chordwise velocity (
 $u'_{\perp }$) for every step height (figure 9a). However, this peak is not clearly visible in the
 $v'$ or
 $w'_{\parallel }$ velocity component spectra (figures (b,c)), except for the largest step height. Thus, the fluctuations for this low-frequency mode occur primarily in the chordwise velocity (
 $u'_{\perp }$). The higher-frequency fluctuations, above
 $f=200$ Hz, seem to occur primarily in the spanwise and wall-normal velocities, although some energy content is visible in the
 $u'_{\perp }$ spectra as well. It is clear from these figures that the fluctuation amplitude, in every velocity component, increases significantly as the step height is increased. It also appears that the lower-frequency mode,
 $f=80$ to 200 Hz, increases more, relative to the higher-frequency instabilities. Another interesting observation is the impact of the SCF amplitude on the fluctuation amplitude. With the doubling of the SCF amplitude for the lowest step height case, the spanwise-averaged fluctuation amplitude increased significantly. In fact, the spectra for the
 $h/\delta =0.49,\ 40\,\mathrm {\mu }$m DRE case overlap fairly well with the spectra for the
 $h/\delta =0.51,\ 20\,\mathrm {\mu }$m DRE case. This is convenient, as it provides a unique opportunity to study the impact of the SCF vortices nearly independently of the unsteady instability amplitude, as will be explored in § 4.6.
Comparison of spanwise-averaged spectra at peak wall-normal location of fluctuations,  $x-x_s=38$ mm, for the (a)
 $u'_{\perp }$, (b)
 $v'$ and (c)
 $w'_{\parallel }$ velocity components.

The growth of some of the individual frequency bands are plotted in figure 10. These amplitudes were determined by averaging the spectra across the span, integrating the averaged power spectra over the frequency band of interest, and choosing the peak amplitude from the resulting disturbance profile. This procedure was followed for each plane of data, and the results are plotted vs streamwise distance downstream of the step. Based on observations made from the current work, the frequency bands for the two higher-frequency disturbances were adjusted slightly from what was used in previous work. Thus, the middle-frequency band ranges from 200 to 750 Hz, and the high-frequency band ranges from 750 to 1250 Hz. For the lower-frequency band (figure 10a), the  $u'_{\perp }$-velocity component is used, while the
 $w'_{\parallel }$-velocity component is used for the higher-frequency bands. This was done based on the observation that the lower-frequency disturbance primarily occurs in the chordwise velocity component, while the higher frequencies occur primarily in the spanwise velocity component. In general, this behaviour should be expected for the types of modes that have been identified. With
 $\partial v'/\partial y$ negligibly small, to satisfy continuity, the amplitudes of
 $u'$ and
 $w'$ are linked based on the relative values of the streamwise and spanwise wavenumbers (
 $\alpha u'=-\beta w'$). For a travelling crossflow instability, the spanwise wavenumber (
 $\beta$) will be substantially larger than the streamwise wavenumber (
 $\alpha$), which would require
 $u'>w'$. The opposite is true for the TS and KH (higher-frequency) instabilities, thus,
 $w'>u'$. The dependence of unsteady instability amplitude on the step height is clear from these figures. There is also a clear dependence on the SCF vortex amplitude, as the fluctuation amplitudes in the
 $h/\delta =0.49$, 40
 $\mathrm {\mu }$m DRE case are substantially (1.5 to 2 times) larger than for the 20
 $\mathrm {\mu }$m DRE case. As evident from the spectra in figure 9, the amplitudes for the
 $h/\delta =0.49$, 40
 $\mathrm {\mu }$m DRE and
 $h/\delta =0.51$ cases are of very similar amplitude for most locations and frequency bands. The largest discrepancy occurs in the highest frequency band (figure 10c).
Peak amplitude of the spanwise-averaged unsteady modes vs  $x-x_s$ for frequency ranges of (a) 80 to 200 Hz, (b) 200 to 750 Hz and (c) 750 to 1250 Hz.

4.4. Unsteady disturbance development
In this section the spatial features and downstream development of the unsteady disturbances will be examined in detail. With the limited spatial information available in previous studies (Eppink et al. Reference Eppink, Wlezien, King and Choudhari2018, Reference Eppink, Wlezien, King and Choudhari2019), we were able to identify many of the relevant features of each of the unsteady instabilities. However, time-resolved PIV provides even more detailed information from which we can gain further insight, particularly into the spanwise and 3-D behaviour of the instabilities as they interact with the SCF vortices. This section will primarily focus on the two smaller step heights,  $h/\delta =0.49$ and 0.51, with 20
 $\mathrm {\mu }$m DREs, but similar qualitative features were seen for all cases.
The SPOD analysis, as described in § 3.2, was performed for all cases to obtain modes for each selected frequency. Some SPOD energy spectra for the  $h/\delta =0.51$ step are shown in figure 11. In these figures,
 $\lambda$ corresponds to the eigenvalue of each SPOD mode. Figure 11(a) shows the first mode spectra for the first six streamwise locations downstream of the step. At the location closest to the step, the lower-frequency peak at approximately 100 Hz contains the most energy, and there is an additional secondary peak centred around 1 kHz. Moving downstream, the lower-frequency peak grows in amplitude, while the higher-frequency peak grows as well and broadens to lower frequencies. Figures 11(b) and 11(c) show the first five SPOD modes at two different streamwise locations,
 $x-x_s=12$ and 50 mm. At
 $x-x_s=12$ mm, most of the energy in the flow is captured by the first mode for each frequency. At
 $x-x_s=50$ mm, the second and third modes, and even the fourth mode for some frequencies, contain broad peaks and features and appear to contain a significant amount of energy. For the highest frequency band,
 $f\approx 750$ to 1250 Hz, the first SPOD mode contains almost all of the energy, whereas the higher modes are important for the two lower-frequency bands. Thus, for most of the discussion, we will focus primarily on the first SPOD mode, but, farther downstream, the discussion will include the second mode as well.
Spectral POD energy spectra for the  $h/\delta$ = 0.51 case: (a) first mode spectra at multiple streamwise locations, (b) first five modes at
 $x-x_s=12$ mm, (c) first five modes at
 $x-x_s=50$ mm. Light shaded areas in (b,c) represent 95 % confidence intervals, and are only included for the first three modes.

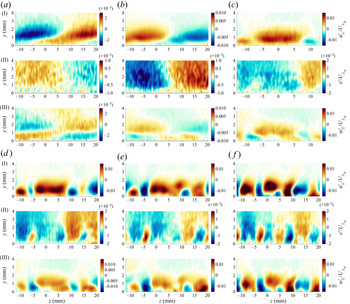
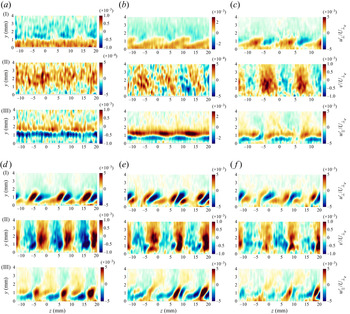
As mentioned earlier, the SPOD modes contain phase and amplitude information. Thus, they can be represented as time-resolved modes by cycling through the phase from 0 to 2 ${\rm \pi}$. Videos for each of the modes discussed in this section are included in the supplemental material. For purposes of representation in the paper, a snapshot in time (i.e. the amplitude distribution for a particular phase) is shown for each of the modes under investigation. The first mode snapshots for the lowest frequency band, at
 $f=117$ Hz, are shown in figure 12 for the first six streamwise locations. These figures contain results for all three velocity components. Similar to what was seen in previous measurements, the first mode at this frequency corresponds to a spanwise-travelling wave, with a fairly large wavelength of approximately 40 mm. The large structures are evident in all three velocity components. By 38 mm downstream of the step, some spanwise modulation of the instability is beginning to become apparent, and this modulation becomes more obvious farther downstream. Beginning at the fourth station shown,
 $x-x_s=50$ mm (figure 12d), three spanwise locations are evident at which the main structure of the large-wavelength travelling mode becomes interrupted by a localized disturbance of opposite sign near the wall. This modulation is especially clear in the
 $v'$-velocity component (figure 12(IId)), at
 $z\approx -6$, 5 and 15 mm. For this particular snapshot, the behaviour is most evident at
 $z\approx -6$ and 15 mm, but all three become evident at different times throughout the cycle (this is clear from the video). Inspection of the mean flow reveals that these locations correspond to regions of large positive spanwise gradients of the
 $V$-velocity (
 $\partial V/\partial z$), as well as large negative spanwise gradients of the
 $U$-velocity (
 $\partial U/\partial z$), caused by the SCF vortices. This provides evidence that the modulation of this low-frequency disturbance is due to a complex interaction between the travelling crossflow vortices and the SCF vortices, which cause the large spanwise velocity gradients in the mean flow. For example, before the instability becomes modulated, when the
 $v'$-velocity component of this disturbance is negative, the
 $w'$-velocity component very near the wall is negative as well (see figure 12(II–IIIb)). This is more evident for the
 $w'$ component than the
 $w'_{\parallel }$ component (for an illustration of this, see figure 26a). The negative
 $w'$ component, when passing by the region of large positive
 $\partial V/\partial z$, will pull the larger
 $V$ velocity to the left, resulting in the positive
 $v'$ peak seen at
 $z\approx -6$ mm. This interaction seems to share some similarities with the interaction described by Bonfigli et al. (Reference Bonfigli, Kloker and Wagner2003), between a stationary and travelling crossflow mode of similar wavelength and amplitude. In the present case, the travelling crossflow vortex wavelength is larger than the stationary wavelength, which lends itself to the formation of asynchronous events (e.g. occurring non-simultaneously across the SCF vortices). This will be discussed further in the following sections as it relates to the spike events. Another important difference between the present case and that described by Bonfigli et al. (Reference Bonfigli, Kloker and Wagner2003) is that the SCF amplitudes are significantly lower in the present case.
Spectral POD mode snapshots for the first  $f=117$ Hz mode,
 $h/\delta = 0.51$, at
 $x-x_s =$ (a) 12 mm, (b) 25 mm, (c) 38 mm, (d) 50 mm, (e) 63 mm, (f) 76 mm.

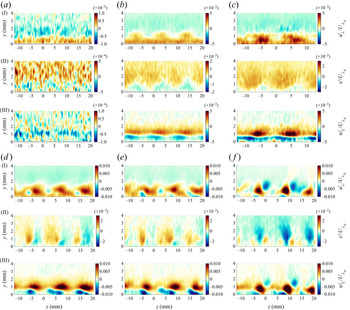
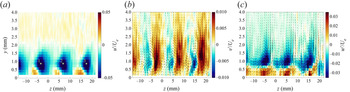
Next, the two higher-frequency bands, which correspond to (initially) primarily streamwise-travelling 2-D instabilities, will be examined. The first SPOD modes for a frequency of  $f=517$ Hz, corresponding to the M-band TS-instability, are shown in figure 13. The motion of this instability, evident from the videos, indicates that it is primarily travelling through the plane. At the location nearest the step,
 $x-x_s=12$ mm, the measurement is noisy due to the low-disturbance amplitude relative to the noise level, but even so, a nearly 2-D structure is evident. Moving downstream, it becomes evident that these structures are being impacted by the SCF vortices, as the spanwise modulation becomes stronger in all three velocity components. As the modulation develops downstream, the
 $v'$- and
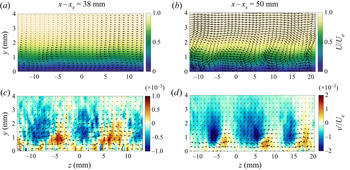
 $w_{\parallel }'$-components begin to develop in a manner that introduces localized regions of streamwise vorticity in the flow, corresponding to the SCF vortex spacing. To further illustrate this, results are shown in figure 14 for the planes at
 $x-x_s=38$ and 50 mm. In figures 14(a) and 14(b), the time-averaged
 $U$-velocity field is shown at both locations, along with velocity vectors corresponding to the SCF vortices. To acquire the vectors in these plots, first the wave angle of the SCF vortex is determined by finding the angle at which the crossflow component goes to 0 at the inflection point. This crossflow component,
 $W_{s}$, is then used, along with the
 $V'$ values, to obtain the vectors. The bottom two plots in this figure show snapshots from the
 $f=517$ first SPOD mode, along with the velocity vectors obtained from the
 $v'$ and
 $w'_s$ components of the mode. For consistency, the velocity components used to compute the SPOD mode are also rotated using the angle found above to compute
 $W_s$. At the first streamwise location,
 $x-x_s=38$ mm, two SCF vortices are evident, centred near
 $z=-5$ and 5 mm, and rotating in the counter-clockwise direction. Similarly, for the SPOD snapshot shown below (figure 14c), the modulation of the mode has introduced counter-clockwise rotation in locations corresponding very closely to the SCF vortices. Farther downstream, at
 $x-x_s=50$ mm, the flow is recovering from the step, and due to the adverse-to-favourable pressure gradient changeover, there are now two sets of SCF vortices. One set, located near
 $y=1.5$ mm, is rotating in the clockwise direction, while the set nearest the wall, corresponding to the same
 $z$-locations as before (
 $z\approx -5$, 5 and 15 mm), are still rotating in the counter-clockwise direction. For the SPOD snapshot at this location (figure 14d), there is again a localized region of rotation that aligns with this set of counter-clockwise rotating SCF vortices. The development and alignment of this vorticity with the SCF vortices is believed to play a crucial role in the ultimate breakdown of the flow to turbulence, as will be discussed in the following section.
Spectral POD mode snapshots for the first  $f=517$ Hz mode,
 $h/\delta = 0.51$, at
 $x-x_s =$ (a) 12 mm, (b) 25 mm, (c) 38 mm, (d) 50 mm, (e) 63 mm, (f) 76 mm.

(a,b) Time-averaged  $U$-velocity contours, with SCF vortex vectors (
 $W_{s},V'$) at (a)
 $x-x_s=38$ mm and (b)
 $x-x_s=50$ mm. (c,d) Snapshots of the first SPOD mode
 $v'$-component for
 $f=517$ Hz, with vectors of SPOD mode
 $v'$ and
 $w'_s$ components at (c)
 $x-x_s=38$ mm and (d)
 $x-x=50$ mm.

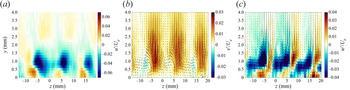
Similar SPOD results for the H-band are shown in figure 15. This mode resembles the 2-D behaviour of the M-band at the first two stations,  $x-x_s=12$ and 25 mm (figure 15a,b). This mode was initially identified as a KH instability. However, even near the step, the higher-frequency band disturbance exhibits more modulation than the M-band (this is also more evident in the videos). By
 $x-x_s=38$ mm, the differences between the two frequency bands are becoming more apparent. All three velocity components begin to exhibit some differences in the modulation patterns for the H-band instability. In particular, the modulation appears stronger in all three velocity components. The videos also reveal that the propagation of the higher-frequency instability now appears to be primarily in the spanwise direction, as opposed to out-of-plane. These results indicate that farther downstream of the step, the higher-frequency fluctuations correspond predominantly to a 3-D instability, rather than the 2-D KH instability that was initially identified near the step. Similar types of behaviour were observed in the hot-wire measurement campaign, but there was not enough information to delve further into this behaviour. Based on the current results, there are two different instabilities that exist in the H-band frequency range – a 2-D instability near the step, and a 3-D (oblique) instability farther downstream of the step (
 $x-x_s>50$ mm). The 3-D behaviour becomes even more apparent as the flow progresses downstream.
Spectral POD mode snapshots for the first  $f=963$ Hz mode,
 $h/\delta = 0.51$, at
 $x-x_s=$ (a) 12 mm, (b) 25 mm, (c) 38 mm, (d) 50 mm, (e) 63 mm, (f) 76 mm.

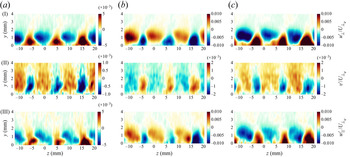
Recall from the SPOD spectra (figure 11c) that locations downstream of  $x-x_s=50$ mm exhibit some energy in the higher SPOD modes for the L-and M-bands, while the H-band contains almost all of the energy in the first mode. Snapshots from the second SPOD modes for the L- and M-band frequencies are shown in figures 16 and 17, respectively, for the three locations downstream of
 $x-x_s=50$ mm. The lower-frequency disturbance exhibits an interesting modulation of the flow, with wavelength corresponding to the primary SCF vortex wavelength. It is not yet clear what mechanism this fluctuation corresponds to. The contours do not appear to be moving in the plane, as would be expected of a travelling crossflow vortex. Rather, the contours simply alternate between regions of positive and negative
 $u'$-velocity, as can be seen in the supplemental videos for figure 16. It is possible that this fluctuation corresponds to a low-frequency flagging motion of the SCF vortices (Serpieri & Kotsonis Reference Serpieri and Kotsonis2016). It is interesting to note that this type of fluctuation pattern is not limited to this L-band frequency range, but, in fact, similar patterns are seen at even lower frequencies. It is evident from the SPOD spectra that the energy level of the second mode at 117 Hz is similar to that for the first mode at lower frequencies. This behaviour warrants further investigation, but is left for future research.
Spectral POD mode snapshots for the second  $f=117$ Hz mode,
 $h/\delta = 0.51$, at
 $x-x_s =$ (a) 50 mm, (b) 63 mm, (c) 76 mm.

Spectral POD mode snapshots for the second  $f=517$ Hz mode,
 $h/\delta = 0.51$, at
 $x-x_s =$ (a) 50 mm, (b) 63 mm, (c) 76 mm.

There is an interesting observation to be made from the second SPOD modes for the middle-frequency band, as well. Comparing figure 17 to 15(d–f), the modulation patterns appear very similar. In fact, the time-resolved behaviour of these second SPOD modes (evident from the videos) confirm a similar in-plane (spanwise) motion to that seen for the first SPOD modes of the higher-frequency band at these locations. These similarities indicate that the frequency band of the spanwise-travelling higher-frequency instability begins to spread to lower frequencies and overlap with the M-band at these downstream locations.
4.5. Three-dimensional reconstruction of the unsteady instabilities
We are interested in understanding the full 3-D picture of these instabilities, but this is difficult given that the current measurements are all planar. However, as described in § 3.2, with some limited knowledge of the streamwise phase speed of the instabilities, it is possible to do a qualitative reconstruction based on the SPOD modes. As mentioned earlier, the measurements were acquired with a streamwise spacing of 6.35 mm for the smallest step height ( $h/\delta =0.49,$ 20
 $\mathrm {\mu }$m DREs), which is enough to resolve the streamwise wavelengths of the instabilities up to approximately 300 Hz. Based on the hot-wire measurements, the streamwise wavelength of the 260 Hz mode is approximately 21 mm, which results in at least three points per wavelength for this mode. Since the L-band instability primarily travels in the spanwise direction (normal to the
 $x$-direction), resulting in a near-infinite streamwise wavelength, the resolution is more than sufficient to reconstruct this mode.
Figure 18 depicts the reconstruction of the first 117 Hz SPOD modes to yield a snapshot in time. The full video is included in the supplemental material. Figures 18(a) and 18(b) include isosurfaces of positive (red) and negative (blue)  $u'_{\perp }$ velocity, along with isosurfaces of positive
 $\partial V/\partial z$, shown in green. Initially, the large spanwise wavelength of this instability is visible near the step. By approximately 40 mm downstream of the step, the modulation due to the interaction with the SCF vortices is beginning to become apparent. As discussed earlier, this interaction results in regions of localized velocity fluctuation of opposite sign in the middle of the larger regions of negative or positive
 $u'$ or
 $v'$, when these regions pass by areas of large positive
 $\partial V/\partial z$ (or negative
 $\partial U/\partial z$). Since the wavefront of this instability is nearly oriented in the streamwise direction, these localized regions occur almost instantaneously at all streamwise locations, which results in an interesting instantaneous 3-D modulation of the mean flow.
Reconstructed SPOD data snapshot consisting of positive (red) and negative (blue) isosurfaces of the  $u_{\perp }$-velocity component,
 $u_{\perp }=\pm 0.05$ m s
 $^{-1}$, for the
 $h/\delta =0.49$, 20
 $\mathrm {\mu }$m DRE case. Results shown for (a) 117 Hz first SPOD mode, (b) 117 Hz first SPOD mode with green isosurfaces of positive
 $\partial V'/\partial z$ velocity gradient.

Similar results are shown in figure 19(a) for the 260 Hz mode. Given the limited streamwise resolution of these measurements, it was necessary to choose a frequency towards the lower end of the M-band. Green isosurfaces of positive  $V'$-velocity are also included in this figure to aid in the discussion of the interaction with the SCF vortices. Shortly downstream of the step (
 $x-x_s\approx 15$ mm), the blue and red isosurfaces appear to be fairly two dimensional, with the wavefront aligned with the step, but as they convect downstream, they become more and more inclined relative to the sweep angle. The regions of the red and blue isosurfaces that fall under the green band become increasingly steeper in inclination from
 $x-x_s=25$ to 90 mm. Thus, the modulation of this instability appears to be primarily a consequence of the well-known lift-up effect (Theodorsen Reference Theodorsen1955), where the positive
 $V'$-velocity component pushes the instability up into regions of higher momentum fluid, causing the disturbance in these localized regions to convect downstream faster. This 3-D visualization of the instability provides a simple explanation for how the interaction of the 2-D TS-instability can become modulated due to an interaction with the SCF vortices.
Reconstructed SPOD data snapshot consisting of positive (red) and negative (blue) isosurfaces of the  $u_{\perp }$-velocity component,
 $u_{\perp }=\pm 0.05$ m s
 $^{-1}$, along with green isosurfaces of positive stationary
 $V'$-disturbance velocity,
 $V'=0.01$ m s
 $^{-1}$, for the
 $h/\delta =0.49$, 20
 $\mathrm {\mu }$m DRE case. Results shown for (a) 260 Hz first SPOD mode, and (b) 260 Hz second SPOD mode.

Unfortunately, this same procedure cannot be used to reconstruct the H-band instability due to the limited spatial resolution and the smaller wavelengths that occur at higher frequencies. However, recall that the second SPOD mode for the M-band (figure 17) exhibited similar behaviours to the first SPOD modes at the higher frequencies (figure 15), downstream of approximately  $x-x_s=50$ mm. Thus, reconstructing this second mode may give some additional insight into the behaviour of the high-frequency instability. The result from this reconstruction is shown in figure 19(b). In this case, once the mode is strong enough (near
 $x-x_s=40$ mm), the instability appears as an oblique mode travelling downstream and outboard, at approximately 60
 $^{\circ }$ relative to the streamwise direction. This illustrates a markedly different behaviour from the first mode at this frequency and suggests that the second mode may be indicative of a travelling crossflow instability. Evidently, this instability does not appear to experience a modulation due to the lift-up effect induced by the SCF vortices, as was observed for the first SPOD mode. However, it does interact with the SCF vortices in the sense that there are regions of increased fluctuation amplitude (see, for instance, figure 17(b) and the accompanying video, where the fluctuation amplitude is larger in several regions:
 $z=-5$ to 0 mm, 5 to 10 mm and 15 to 20 mm). Even though this is not a reconstruction of the higher-frequency instability, it is likely a good representation, given the obvious similarities between the second SPOD mode for the M-band and the first SPOD mode for the H-band. In fact, for the phase-locked measurements that were performed at 1 kHz for the much larger step height (
 $h/\delta =0.73$), we see a very similar behaviour. For these data, phenomena were observed to occur at two different streamwise wavelengths in the phase-averaged results, so a wavenumber filter was applied to separate the very large streamwise wavelengths from the smaller streamwise wavelengths. The results after the filtering was applied are shown in figure 20(a,b), as well as the accompanying supplemental videos. When the smaller wavelengths are filtered out (figure 20a), we see a very similar oblique structure to what was observed in figure 19(b). The agreement is quite remarkable, especially considering the very different reconstruction techniques that were used to visualize the data, as well as the difference in frequency, step height and forcing conditions. The wave angle for this case was also estimated to be approximately 62
 $^{\circ }$, in very good agreement with the results from the 260 Hz second SPOD mode. However, when the larger streamwise wavelengths are filtered out, we see a very clear spanwise roller structure, indicative of a KH-type instability, which is indeed verified by looking at the
 $Q$-criterion, which is plotted in figure 20(c). This figure illustrates that vortices are shed from the step at the forcing frequency of 1 kHz, but they start to die out shortly downstream of
 $x-x_s=20$ mm, near where the oblique structures start to become apparent. Note that when the
 $Q$-criterion was plotted for the reconstructed 260 Hz first SPOD mode, there was no clear evidence of vortex shedding from the step, in agreement with the initial categorization of this mode as a TS-instability.
Phase-averaged results for the  $h/\delta = 0.73$ step with 1 kHz forcing. Isosurfaces of positive (red) and negative (blue)
 $u'$-velocity (a,b). Results are filtered based on streamwise wavelength: (a) larger wavelength (>10 mm) and (b) smaller wavelength (5.8 to 10 mm). (c) Plot of
 $Q$-criterion results computed from the smaller wavelength filtered flow field, isosurfaces of
 $Q=1$.

4.6. Interaction of unsteady and steady instabilities
In this section we explore the interaction of the unsteady instabilities that eventually leads to breakdown to turbulence. In previous measurement campaigns (Eppink et al. Reference Eppink, Wlezien, King and Choudhari2018, Reference Eppink, Wlezien, King and Choudhari2019), large amplitude velocity fluctuations were observed, which were not high-frequency events, but eventually led to high-frequency fluctuations, indicative of breakdown. These so-called ‘spikes’ occurred only in certain spatial regions, and resulted in skewed signals because they occurred mainly in a certain direction (either negative or positive  $u'$ depending on the spatial location). This mechanism is referred to as the spike mechanism because of how it appears in the raw velocity signals. One such highly skewed velocity signal is shown in figure 21 as an example. These large fluctuations in velocity grow in amplitude downstream, and reach very large values, sometimes 20 % to 30 % of
 $U_e$, before beginning to exhibit high-frequency fluctuations indicative of breakdown. Since this mechanism appears to be the primary path to breakdown in these BFS cases, it warrants further investigation. We will first examine the behaviour of these so-called spike events, and then explore the mechanisms that lead to the development of these large fluctuations.
Example of highly skewed velocity signal taken at  $x-x_s=50$ mm downstream of the
 $h/\delta =0.49$ BFS.

The spikes are identified using the method described in § 3.3, using the location of maximum negative skewness near  $z=-5$ mm (identified as location 1 in figure 22). Once the spike times have been identified, an average is taken of the snapshots at these times, for each of the velocity components. The results from this analysis are shown in figures 22 and 23 for the smallest and largest step heights, respectively. The streamwise location of these figures are slightly different, since spikes began to occur closer to the step for the larger step height. The
 $v'$ and
 $w'$ figures also include vectors computed using the two in-plane velocity components. These are shown to illustrate the regions of counter-clockwise rotation that are accentuated by the spike events. There is an obvious pattern, as seen in previous work (Eppink et al. Reference Eppink, Wlezien, King and Choudhari2018), that the large velocity fluctuations occur with a spanwise spacing corresponding to the SCF mode wavelength (
 ${\approx }11$ mm).
Time average of the spike-event snapshots,  $h/\delta = 0.49$,
 $x-x_s=44$ mm, for the (a)
 $u'$, (b)
 $v'$ and (c)
 $w'$ velocity components, along with vectors of
 $w'$ and
 $v'$.

Time average of the ‘spike’-event snapshots,  $h/\delta = 0.57$,
 $x-x_s=38$ mm, for the (a)
 $u'$, (b)
 $v'$ and (c)
 $w'$ velocity components, along with vectors of
 $w'$ and
 $v'$.

Figure 24 illustrates another interesting aspect of these spike events, which is their relationship to the SCF vortices. In the top figures (a,b), the SCF vortex vectors are shown on top of the modulated mean flow. For both cases shown, there are counter-clockwise rotating vortices noticeable near the wall at  $z\approx -5$, 5 and 15 mm, similar to the results shown in figure 14 for the
 $h/\delta =0.57$ case. The regions of counter-clockwise rotation that are evident in the fluctuating components of the spike event (figures 22 and 23) align closely with the SCF vortices. This is also shown more clearly by examining the two bottom figures (figure 24c,d), in which colour contours show the skewness computed from the time series of the
 $v'$-velocity component at each location, while the line contours show the
 $V'$-velocity, i.e. the steady disturbance velocity computed by subtracting the spanwise-averaged
 $V$-profile from the time-averaged
 $V$-profile at each spanwise location. The skewness (colour) contours correspond very closely to the average spike
 $v'$ contours shown in figures 22(b) and 23(b). It is clear from these figures that the large velocity fluctuations corresponding to the spike events align very well with the steady
 $V'$ velocity disturbances. This relationship between the occurrence of the spike events and the SCF vortices will be explored in the following discussions.
(a,b) Contours of time-averaged  $U/U_e$ velocity, with SCF vectors (
 $W_s,V'$). (c,d) Skewness of
 $v'$-velocity (colours) along with
 $V'$-disturbance velocity (lines). Positive
 $V'$ contours are in red, while negative contours are in blue. Results shown for (a,c)
 $h/\delta =0.49,\ x-x_s=44$ mm and (b,d)
 $h/\delta =0.57,\ x-x_s=38$ mm.

For the larger step height, more of the large positive or negative velocity fluctuations were observed to occur asynchronously, rather than simultaneously across multiple wavelengths. This is likely one of the reasons for the differences that can be observed between figures 22 and 23, particularly the difference in the spanwise uniformity of the amplitude peaks. The spike times used for these averages were determined from the data at a single point (1). For further analysis of this mechanism, spike times were determined from each location of maximum negative skewness in  $u'$. These locations are denoted 1, 2 and 3 in figure 22(a). The spike times were identified for each of the three locations as described previously. Then, we identified spikes that occurred simultaneously or nearly simultaneously (within 2 time steps, or 0.0004 s) for any combination of the three locations that included location 1. This analysis was performed for each case, and the number of spikes that fit into each category were counted and normalized by the total number of spikes identified for each case. This analysis was performed at the farthest upstream location at which the spikes became apparent, which was
 $x-x_s=38$ mm for all cases except
 $h/\delta =0.49$, 20
 $\mathrm {\mu }$m DREs, which was at
 $x-x_s=44$ mm. The results are shown in figure 25. There are clear differences depending on, not only the step height, but also the initial SCF amplitude. For the smallest step height and smaller initial SCF amplitude, most of the spikes occur simultaneously at all three locations. However, when the initial SCF amplitude is doubled, the spikes become more asynchronous. The results also change dramatically with step height. For the two largest step heights, more spikes occur asynchronously, either only at location 1, or at 1 and 2, with very few occurring at all three locations simultaneously. Note that this analysis technique is not ideal, as it depends on the selection of a threshold, and, thus, the results may vary depending on the chosen threshold. Despite this shortcoming, it helps to clearly identify the differences in these events as the step height or SCF amplitude changes.
Fraction of each type of spike occurring for each case. The numbers in the legend refer to the locations in which the spikes occur simultaneously, as identified in figure 23(a).

To further study these differences, we turn to the conditional POD analysis. For brevity, the following analysis focuses solely on the larger step height ( $h/\delta =0.57$) at
 $x-x_s=38$ mm. We chose to focus on this specific location for this analysis because it is the most upstream location at which the spikes were first observed. The conditional POD analysis was performed for three out of the four spike behaviours identified in figure 25, corresponding to the (1), (1,2) and (1,2,3) cases. For this analysis, signal lengths of 31 time steps were used, with the identified spike event occurring right in the middle, at the 16th time step. Two different snapshots from the first modes identified from this analysis are shown, corresponding to time step 1 (figure 26) and time step 16 (figure 27). The entire step time series for each case is included as a supplemental video. In addition, a video of the first mode for the (1,3) case is included as well, though it is not included in the discussion for brevity, as it is similar to the (1) and (1,2) cases. The relative values of the eigenvalues for the POD modes can give an idea of how much of the energy is contained in the first mode. For these cases, the ratio of the first eigenvalue to the second is 3.3, 3.1, 2.1 and 2.8 for the (1), (1,2), (1,2,3) and (1,3) cases, respectively. Thus, the first mode contains two to three times more energy than any of the higher modes. In terms of total kinetic energy, the first modes in these cases make up 17 %, 17.2 %, 19.7 % and 37 %, respectively, of the total kinetic energy. These values indicate that the first modes represent a significant portion of the total fluctuations occurring during these events, and, thus, provide a good representation of the underlying dynamics of the event.
Beginning snapshot of the first conditional POD mode,  $h/\delta = 0.57$,
 $x-x_s=38$ mm. Simultaneous spike locations from figure 22: (a) (1), (b) (1,2) and (c) (1,2,3).

Middle (spike) snapshot of the first CSTPOD mode,  $h/\delta = 0.57$,
 $x-x_s=38$ mm. Simultaneous spike locations from figure 22: (a) (1), (b) (1,2) and (c) (1,2,3).

In figures 26(a) and 26(b) the structures that are apparent 15 time steps ahead of the actual spike event resemble those of the low-frequency, spanwise-travelling wave, as illustrated in figure 12. Note that the  $w'$-velocity components look slightly different, and the reason is that we are now plotting the
 $w'$ component instead of the
 $w'_{\parallel }$ component. The reason for this is to better illustrate the streamwise vorticity that results from these disturbances. The main difference between figures 26(a) and 26(b) is that the phase of the low-frequency (long spanwise wavelength) instability is different, which helps to explain why the spikes occur in only specific locations. Moving to the actual time of the spike for those two cases, shown in figures 27(a) and 27(b), the low-frequency instability structure is still noticeable, particularly in the
 $u'$-velocity component. Again, this instability is at different phases when compared between the two cases. In these figures, particularly in the
 $v'$- and
 $w'$-velocity components, some aspects of the higher-frequency 2-D instabilities are noticeable, particularly the H-band. Note that for the cases where the spikes were identified only at location 1 (figure 27a), there is still a localized increase in the
 $u'$- and
 $v'$-velocity components near location 2, but the peak amplitudes are lower than at location 1, and apparently not large enough to reach the ‘spike’ threshold. In contrast to the first two cases, the third case (1,2,3) appears to be more reliant on the higher-frequency 2-D instabilities than the lower-frequency travelling mode. This is evident from the very beginning of the first CSTPOD mode (figure 26c), where the larger spanwise wavelength structures indicative of the lower-frequency instability are no longer evident. Rather, the modulated 2-D structures indicative of the higher-frequency modes are more apparent (for instance, compare with figure 13(IId)). These results reveal that the different types of instabilities all play a role in the occurrence of these large velocity fluctuations, and that asynchronous spikes occur when the lower-frequency spanwise-travelling mode is prevalent. The spikes are found to occur when the instabilities reach the phases in their cycles in which they add constructively to each other, which in turn creates the large velocity fluctuations at certain locations. This is evident from the videos of the CSTPOD first modes, which show occurrence of the different types of instabilities and their overlap. This will also be shown more clearly in the following discussion, but the question still remains, why do the spikes only occur in a certain direction (i.e. positive or negative) depending on the location and the velocity component. Presumably, this type of constructive interaction should result in both positive and negative spikes (i.e. an unskewed signal), at the locations of largest fluctuation amplitude, but this is clearly not the case. This question will also be explored in the following discussion.
First, to illustrate the prevalence of the different types of instabilities, we performed the same CSTPOD analysis as in the previous section, but on the bandpass-filtered datasets for each of the three frequency bands. Videos of the first mode for each of these are included in the supplemental material. To simply show the prevalence of each instability type, the velocity at the location of peak fluctuation amplitude was extracted for each time step in the CSTPOD mode. These values were multiplied by the average eigenvalue of the first mode for each set of spikes, in order to give an actual estimate of relative velocity amplitudes. These results are shown for two cases: the (1) case with asynchronous spikes only at location 1, and the (1,2,3) case where spikes occurred simultaneously at all three locations. In the first case (figure 28a), the amplitudes of all three frequency bands reach fairly similar magnitudes by the time the spike occurs ( $t-t_s=0$), though the H-band is slightly lower in amplitude compared with the other two. In contrast to this case, in figure 28(b), it is clear that the L-band plays almost no role, as suspected based on the previous discussion, and the higher-frequency modes are almost equivalent in amplitude. It is interesting to note from these figures, as well as the accompanying videos, that the higher-frequency instabilities can be seen to gradually increase in amplitude leading up to the actual ‘spike’ event. Thus, it is possible that these events occur mainly in the middle of the passage of a wave-packet, where the instabilities happen to align and reach large enough amplitudes to cause this event to occur. This, in addition to the broadband nature of the disturbances, would help to explain the seemingly sporadic nature of these events. These results also help to explain the apparent change in behaviour as the step height is increased, as illustrated in figure 25. The asynchronous spikes would be expected to become more prevalent as the lower-frequency band disturbance becomes more prevalent, which indeed, is the case when the step height is increased.
Plot of  $u'$-velocity traces from first CSTPOD mode at location of peak fluctuation amplitude,
 $h/\delta = 0.57$,
 $x-x_s=38$ mm. Simultaneous spike locations from figure 22: (a) (1) and (b) (1,2,3).

This leads us to the question of why do the ‘spikes’ have a preferred positive or negative direction, depending on  $y$ and
 $z$ location? It is interesting to note that, upstream of this
 $x-x_s=38$ mm location for the
 $h/\delta =0.57$ step height, at the next nearest measurement location,
 $x-x_s=25$ mm, no ‘spikes’ were evident. Both positive and negative peaks in velocity were observed nearly equally, and even similar phenomena of the constructive interaction of the different instability types were observed for both positive and negative peaks at the same location(s). The beginning and middle snapshots from the first CSTPOD mode for these two cases are shown in figure 29. The positive and negative peak cases are nearly identical, just 180
 $^{\circ }$ out of phase. The first snapshot indicates the prevalence of the lower-frequency spanwise-travelling mode, due to the prominence of the large spanwise wavelength structures. Similar to the results shown for the plane at
 $x-x_s=38$ mm (figure 26a,b), the low-frequency instability structures in figures 29(a) and 29(b) are similar, but the phase is different. Thus, the main determining factor on whether the velocity peak at the prescribed location will be negative or positive is the initial phase of the low-frequency instability. The structures that occur during the peak (figure 29c,d) are similar to those seen farther downstream (figure 27c), in that the 2-D instabilities have become apparent, but the biggest difference is that the structures farther upstream are not nearly as modulated in span. Videos of the first CSTPOD mode for these two cases are also included in the supplemental material. In these videos, one can clearly observe the initial presence of the low-frequency spanwise-travelling mode, followed by the superposition of the higher-frequency 2-D modes, until they constructively add together, leading to the peak in either positive or negative velocity. However, the spike mechanism, observed farther downstream, is not observed here.
Beginning (a,b) and middle (c,d) snapshots of the first conditional POD mode,  $h/\delta$ = 0.57,
 $x-x_s=25$ mm: (a,c) positive and (b,d) negative peaks in
 $u'$ near
 $z=2$,
 $y=1.5$ mm.

One way that the relative importance of the SCF amplitude vs the unsteady instability amplitude can be studied is by looking at the two cases mentioned earlier: the  $h/\delta =0.49$ step with 40
 $\mathrm {\mu }$m DREs, and the
 $h/\delta =0.51$ step with 20
 $\mathrm {\mu }$m DREs. Since these two cases have very similar levels of unsteady instabilities (figure 9), and different SCF amplitudes (figure 8b), a comparison of these cases will help to determine whether the SCF amplitude plays a significant role in the occurrence of this ‘spike’ mechanism. It is also helpful that there is only a small difference in step height between these two cases, as the differences in mean flow (apart from those caused by the SCF) are quite small. The most noticeable difference can be seen in figure 5, in which the region of crossflow reversal (positive crossflow near the wall) is larger and stronger for the larger step height. It turns out that, in contrast to the
 $h/\delta =0.49$ case with 20
 $\mathrm {\mu }$m DREs, both of these cases exhibit large amplitude one-sided ‘spikes’ in velocity beginning with the measurement plane at
 $x-x_s=38$ mm. The number of spikes that occurred at this location for each of these two cases was determined using the procedure described earlier. For the lower step height with larger SCF amplitude, 262 spikes were identified out of the 10 000 time steps, compared with 180 for the
 $h/\delta =0.51$ step. Thus, there were approximately 50 % more spikes identified for the case with larger SCF amplitude. Additionally, the average spike amplitude was 1.25 m s
 $^{-1}$ for the larger amplitude SCF case, and 1 m s
 $^{-1}$ for the
 $h/\delta =0.51$ case. This result shows that the SCF vortice are indeed an important factor in the appearance of this ‘spike’ mechanism.
Summarizing the most important observations thus far: the unsteady instabilities that are introduced by the step become modulated as they progress downstream of the step, due to the interaction with the SCF vortices. Each of the three families of instabilities are modulated in different ways, but they all exhibit some amount of modulation that corresponds to the spanwise wavelength of the SCF mode. Because of this modulation, there are certain points during the phase of each of these instabilities when they can align in a constructive way with each other to enhance the amplitude of the fluctuation, and, when the modulation is large enough, to create streamwise vorticity. By itself, this constructive superposition of modes should result in positive and negative peaks occurring equally. However, because of the existence of the crossflow velocity component within the boundary layer, there is a particular direction of streamwise vorticity that is favoured. In addition, the modulation occurs in such a manner that the regions of streamwise vorticity align with the already existent SCF vortices. This is made most evident by observing the alignment of the  $v'$-velocity component (or the skewness of
 $v'$) during a spike event with the
 $V'$-steady disturbance velocity. Thus, it is believed that the superposition of unsteady instability modes, in a certain arrangement, leads to a situation where there is a brief, but very strong, interaction with the SCF modes, leading to the large velocity spikes that are observed. It is not clear from the present data (since we are limited to 2-D slices of the flow field) whether the extra vorticity that is created results only in streamwise-local events, or if streamwise vortices are shed as a result of the interaction. In either case, the velocity fluctuations reach such large amplitudes farther downstream that they eventually lead to high-frequency secondary instabilities, as was observed in the hot-wire measurements, and ultimately breakdown of the flow, and it is clear that this is the primary mechanism leading to transition. An interesting feature of these events is that, since they are basically enhancing the strength of the existing SCF vortices, they lead to larger modulation of the flow, increasing the local spanwise and wall-normal velocity gradients for a short period of time, which leads to the appearance of the high-frequency secondary instabilities.
Some similarities to these observations can be found in the previous computational studies that have considered SCF interactions with unsteady instabilities. As mentioned previously, Bonfigli et al. (Reference Bonfigli, Kloker and Wagner2003) described the formation of IVS that resulted from the mutual induction of the SCF and travelling crossflow vortices of similar wavelength. They associated these IVS with the generation of spikes in the velocity signal. A similar mechanism may be occurring in the present work, though there are some significant differences: the travelling crossflow instability is clearly not the only unsteady instability that is present and interacting with the SCF vortices, and the travelling and SCF instabilities possess significantly different wavelengths. These different wavelengths lead to the asynchronous appearance of the velocity spikes across the SCF wavelengths, particularly when the travelling crossflow instability is more dominant than the other unsteady instabilities. This behaviour is similar to the asynchronous secondary instability behaviour caused by the de-tuned modes in a TS-SCF interaction (Wassermann & Kloker Reference Wassermann and Kloker2005).
As an attempt to quantify the location and level to which breakdown was occurring for each case, the intermittency was computed as described in § 4.3. The results are shown in figure 30 for each case. As expected, the intermittency begins to increase earlier as the step height is increased. For the smallest step height ( $h/\delta =0.49$), the intermittency is nearly zero even at the farthest downstream measurement location. The next largest step height (
 $h/\delta =0.51$) begins to increase above zero intermittency starting near 60 mm downstream of the step. For the
 $h/\delta =0.49$, 40
 $\mathrm {\mu }$m case, the intermittency grows even sooner, slightly reaching above zero starting at
 $x-x_s=50$ mm. While the intermittency remains lower for this case compared with the largest step height, the two reach comparable values near 50 % to 55 % by the farthest downstream measurement location.
Intermittency vs  $x-x_s$ for each case.

Once again, a comparison of the two cases with similar unsteady instability amplitude ( $h/\delta =0.49$, 40
 $\mathrm {\mu }$m DREs, and
 $h/\delta =0.51$) is useful in determining the relative importance of the unsteady instabilities vs the SCF. It is clear, yet again, that the SCF vortices do play a role in speeding up the transition process, due to the increased intermittency of the former case compared with the latter. This role could be through the enhancement of the spike mechanism, as discussed previously. An additional consideration is that the enhanced modulation of the mean flow could result in the earlier appearance of the secondary instabilities, since the spike mechanism would not need to reach as large of an amplitude to achieve the same localized velocity gradients.
5. Conclusions
The measurements and analysis presented in this paper reveal, in great detail, the complex interactions that occur downstream of a BFS in a swept-wing boundary layer to lead, ultimately, to transition. Multiple types of instabilities are accentuated by the step, and they are all affected in different ways by the SCF vortices. The low-frequency spanwise-travelling instability, which corresponds to a travelling crossflow mode, but with a rather large wavelength relative to the SCF wavelength, is modulated when it encounters regions of large spanwise gradients (positive spanwise gradients of the vertical velocity component,  $V$, and negative spanwise gradients of
 $U$ and
 $W$). The spanwise velocity component of the disturbance apparently causes a redistribution of the
 $V$- and
 $U$-velocity components. The higher-frequency instabilities, on the other hand, behave differently. The 2-D instability in the middle-frequency band, which is attributed to a TS-instability, experiences the well-known ‘lift-up’ effect when it encounters regions of positive
 $V$ velocity caused by the SCF vortices. This causes those regions of the wave front to be lifted up and pushed downstream relative to the rest of the wave front, due to the higher momentum fluid farther from the surface. The highest frequency instability initially takes on the form of a KH shear-layer instability immediately downstream of the step. However, a different instability emerges in this frequency range, which manifests as an oblique mode travelling at approximately 60
 $^{\circ }$ relative to the streamwise direction. The spanwise wavelength of this instability coincides with the primary SCF vortex wavelength, and it appears to be a travelling crossflow instability with the same wavelength. Interestingly, this oblique mode also appears to exist in the middle-frequency band, but at lower amplitudes than the 2-D TS-instability. It is beneficial to note that in this case, the SPOD method was very successful at separating out the two different modes that were present in the flow at the same frequency. Additionally, a new technique for building up a 3-D flow field from 2-D data was illustrated, and this approach was shown to be extremely beneficial for interpreting the complicated interactions that occur in this flow field. Using this technique, the 3-D flow field (at a particular frequency) can be reconstructed using only the SPOD modes of interest from each 2-D plane and a measurement of the out-of-plane phase speed of the instability at this frequency.
The spanwise modulations of the different instabilities eventually contribute to the occurrence of large amplitude velocity fluctuations. The mechanism leading to these large fluctuations has been shown to be a complex interaction between the unsteady instabilities introduced by the step and the SCF instabilities. Each of the three families of instabilities are modulated in different ways, but they all exhibit modulation that corresponds to the spanwise wavelength of the SCF mode. There are certain points during the phase of each of these instabilities when they can align in a constructive way with each other to enhance the amplitude of the fluctuation and to create streamwise vorticity. The large velocity fluctuations are shown to occur primarily during these times when two or three of the unsteady instabilities coalesce in time to constructively add together. The modulation also occurs in such a manner that the regions of streamwise vorticity align with the already existent SCF vortices. Thus, the superposition of unsteady instability modes, in a certain arrangement, leads to a situation where there is a brief, but very strong, interaction with the SCF modes, leading to the large velocity spikes that are observed. The velocity fluctuations reach such large amplitudes farther downstream that they create very large instantaneous regions of spanwise and wall-normal shear, leading ultimately to the appearance of high-frequency secondary instabilities, and ultimately breakdown of the flow. These results illustrate a transition mechanism in which a set of low amplitude instabilities can interact with the SCF vortices, also of relatively low amplitude ( ${<}5\,\%U_e$), to create very large velocity fluctuations, which eventually lead to breakdown of the flow. These results provide more insight into the transition process behind a swept BFS, but more widely are of fundamental interest to other flow fields in which complex instability interactions occur.
Supplementary movies
Supplementary movies are available at https://doi.org/10.1017/jfm.2021.925.
Declaration of interests
The authors report no conflict of interest.