1. Introduction
Jet impingement is widely employed in engineering applications requiring strong near-wall transport, most notably impingement cooling (Plant, Friedman & Saghir Reference Plant, Friedman and Saghir2023). Building on concepts developed for single-impinging jet (SIJ), the introduction of multiple jets can increase total thrust and enhance platform stability. Rectangular nozzles, in particular, provide design flexibility through variable aspect ratios and enable thrust-vectoring control (Huang et al. Reference Huang, Xu, Yu, Wang, Pan, Chen and Zhang2023), while also simplifying structural integration (Jeun et al. Reference Jeun, Karnam, Jun Wu, Lele, Baier and Gutmark2022). These advantages have attracted growing attention in recent years (Chakrabarti, Gaitonde & Unnikrishnan Reference Chakrabarti, Gaitonde and Unnikrishnan2021; Chen et al. Reference Chen, Qiang, Wu, Yang and Li2024; Samimy et al. Reference Samimy, Katterle, Leahy, Webb, Yarlagadda and Hiler2024). At high speeds, however, dual-impinging jets (DIJs) exhibit highly complex jet–jet–plate interactions arising from the combined effects of nozzle-exit-flow characteristics, inter-jet interference and the presence of the impingement surface. These coupled mechanisms generate intense unsteadiness and impose severe acoustic and structural loads on the impingement plate, potentially leading to hearing impairment, reduced component lifespan and vibration-induced damage in precision equipment. Consequently, establishing a clear link between the impingement-surface-pressure field and the far-field acoustic response, and assessing how dual rectangular nozzles modify the unsteady flow dynamics, are critical steps toward predicting and mitigating DIJ-induced acoustic loads in high-speed, ground-proximity applications.
Introducing a downstream wall blockage in a SIJ establishes an acoustic feedback loop between the nozzle and the impingement plate. Under resonance-prone conditions, the resulting far-field acoustic fluctuations can exceed those of free jets by more than an order of magnitude, with increases of the order of 10 dB reported for certain supersonic configurations (Akamine et al. Reference Akamine, Nakanishi, Okamoto, Teramoto, Okunuki and Tsutsumi2015). Classical interpretations attribute this resonance to four coupled processes: (i) downstream convection of Kelvin–Helmholtz (K–H) wavepackets in the initial shear layer, (ii) their interaction with the plate and wall-jet region, (iii) generation of upstream-travelling pressure waves and far-field sound and (iv) receptivity at the nozzle lip. The resulting tonal frequencies are commonly interpreted using Powell’s formulation for round impinging jets (Powell Reference Powell1988)
 \begin{equation} \frac{n+p}{f_{n}}={\int }_{{\kern-1pt}0}^{{\kern-1pt}h}\frac{{\rm d}h}{U_{c}}+\frac{h}{c_{a}} ,\end{equation}
where the discrete tonal frequency f n is closely related to both the downstream process h/U c and the upstream process h/c a , accompanied by a phase-lag term p. Here, h represents the length of the feedback loop, U c is the convection velocity of the downstream shear layer and c a is the ambient sound speed. The physical origin of the phase-lag term has been linked to the shock-related dynamics in the wall-jet region of underexpanded impinging flows (Weightman et al. Reference Weightman, Amili, Honnery, Soria and Edgington-Mitchell2017b ). Over the past decade, progress based largely on axisymmetric round-nozzle configurations has refined this picture through synchronised acoustic and flow diagnostics and high-fidelity simulations (Bogey & Gojon Reference Bogey and Gojon2017, Karami et al. Reference Karami, Edgington-Mitchell, Theofilis and Soria2020a , Liu et al. Reference Liu, Li, Liu, Hao, Zhang and He2021). From an energetic perspective, the downstream process is generally understood as a K–H convective instability extracting energy from the mean flow to sustain and amplify these coherent structures (Tam & Ahuja Reference Tam and Ahuja1990). As for the upstream process, recent studies have clarified that the waves closing the resonance loop may propagate either within the jet as guided jet waves (Nogueira et al. Reference Nogueira, Cavalieri, Martini, Towne, Jordan and Edgington-Mitchell2024) or outside the jet as free-stream acoustic waves. The generation of these upstream-propagating waves can involve several routes. These routes include direct jet and plate interaction and shock-related processes such as shock leakage and shocklets within the wall jet, as well as fluctuations along the wall-jet boundary (Edgington-Mitchell et al. Reference Edgington-Mitchell, Weightman, Mazharmanesh and Nogueira2025). Direct experimental evidence for shock leakage as a tone-related mechanism in shock-containing jets also supports the importance of shock-mediated wave generation in resonance pathways (Edgington-Mitchell et al. Reference Edgington-Mitchell, Weightman, Lock, Kirby, Nair, Soria and Honnery2020). These insights suggest that the upstream leg, together with the receptivity at the nozzle lip, can vary with operating condition and geometry rather than acting as a universal kinematic closure. Progress has also been made in characterising receptivity more quantitatively. Karami et al. (Reference Karami, Stegeman, Ooi, Theofilis and Soria2020b ) established a transfer function-based definition of nozzle lip receptivity for under-expanded supersonic round impinging jets and demonstrated its sensitivity to forcing location, frequency and azimuthal content. Complementary analytical work on a two-dimensional supersonic jet has provided a frequency-dependent description of how upstream acoustic forcing can excite new instability waves near the lip, which offers a useful idealised reference (Li, Zhang & Lyu Reference Li, Zhang and Lyu2025). On the plate side, circular nozzle studies tend to link tonal states to distinct, frequency locked pressure footprints. Fast-response pressure-sensitive paint (PSP) measurements for a Mach 1.5 round impinging jet showed that the dominant surface pattern can change with impinging distance, with axisymmetric and helical type responses appearing at different spacings and tones (Davis et al. Reference Davis, Edstrand, Alvi, Cattafesta, Yorita and Asai2015). Related investigations further indicate that nozzle lip geometry can bias azimuthal mode selection in supersonic impinging flows (Weightman et al. Reference Weightman, Amili, Honnery, Edgington-Mitchell and Soria2017a ). More recently, synchronised flow and acoustic analyses of subsonic to slightly underexpanded round impinging jets have used spectral proper orthogonal decomposition (SPOD) to extract coherent structures at tonal frequencies and to clarify the role of guided jet modes in shaping tone strength and frequency ranges (Li et al. Reference Li, Wu, Liu, Zhang, Hao and He2023). In this context, a plate-resolved and frequency-specific description of how the impingement process connects to the far-field tonal response is still developing, which leaves room for further improvement beyond the established axisymmetric picture.
When a second jet is introduced to form a dual-impinging configuration, the feedback environment of each jet is no longer isolated (Stahl, Prasad & Gaitonde Reference Stahl, Prasad and Gaitonde2021). Experimental studies of twin impinging jets have shown that the interaction of the two wall jets produces a fountain or upwash flow that can become a dominant source of unsteady loading on the surface (Choutapalli et al. Reference Choutapalli, Krothapalli, Alkislar and Lourenco2007; Saddington, Knowles & Cabrita Reference Saddington, Knowles and Cabrita2009). The flow and acoustic response of twin impinging jets is strongly dependent on inter-nozzle spacing and impingement geometry, with particularly pronounced changes observed at close spacings. Systematic variations of relative jet momentum have further demonstrated that changes in fountain-flow strength and asymmetry can noticeably reorganise surface pressure and near-field acoustic signatures in dual impingement (Bhargav et al. Reference Bhargav, Mehta, Kumar and S. Alvi2022). These experimentally guided observations provide a basis for interpreting DIJ tones within a coupled-feedback viewpoint. Theoretical modelling has formalised this idea by extending the classical SIJ framework to include an additional acoustically coupled global loop for DIJ resonance (Stahl et al. Reference Stahl, Gaitonde, Bhargav and Alvi2022). A further layer of complexity arises when the nozzle geometry departs from axisymmetry. For rectangular impinging jets, classic experiments documented that large-aspect-ratio supersonic configurations exhibit impingement-tone behaviour that differs from round-nozzle cases (Norum Reference Norum1991; Tam & Norum Reference Tam and Norum1992). High-fidelity studies of supersonic planar impinging jets have further helped clarify the basic resonance ingredients in a non-axisymmetric setting (Gojon, Bogey & Marsden Reference Gojon, Bogey and Marsden2016). More broadly, previous experiments have shown that the acoustic response of impinging jets can depend markedly on nozzle geometry and exit-flow modification. Related free-jet studies have shown that passive exit-flow modification can reorganise shock-cell structure and suppress screech-related radiation in supersonic jets (Balakrishnan & Srinivasan Reference Balakrishnan and Srinivasan2018). Balakrishnan & Srinivasan (Reference Balakrishnan and Srinivasan2019) compared circular and non-circular impinging jets and showed that nozzle shape can substantially modify the far-field spectra, overall levels and directivity, with impingement tones weakened or even eliminated for some configurations. Sensitivity to the impingement configuration has also been reported for changes in the plate arrangement. For example, plate inclination can alter the radiated noise of impinging jets (Dhamanekar & Srinivasan Reference Dhamanekar and Srinivasan2017). These observations indicate that geometric modifications can influence not only jet development but also the resonance and radiation characteristics of impinging-jet systems. Compared with these single-jet, planar and broader geometry-focused impinging-jet studies, direct investigations of high-speed rectangular DIJs remain limited, especially for plate-resolved modal analysis and near- to far-field tonal correlation. In this context, recent progress on rectangular free jets provides useful background for interpreting possible nozzle-shape-dependent unsteadiness in rectangular DIJs. Rectangular free jets are characterised by sharp-corner-induced streamwise vorticity and unequal shear-layer development along the major and minor axes, which can lead to axis switching and modify the early growth of coherent structures (Zaman Reference Zaman1996; Chen & Yu Reference Chen and Yu2014; Prasad & Unnikrishnan Reference Prasad and Unnikrishnan2023). In planar and non-axisymmetric jets, large-scale flapping motions have long been associated with intrinsic hydrodynamic organisation and shear-layer instability (Thomas & Goldschmidt Reference Thomas and Goldschmidt1986; Matsubara, Alfredsson & Segalini Reference Matsubara, Alfredsson and Segalini2020). In high-speed non-axisymmetric jets, recent studies further indicate that rectangular geometry can favour flapping-type branches under resonant conditions (Mazharmanesh et al. Reference Mazharmanesh, Nogueira, Weightman and Edgington-Mitchell2025). These geometry-driven features can bias the dominant unsteadiness toward non-axisymmetric symmetry classes, and antisymmetric or flapping-type responses have been reported as energetically significant in compressible rectangular-jet dynamics and associated spectral peaks (Gojon, Gutmark & Mihaescu Reference Gojon, Gutmark and Mihaescu2019; Chakrabarti et al. Reference Chakrabarti, Gaitonde and Unnikrishnan2021). Supersonic twin rectangular free jets have been shown to support screech coupling, with intermittent out-of-phase coupling reported as a dominant state (Jeun, Wu & Lele Reference Jeun, Wu and Lele2024). Furthermore, symmetry-resolved analyses have demonstrated that principal spectral peaks can be organised by distinct reflectional symmetry components, and that antisymmetric responses about the major axis can be especially prominent in SPOD (Yeung & Schmidt Reference Yeung and Schmidt2025). These results from free and single-impinging rectangular jets suggest that nozzle-shape-dependent modal organisation may also be relevant to the interference dynamics of rectangular DIJs. However, direct, plate-resolved evidence linking geometry-induced flow organisation in rectangular DIJs to far-field tonal noise remains lacking. This gap motivates a detailed comparative investigation of dual-impinging jets with different nozzle geometries.
Accordingly, this study examines aeroacoustic instabilities in high-speed rectangular DIJs, in direct comparison with a baseline circular configuration. The primary objectives are to characterise the high-frequency wall-pressure fluctuations and dominant modal structures in the rectangular dual-jet flow, and to assess how these near-field features correlate with and contribute to far-field tonal noise generation. The analysis is therefore centred on the impingement-surface-pressure field and its correlation with the radiated tones. Prior studies of rectangular and non-axisymmetric jets are used to guide the interpretation of geometry-dependent modal organisation, while the direct evidence examined here comes from the PSP-resolved wall-pressure field and the synchronised far-field acoustic measurements. From these data, the dominant impingement tones and their associated surface-pressure patterns are extracted using cyclostationary SPOD (CS-SPOD) and coherent output power (COP) analyses. The COP analysis quantifies the coherence between near-field pressure fluctuations and far-field acoustic signals, effectively identifying the regions on the plate that act as sound sources. Meanwhile, CS-SPOD is used to decompose the unsteady pressure field and reveal the prevalent modes at the tone frequencies, highlighting frequency-specific changes in modal dominance (attenuation or amplification) introduced by the rectangular nozzle. Finally, a co-resonance framework is applied to interpret how the coupling between the two jets influences the amplification of acoustic peaks in the rectangular DIJs. In this way, the study provides a unified near- to far-field analysis of circular versus rectangular DIJs, yielding new insight into the geometry-dependent feedback mechanisms governing their tonal noise production.
2. Experimental set-up
2.1. High–speed dual-impinging jets
Impinging-jet experiments were carried out in a semi-anechoic chamber. The facility performance and the associated wind-tunnel characteristics have been documented in our earlier studies (Liu et al. Reference Liu, Qin, Zhao, Wang, Liu and Peng2023; Wei et al. Reference Wei, Zhang, Fan, Wang, Peng and Liu2024). In this study, a rectangular nozzle with the same exit area is designed with an aspect ratio (AR) of b : a = 2 : 1, a geometry commonly employed in investigations of rectangular compressible jets (Karnam, Baier & Gutmark Reference Karnam, Baier and Gutmark2020; Jeun et al. Reference Jeun, Karnam, Jun Wu, Lele, Baier and Gutmark2022; Lakshmi Narasimha Prasad & Unnikrishnan Reference Lakshmi Narasimha Prasad and Unnikrishnan2024). For the rectangular DIJs, the two nozzles have identical orientation on the impingement plate. Their centres are located on the plate y-axis at x = 0 and y = ± S/2, so that the centre-to-centre spacing S is measured along the y-direction. The major axis of each rectangular exit is parallel to the plate y-axis, while the minor axis is parallel to the plate x-axis. Thus, the two nozzles are not rotated relative to each other, and the long sides of the rectangular footprints face each other across the symmetry line between the jets. For comparison, a circular nozzle with a diameter of D = 30 mm is adopted as the reference configuration. Both nozzles are purely converging. Their contraction sections follow a modified Vitoshinsky profile and are designed using the method of characteristics, giving
 \begin{equation} r(x)=\frac{D_{\textit{in}}}{2\sqrt{1-\left(1-\left(D/D_{\textit{in}}\right)^{2}\right)x/L}} .\end{equation}
Here, r(x) is the nozzle radius along the flow direction, L is the length of the contraction section, where L = 130 mm, and Din = 80 mm is the diameter of the upstream section. The resulting jets are underexpanded over the operating range considered here. The ideally expanded jet Mach number M lies in the range of M = U/c a = 1.0–1.2, the impinging distance is h/D = 2–3 and the centre-to-centre spacing of the twin nozzles is S/D = 3.5. Here, U is the ideally expanded jet-exit velocity. These conditions are selected to span regimes in which pronounced high-speed impingement tones have been reported in the literature. The key geometrical and operating parameters of the rectangular and circular DIJs are summarised in table 1. Representative working conditions reported in the literature are listed separately in table 2. By adjusting the upstream pressure, the jet exits the nozzle throat at sonic conditions (M = 1) and subsequently expands freely outside the nozzle. The resulting jets are underexpanded over the operating range considered here. At the highest Mach number investigated, M = 1.2, the near-field flow is expected to contain shock-related structures, as commonly observed in comparable high-speed impinging and rectangular-jet configurations (Mazharmanesh et al. Reference Mazharmanesh, Nogueira, Weightman and Edgington-Mitchell2025; Wei et al. Reference Wei, Fan, Liang, Tu and Gao2025). The discussion of potential-core development, shock-cell organisation and axis switching in this context follows these prior studies, since the present diagnostics focus on the pressure field after the jets impinge on the plate. At the short impingement distances considered here, h/D = 2–3, the plate is located in a region where the nozzle-shape imprint may still affect the impingement response. Measurements were performed across the full matrix of Mach number and impinging distance for both circular and rectangular DIJs. Detailed modal and near-/far-field correlation analyses are presented for the representative high signal-to-noise ratio (SNR) case (M = 1.2, h/D = 3), while the trends of dominant peak frequency and relative intensity across the entire matrix are summarised in § 4.1. The impinging plate is made of 7075 aluminium alloy, with dimensions of 600 × 600 × 20 mm (length × width × thickness) in the form of a rectangular cuboid. The average surface roughness of the aluminium plate is 6.3. During the experiment, the ambient pressure and temperature were 95.2 kPa and 299 K, respectively. The nozzle pressure ratio (NPR), defined as the ratio of the stagnation pressure P 0 to the ambient pressure P ∞ . The ideally expanded jet Mach number can be determined by the following formula:
Key geometrical and operating parameters of the rectangular and circular DIJs.

The representative working conditions for high-speed jets in the literature. The relative acoustic peak (acoustic peak magnitude minus adjacent broadband noise level) is estimated from spectral contour data in cited references. These values serve exclusively for qualitative assessment of acoustic peak intensity trends and experimental condition characterisation. Owing to variations in microphone placement and measurement configurations across studies, results should not be directly compared between different literature sources.

 \begin{equation} M=\sqrt{\frac{2}{\gamma -1}\left({\textit{NPR}}^{\tfrac{\gamma -1}{\gamma }}-1\right)} ,\end{equation}
where γ = 1.4 is the specific heat ratio. Since all tests used cold jets without heating, the ideally expanded Mach number defined via the NPR is consistent with using the ambient sound speed to within experimental uncertainty.
Schematic diagram of the DIJ experimental set-up: (a) overall schematic, showing the plate coordinate system and the nozzle arrangement. For the rectangular case, the two nozzles have identical orientation, with their major axes parallel to the plate y-axis and their centres located at y = ±S/2, and (b) calibration for PSP pressure data by static taps.

Figure 1. Long description
Panel A: A schematic diagram of the dual-impinging jets experimental setup. The diagram includes a ground plate, UV-LED, camera, nozzles, pressure sensors, and far-field microphones. The plate coordinate system is shown with axes labeled x, y, and z. The nozzles are arranged symmetrically with their major axes parallel to the y-axis. The dynamic sensor and static tap regions are highlighted, with specific dimensions and positions indicated. Panel B: A graph showing calibration by static taps. The graph includes two subplots for rectangular and circular nozzles. The x-axis is labeled y/D and the y-axis is labeled kPa. The rectangular nozzle data is shown in red and the circular nozzle data is shown in black. Zoomed-in views of specific data points are provided for detailed inspection.
2.2. Fast-response pressure-sensitive paint and far–field microphone measurement
The fast-response PSP used in this study was a customised in-house formulation (Zhang et al. Reference Zhang, Wang, Wei, Fan, Peng and Liu2025), a variant of the polymer/ceramic PSP described by Egami et al. (Reference Egami, Konishi, Sato and Matsuda2019). The synchronised measurement system combining fast PSP with far- and near-field pressure sensors is shown in figure 1. The PSP was applied over the main impingement region of the plate, covering approximately a 6D × 8D rectangular area. The paint was excited by an ultraviolet light-emitting diode (UV-LED; UHP-T-LED-385, Prizmatix), and the luminescence intensity was recorded using a high-speed camera (Fastcam SA-Z, Photron). The camera was equipped with a Nikon 50 mm f /1.2 lens and a filter set spanning 570–700 nm. The sampling rate of the camera was 20 kHz, and the spatial resolution is 0.40 mm/pixel. For calibration and in situ reference, four static pressure taps and four dynamic pressure sensors (103B02, PCB Piezotronics) (In the following text, PCB refers to the dynamic pressure sensor used in this study) were installed along the centreline of the dual jets on the impingement plate. Static pressures were acquired using an electronic scanning pressure gauge (DSA3217-PTP/16Px-15psid, Scanivalve). The dynamic pressure signals were sampled at 51.2 kHz. Far-field acoustic measurements were performed using an array of eleven 1/4 in. microphones (GRAS 46BE). The microphones were mounted at a radius of 120D from the impingement region and distributed from −30° to 70° in 10° increments, as shown in figure 1(a), to resolve the polar-angle dependence of the tonal radiation in the plane normal to the impingement plate. Accordingly, the directivity information reported below represents a polar-angle characterisation within this observer plane. All microphone signals were sampled at 51.2 kHz and synchronised with the PSP and plate-mounted pressure sensors. The offline calibration and online validation procedures for the present PSP system have been documented in Wei et al. (Reference Wei, Zhang, Fan, Wang, Peng and Liu2024). Calibration against the dynamic pressure sensors indicates that the error in capturing acoustic peak frequencies is within 1 %, which allows reliable resolution of characteristic frequencies up to 7600 Hz. Comparison with the static taps further shows that the average error in the mean pressure measurement is 1.66 %, with a maximum error below 4 % (figure 1 b). These assessments confirm that the fast-response PSP provides sufficient accuracy and bandwidth for the present high-speed DIJ measurements. Additional dynamic validation of the PSP pressure fluctuations against the in situ PCB sensors is provided in Appendix A.
3. Data processing
3.1. The PSP data extraction
Figure 2 summarises the procedure used to extract unsteady impingement pressure from the raw fast-response PSP images. The grey scale image sequence recorded by the high-speed camera was first corrected for background illumination and camera noise. The images were then mapped to the physical coordinates of the impingement plate using a set of reference markers, which accounts for the camera viewing angle and yields the calibrated intensity field I(x, t) (figure 2 a).
Procedure used for the determination of unsteady pressure from raw PSP grey scale image.

To convert the intensity ratio Iref / I to a pressure ratio P/Pref , an offline calibration was applied to account for the pressure and temperature sensitivities of the paint (Peng et al. Reference Peng, Gu, Li and Liu2018) (figure 2 b)
 \begin{equation} \frac{I_{\textit{ref}}}{I}=A\left(T\right)\frac{P}{P_{\textit{ref}}}+B\left(T\right)\! ,\end{equation}
where A(T) and B(T) are temperature-dependent calibration coefficients. During the experiments, the dynamic pressure sensors mounted on the impingement plate provided in situ reference signals that partially compensate for temperature drift and other environmental variations, thereby improving the accuracy of pressure measurements. The light intensity–pressure relationship yields an initial estimate of the surface-pressure field P(x, t).
This initial PSP-derived field is typically affected by measurement noise, which can reduce the SNR of the pressure fluctuations (Peng, Wang & Liu Reference Peng, Wang and Liu2016; Sugioka et al. Reference Sugioka, Hiura, Chen, Matsui, Morita, Nonomura and Asai2019). Following Liu et al. (Reference Liu, Qin, Tang, Zhao, Wang, Liu and Peng2022), we therefore applied POD-based denoising to the PSP pressure fluctuations. The plate-mounted dynamic pressure sensors are used as independent references to validate the denoising outcome and to guide the choice of the truncation level M t (figure 2 c). The denoised fluctuating pressure field is reconstructed as
 \begin{equation} p'\left(\xi ,t\right)=\sum\limits_{k=1}^{M_{t}}a_{k}\left(t\right){\Phi} _{k}\left(\xi \right),M_{t}=120 ,\end{equation}
where the temporal coefficients a
k
(t) are obtained by projecting the snapshots onto the orthonormal spatial modes, a
k
(t) =
 $\langle$
p′(x, t), Φ
k
(x)
 $\rangle$
. The plate-mounted dynamic pressure sensors are not used in the construction of the POD modes themselves, but serve as independent pointwise references to validate the reconstruction and to select an appropriate truncation level. A truncation of M
t
= 120 was finally adopted, which retains approximately 99.95 % of the total PSP fluctuation energy and provides the best overall agreement between the PSP- and PCB-derived signals at the sensor locations.
3.2. Cyclostationary spectral proper orthogonal decomposition
Spectral proper orthogonal decomposition identifies frequency-resolved coherent structures by eigen-decomposing the cross-spectral density of statistically stationary data (Towne, Schmidt & Colonius Reference Towne, Schmidt and Colonius2018) and has become a standard energy-optimal tool for many unforced turbulent flows (Zhang et al. Reference Zhang, Wang, Liu, Wang and Liu2024; Mazharmanesh et al. Reference Mazharmanesh, Nogueira, Weightman and Edgington-Mitchell2025). In the present high-speed DIJs, however, the wall-pressure field exhibits pronounced discrete tones, implying a periodic modulation of second-order statistics and the potential emergence of cross-frequency correlations. Such cyclostationary behaviour lies outside the strict assumptions of standard SPOD, which treats each frequency independently. We therefore adopt the cyclostationary extension of SPOD (CS-SPOD) proposed by Heidt & Colonius (Reference Heidt and Colonius2024), which generalises SPOD to flows with time-periodic statistics by constructing an eigenvalue problem over frequency sets separated by the fundamental cycle frequency. This formulation groups correlated frequency components and extracts modes that maximise the correlated energy within each frequency set
 $\Omega$
γ
. When cross-frequency correlations vanish, the formulation reduces to standard SPOD (Heidt Reference Heidt2025). A comparison between SPOD and CS-SPOD for DIJ data is provided in Appendix B.
A complex-valued scalar process q(t) is cyclostationary with period T 0 if its first- and second-order statistics satisfy
 \begin{align} E\{q(t)\}&=E\{q(t+T_{0})\} , \end{align}
 \begin{align} R(t,\tau )&=R(t+T_{0},\tau ) , \end{align}
where E{·} denotes the expectation operator, R(·) is the autocorrelation function and τ is the time lag. These time-periodic statistics may be expanded as Fourier series
 \begin{align} E\left\{q\left(t\right)\right\}&=\sum\limits_{k_{\alpha }=-\infty }^{\infty }\hat{q}_{{k_{\alpha }}{\alpha _{0}}}\mathrm{e}^{{i}2\pi ({k_{\alpha }}{\alpha _{0}})t} , \end{align}
 \begin{align} R(t,\tau )&=\sum\limits_{k_{\alpha }=-\infty }^{\infty }\hat{R}_{{k_{\alpha }}{\alpha _{0}}}(\tau )\mathrm{e}^{{i}2\pi ({k_{\alpha }}{\alpha _{0}})t} , \end{align}
where α 0 = 1/T 0 is the fundamental cyclic frequency, and (⋅)∗ denotes complex conjugation (Gardner, Napolitano & Paura Reference Gardner, Napolitano and Paura2006; Antoni Reference Antoni2009).
For the plate-resolved pressure field q ( x ,t), the cyclostationary two-point correlation is written as
 \begin{equation} \boldsymbol{R}(\boldsymbol{x},\boldsymbol{x}',t,\tau )=E\{\boldsymbol{q}(\boldsymbol{x},t+\tau /2)\boldsymbol{q}^{*}(\boldsymbol{x}',t-\tau /2)\} .\end{equation}
The cyclic cross-spectral density (CCSD) is defined as the double Fourier transform of R
 \begin{equation} \boldsymbol{S}(\boldsymbol{x},\boldsymbol{x}',\alpha ,f)=\iint \boldsymbol{R}(\boldsymbol{x},\boldsymbol{x}',t,\tau )\mathrm{e}^{-{i}2\pi (\alpha t+f\tau )}\mathrm{d}t\mathrm{d}\tau .\end{equation}
For cyclostationary processes, S ( x , x ’, α, f) is non-zero only at discrete cycle frequencies α = k α α 0. The CCSD evaluated at these discrete cycle frequencies provides the building block for the CS-SPOD operator.
The CS-SPOD groups correlated frequency components into a frequency set
 $\Omega$
γ
= {…, γ–2α
0, γ – α
0, γ, γ + α
0, γ + 2α
0, …}. The associated eigenvalue problem may be expressed in frequency-set form
 \begin{equation} \int _\Omega\boldsymbol{S}\big(\boldsymbol{x},\boldsymbol{x}',\gamma \big)\boldsymbol{W}\big(\boldsymbol{x}'\big)\boldsymbol{\psi }\big(\boldsymbol{x}',\gamma \big)\mathrm{d}\boldsymbol{x}'=\lambda (\gamma )\boldsymbol{\psi }(\boldsymbol{x},\gamma ) ,\end{equation}
where,
 $\boldsymbol{S}$
(
x
,
x
’, γ) denotes the CS-SPOD tensor assembled over
 $\Omega$
γ
,
 $\boldsymbol{W}$
(
x’
) is a positive-definite spatial weighting,
ψ
(
x
, γ) are the CS-SPOD eigenvectors and
 $\mathit{\lambda }(\mathit{\gamma })$
are the corresponding modal energies.
In this study, each temporal record used for CS-SPOD was divided into blocks of 520 samples, corresponding to a signal duration t end = 40 T 0. A 67 % overlap was applied between adjacent blocks, yielding 100 blocks in total. A Hamming window was applied prior to the Fourier transform to minimise cyclic leakage and reduce estimator variance. These settings provided stable CCSD and CS-SPOD estimates for the dominant tonal frequency sets analysed in § 4.3. A full mathematical derivation and algorithmic details can be found in Heidt & Colonius (Reference Heidt and Colonius2024). In this study, CS-SPOD is applied to the PSP-resolved pressure fluctuations on the impingement plate. The extracted modes are therefore interpreted as frequency-resolved organisations of the wall-pressure response of the impingement system.
4. Results and discussion
4.1. Aeroacoustic instability characteristics in dual-impinging jets
Figure 3 summarises the far-field tonal characteristics of rectangular and circular DIJs across the tested parameter space (M = 1.0–1.2, h/D = 2–3), and highlights a representative high Mach case to illustrate the contrast in spectral organisation between the two nozzle geometries. For both nozzle types, the spectra at h/D = 3, M = 1.2 exhibit several discrete peaks, but their alignment with the classical single-loop feedback prediction differs between the rectangular and circular configurations. As shown in figure 3(a), the rectangular DIJs exhibit multiple acoustic peaks after the twin jets impinge on the flat plate. Here, the Strouhal number St was defined as follows:
 \begin{equation} St=\frac{\textit{fD}}{U} ,\end{equation}
where U is the ideally expanded jet-exit velocity defined in § 2.1. The fundamental frequency and its harmonics, calculated using Powell’s formula, are indicated by dashed lines in figure 3 for harmonic orders ranging from n = 1 to n = 5. The convective velocity U c was estimated based on an empirical model (Gojon, Bogey & Marsden Reference Gojon, Bogey and Marsden2015)
 \begin{equation} U_{c}=0.65U-\left(0.65U-0.5U_{e}\right)\frac{1}{1+h/D} .\end{equation}
Far-field tonal characteristics of rectangular and circular DIJs. (a) Representative far-field sound pressure level (SPL) at h/D = 3 and M = 1.2, obtained from the reference microphone at
 $\Theta$
= 40°. The black dashed lines denote the fundamental feedback frequency f
1 and its harmonics with phase lag p = 0. The blue bands indicate the corresponding harmonic ranges obtained when the phase-lag term is varied within −0.2 ≤ p ≤ 0, consistent with the shocklet-related time-delay interpretation of p and the commonly reported bounds of p in impingement literature. (b) Sensitivity of the harmonic alignment to the p, quantified by the mean deviation between the measured peak Strouhal numbers and the nearest Powell-predicted harmonic frequencies. (c) Peak Strouhal numbers of the measured far-field tones over the investigated operating matrix, extracted from the same reference microphone at
 $\Theta$
= 40°. Rectangular and circular symbols denote the respective nozzle types, with larger markers highlighting the dominant peak at each Mach number. (d) Far-field tonal intensity of representative peaks as a function of observer angle θ, measured by the microphone array at 120D in the plane normal to the impingement plate.

Figure 3. Long description
Panel A: Two line graphs depict the far-field acoustic spectra for rectangular and circular direct impinging jets at h/D = 3 and M = 1.2. The x-axis represents the Strouhal number (St) and the y-axis represents the SPL in decibels (dB). The rectangular jet spectrum shows peaks at various Strouhal numbers, labeled as n = 1 to n = 5. The circular jet spectrum also shows peaks at similar Strouhal numbers, with an additional annotation indicating a phase lag. Panel B: A line graph shows the sensitivity of harmonic alignment to the phase-lag term (p). The x-axis represents the phase-lag term (p) and the y-axis represents the mean error in percent. The graph shows a decreasing trend in mean error as the phase-lag term increases from -0.2 to 0. Panel C: Two scatter plots depict the peak Strouhal numbers of measured far-field tones over the investigated operating matrix. The x-axis represents the Strouhal number (St) and the y-axis represents the Mach number (M). Rectangular and circular symbols denote the respective nozzle types, with larger markers highlighting the dominant peak at each Mach number. Panel D: A line graph shows the far-field tonal intensity of representative peaks as a function of observer angle (θ). The x-axis represents the observer angle (θ) in degrees and the y-axis represents the SPL in decibels (dB). The graph compares the tonal intensity for rectangular and circular nozzles, with annotations indicating specific harmonic modes.
To estimate the fundamental frequency f 1 in (1.1), the ambient speed of sound c a was determined from the environmental conditions and is approximately 340 m/s. Here, U e is the jet-exit velocity. Powell’s feedback formulation further includes a phase-lag term p to account for non-instantaneous hydrodynamic–acoustic interactions. Recent studies link p to a finite shocklet-related time delay in supersonic impingement, with reported values spanning p = 0 (Gojon et al. Reference Gojon, Bogey and Marsden2016) to −0.4 (Krothapalli et al. Reference Krothapalli, Rajkuperan, Alvi and Lourenco1999). In the present weakly supersonic DIJ conditions (M = 1.2), we adopt p = 0 as a first-order reference and assess the robustness of the harmonic alignment by considering a modest negative range (p = −0.2) based on the shocklet-delay magnitude reported by Weightman et al. (Reference Weightman, Amili, Honnery, Soria and Edgington-Mitchell2017b ). In figure 3(a), the black dashed lines denote f 1 and its harmonics predicted with p = 0. The blue bands indicate the corresponding frequency bands obtained by varying the phase-lag term over p ∈ [−0.2, 0]. To make the choice of p more quantitative, figure 3(b) quantifies the sensitivity of the harmonic alignment to p using the mean deviation between the measured peak Strouhal numbers and the nearest Powell-predicted harmonic frequencies. The minimum deviation occurs at p = 0, which supports its use as the baseline setting in the present configuration. Importantly, the strongest rectangular-DIJ peak at St = 0.42 remains outside any single integer-harmonic band over the range p ∈ [−0.2, 0], indicating that its non-harmonic character is robust against reasonable variations of the phase-lag term. For the rectangular DIJs, two prominent spectral peaks fall within the vicinity of the third and fourth harmonic bands (around n = 3.17, St = 0.37, and n = 4.01, St = 0.46), indicating that part of the response is compatible with the classical feedback scaling. The strongest peak at St = 0.42 (n = 3.63) lies between the third and fourth harmonics outside any single integer-harmonic band. This deviation is consistent with a geometry-conditioned modification of the effective feedback loop, whose wall-pressure manifestation is examined in §§ 4.2–4.4 using co-resonance analysis and modal decomposition. A similar sensitivity of impingement-tone behaviour to nozzle geometry was reported for non-circular impinging jets by Balakrishnan & Srinivasan (Reference Balakrishnan and Srinivasan2019). Tam & Norum (Reference Tam and Norum1992) attributed such peaks to symmetric and antisymmetric feedback instability modes. In contrast, the circular nozzle exhibits a single dominant spectral peak at n = 3.92, corresponding to the fourth harmonic of the fundamental feedback frequency f 1, located at St = 0.45, a feature widely reported in literature (Arthurs & Ziada Reference Arthurs and Ziada2012; Stahl et al. Reference Stahl, Gaitonde, Bhargav and Alvi2022). Figure 3(c) compares the acoustic peak spectra of the rectangular and circular DIJs under various conditions. Rectangular and circular symbols represent the respective nozzle types, with larger markers denoting the dominant peak at each Mach number. Feedback-loop frequencies are indicated as lines. In rectangular DIJs, dominant spectral peaks are frequently observed between adjacent harmonics, whereas in circular DIJs the dominant tones track the harmonic lines more closely. The observer-angle dependence of the principal tones is further summarised in figure 3(d). In the far field at 120D, the rectangular nozzle does not introduce a pronounced redistribution of tonal directivity in the plane normal to the impingement plate. The common harmonic-related peak exhibits a broadly similar angular trend for the circular and rectangular DIJs, and the additional rectangular-specific peak near n = 3.63 does not produce a qualitatively different directivity pattern within the microphone-array plane shown in figure 1(a).
To capture the unsteady loading on the impingement surface, PSP was applied to the region of interest. Figure 4 presents the time-averaged, instantaneous and root mean square (r.m.s.) results for both rectangular and circular DIJs. At an impinging distance of h/D = 3, each nozzle forms a high-energy impingement zone reflecting the nozzle-exit shape, with an interference band between the two nozzles at the centre (figure 4 a). Over the monitored region (7D × 5D), the surface-averaged mean pressure yields a total average pressure of 123.7 kPa for the circular DIJs and 113.5 kPa for the rectangular DIJs. The lower mean level for the rectangular case is consistent with the more rapid decay of rectangular jets associated with flapping along the short axis (Karnam et al. Reference Karnam, Baier and Gutmark2020), and corresponds to an 8.25 % reduction in the average impingement pressure. Projecting the nozzle shapes onto the obstacle reveals that the pressure fluctuations are more pronounced at the centre and edges (figure 4 b), leading to larger r.m.s. values (figure 4 c). For rectangular jets, two corner vortices are also observed near the diagonal corners of the projection, a classical feature of rectangular jets (Zaman Reference Zaman1996). The r.m.s. data along the centrelines of the x- and y-axes (figure 4 d) indicate that the rectangular nozzle exhibits a broader pressure influence along the major axis (y-axis). Nevertheless, in the twin-jet interference region (−0.1 < y/D< 0.1, −2 < x/D< 2), the coupling range and intensity of the rectangular twin jets decreases. This anisotropic near-wall imprint is consistent with prior studies of supersonic rectangular and twin rectangular jets. In particular, the non-axisymmetric shock/shear-layer organisation of rectangular jets can retain a strong directional preference over the early downstream region (Mazharmanesh et al. Reference Mazharmanesh, Nogueira, Weightman and Edgington-Mitchell2025), while in twin rectangular jets the coupling state has a marked influence on the near-field pressure fluctuations (Samimy et al. Reference Samimy, Katterle, Leahy, Webb, Yarlagadda and Hiler2024). The wall-pressure footprints therefore remain compatible with the expected free-jet and twin-jet behaviour of rectangular nozzles before impingement.
(a) Time-averaged and (b) transient pressure field from PSP (upper: instantaneous total pressure contours; lower: instantaneous fluctuating pressure contours). (c) The r.m.s. of pressure field and (d) r.m.s. profiles along y-axis (left) and x-axis (right).

(a) Pressure-gradient amplitude indicator of the time-averaged PSP pressure field, and (b) PSP pressure spectrum at y/D = 1.75 along the x-axis for rectangular (left) and circular (right) DIJs. Since the plate coordinates are normalised by D, S g is reported in units of kPa/D.

Although the rectangular DIJs reduce the mean impingement pressure, they reorganise the near-wall-pressure field and introduce stronger spatial gradients on parts of the plate. To quantify this spatial non-uniformity, figure 5(a) shows the distribution of a pressure-gradient amplitude indicator over the impingement plate, and figure 5(b) presents pressure spectra at selected plate locations. In this study, S g is used to characterise the spatial variation of the time-averaged PSP pressure field, while the pressure spectra at y/D = 1.75 are used to characterise the streamwise frequency content. The gradient indicator S g of the time-averaged pressure p(i, j) at a given point was calculated as follows:
 \begin{equation} S_{g}=\left| \frac{p(i+1,j)-p(i-1,j)}{2{\unicode[Arial]{x0394}} x}\right| +\left| \frac{p(i,j+1)-p(i,j-1)}{2{\unicode[Arial]{x0394}} y}\right| .\end{equation}
Here, Δx and Δy denote the grid spacings in the x- and y-directions, respectively. This definition applies a centred-difference approximation in each direction and combines their absolute magnitudes to highlight regions of strong near-wall-pressure variation. In figure 5(a), elevated values of S g appear mainly along the outer regions of the nozzle projection. Compared with the circular nozzle, for which the pressure field spreads more uniformly outward, the rectangular nozzle exhibits stronger directional preference and greater non-uniformity in the near-wall-pressure variation, in conformity with the conclusions of Prasad (Reference Prasad2024). In the frequency domain, circular DIJs exhibited consistent spectral characteristics along the x-axis, corresponding to the annular-symmetric modal features (Davis et al. Reference Davis, Edstrand, Alvi, Cattafesta, Yorita and Asai2015). Conversely, the rectangular DIJs show a more complex behaviour: at the centreline of the upper jet (y/D = 1.75), adjacent measurement points may exhibit significantly different spectra (figure 5 b). At x/D = 0, dominant fluctuations occur at n = 3.17 and n = 4.01. In the regions −0.5 < x/D < −0.1 and 0.1 < x/D< 0.5, multiple dominant frequencies coexist, including n = 3.17, 3.63 and 4.01. Among these, the strongest peak appears at n = 3.63, consistent with far-field spectral observations (figure 3). With increasing distance from the jet centre, in the ranges −0.9 < x/D < −0.5 and 0.5 < x/D< 0.9, harmonic peaks diminish and non-harmonic peaks weaken, indicating reduced spectral coherence. This suggests that, while circular DIJs show a strong correlation between wall pressure and far-field acoustic fluctuations over the entire nozzle projection range, rectangular DIJs still exhibit such correlations, but with varying dominant frequencies depending on jet–wall interaction zones. Multiple dominant peaks are observed across the plate, suggesting that more than one coherent structure may be relevant, depending on frequency and location.
4.2. Aeroacoustic correlation analysis for far- and near-field pressures
Given the consistency between the PSP-resolved near-field pressure fluctuations and the far-field microphone signal in both frequency and relative intensity, we employed COP analysis (Noda et al. Reference Noda, Nakakita, Wakahara and Kameda2018) to quantify near- to far-field spectral correlation and to identify the regions on the plate that are most strongly linked to the radiated tone. The implementation of the COP method consists of three main steps, as illustrated in figure 6(a). In step I, a fast Fourier transform (FFT) is applied to convert the time-domain pressure signals into the frequency domain, allowing identification of peaks at matching frequencies. Then, in step II, the auto-spectral densities R xx and R yy for the near- and far-field signals, respectively, as well as their cross-spectral density R xy , are computed to obtain the squared coherence Coh2(f)
 \begin{equation} \mathrm{Coh}^{2}\left(f\right)=\frac{\left| R_{\textit{xy}}(f)\right| ^{2}}{R_{\textit{xx}}(f)R_{\textit{yy}}(f)} .\end{equation}
A higher Coh2(f) value indicates a stronger correlation between near-field pressure fluctuations and far-field acoustic pressure at the corresponding frequency, implying a greater contribution of the surface pressure to the radiated sound. Finally, the COP, Cop(f) is calculated as the product of Coh2(f) and the r.m.s. amplitude of near-field pressure fluctuations at each frequency (step III)
 \begin{equation} \mathrm{Cop}(f)=\mathrm{Coh}^{2}(f)\times p'_{\textit{rms}}(f) .\end{equation}
(a) Schematics of COP analysis, and (b) COP analysis for aerodynamic noise sources of circular DIJs at St = 0.45. (c) Sensitivity of the COP source distribution to the analysis bandwidth, shown for f a ± 5 and f a ± 15 Hz around the target frequency.

Figure 6. Long description
Panel A: The schematic of COP analysis includes three steps. Step I shows FFT with microphone and PSP data. Step II displays the coherence formula. Step III presents the COP formula using RMS data. Panel B: The COP analysis for aerodynamic noise sources of circular DIJs at St = 0.45 includes three heat maps. The RMS heat map shows pressure distribution in kPa. The Coh squared heat map shows coherence values. The Cop heat map shows COP values in kPa. Panel C: The sensitivity of the COP source distribution to the analysis bandwidth is shown for fa 5 and fa 15 Hz around the target frequency. Both heat maps display pressure distribution in kPa.
The resulting COP spectrum not only reflects the coherence between surface-pressure fluctuations and far-field acoustic output but also quantifies the effective source strength, thus enabling spatial mapping of potential acoustic sources on the solid surface. This approach has recently been adopted for the joint analysis of PSP data and far-field acoustic measurements (Peng et al. Reference Peng, Gu, Li and Liu2018; Matsui et al. Reference Matsui, Kasai, Sugioka, Asai and Nonomura2023). As an example, figure 6(b) shows the COP results for circular DIJs at n ≈ 4 (St = 0.45), demonstrating the method’s capability to extract localised aerodynamic noise sources on the plate. The corresponding bandwidth-sensitivity check in figure 6(c) confirms that the identified source regions are robust to modest variations in the analysis bandwidth. In this study, both the PSP and microphone datasets used for COP analysis consist of 20 000 samples, corresponding to 1 s of continuous PSP snapshots captured by high-speed camera. A frequency resolution of 1 Hz is used to ensure reliable r.m.s. calculations, and a rectangular window with 50 % overlap is applied in the spectral estimation. To define the analysis band around each target frequency f a , we benchmark our selection against representative COP implementations in the literature. Nakakita & Ura (Reference Nakakita and Ura2020) employed a 40 Hz band centred on the dominant tone (f a ± 10 Hz) in an unsteady-PSP/microphone correlation framework. More recently, Sijtsma et al. (Reference Sijtsma, Dreux, Delescluse, Leneveu and Marjono2024) adopted a one-third-octave band centred at 1000 Hz in a generalised COP formulation using grouped sensors. Guided by these established practices and considering the frequency-alignment uncertainty inherent to fast PSP, we select a 20 Hz band (f a ± 10 Hz) as a consistent and conservative choice for the present tonal-dominated DIJ conditions. A sensitivity check using slightly narrower and wider bands, f a ± 5 and f a ± 15 Hz, yielded very similar COP source distributions, while mainly affecting the absolute COP amplitude rather than the dominant spatial structure, as shown in figure 6(c). For circular DIJs, the dominant acoustic sources are primarily distributed in three regions: the jet core, the wall-jet region and the interference zone between the two nozzles (Zhang et al. Reference Zhang, Wang, Wei, Fan, Peng and Liu2025), corresponding respectively to direct jet impingement, enhanced pressure fluctuations due to wall-jet development and jet–jet interaction along the centreline.
The COP analysis for sound source of rectangular DIJs at (a) St = 0.24, (b) St = 0.37, (c) St = 0. 42 and (d) St = 0.46.

As for the rectangular DIJs, we extracted acoustic peaks at frequencies around n = 2, 3, 3.6 and 4, corresponding to St = 0.24, 0.37, 0.42 and 0.46, respectively, as shown in figure 7. Overall, compared with the strong coherence between impingement pressure and aerodynamic noise exhibited by circular DIJs at the acoustic peak frequency (St = 0.45), the rectangular cases show a modestly lower Coh2(f) than the circular cases at the selected peaks. This difference reflects the altered footprint and azimuthal organisation imposed by the rectangular exits. Additionally, the elongated outlet shape of rectangular DIJs may cause a broader spatial distribution of the impingement region, further weakening the spatial and temporal correlation between near-field and far-field pressure signals. Since the acoustic peak at n = 2 is not sufficiently prominent, the resulting Cop(f) distribution is not discussed further. For n = 3 (figure 7 b) and n = 4 (figure 7 d), the COP analysis reveals aerodynamic noise source structures similar to those of circular DIJs, two vertically symmetric annular distributions, indicating both structural similarity and harmonic base frequency alignment between the two nozzle types. A detailed comparison of COP results on the impingement plate shows that, for rectangular DIJs, dominant pressure fluctuations remain concentrated in the jet core and wall-jet regions, while the fluctuation intensity in the interference region between the two nozzles is significantly weakened. Moreover, for rectangular DIJs, the originally circular annular structures become elliptical, a direct consequence of the rectangular nozzle-exit shape, which also reduces the spatial extent of the interference region. The reduced coverage and diminished pressure fluctuation amplitude in the interference region are consistent with the r.m.s. distribution of pressure fluctuations shown in figure 4(d). At n = 3.7 (figure 7 c), the rectangular DIJs exhibit a distinct jet–plate interaction mechanism, giving rise to a Cop(f) distribution that corresponds to the strongest impingement tone observed. Unlike the classical annular-symmetric pattern, this aerodynamic noise source structure exhibits a twin quadrupole-like shape, with pronounced pressure fluctuations appearing on either side of the centreline along the y-axis of each nozzle. This result confirms the absence of peak pressure fluctuations near x/D = 0 for mode n = 3.7, as observed in figure 5(b). The overall source distribution is aligned with the edge of the nozzle projection area on the plate, with a discontinuity appearing along the far end of the long axis. At this stage, we regard this feature as a plate-pressure footprint consistent with geometry-conditioned rectangular-jet organisation. In this sense, the rectangular nozzle introduces a much clearer directional organisation on the impingement plate than in the observer plane sampled by the far-field microphone array, indicating that its primary geometric effect is to redistribute the near-wall-pressure field rather than to strongly alter the far-field directivity within the measured vertical plane at 120D. The COP analysis establishes a connection between the pressure fluctuations on the impingement plate and the far-field acoustic pressure fluctuations, both in the spatial and frequency domains. It maps the time-domain far-field signal measured by the microphone onto frequency-correlated acoustic-source structures on the impingement surface. Building upon this foundation, the subsequent analysis examines the dynamic evolution of the pressure fluctuations measured by PSP, with particular attention to the aeroacoustic instabilities present in rectangular DIJs.
4.3. Modal dominance variations in rectangular DIJs
To shed light on the characteristics of coherent structures induced by high-speed rectangular DIJs, we employed CS-SPOD to analyse the pressure fluctuation field on the impingement plate. Here, we employ the cyclostationary extension of SPOD to extract the phase-dependent impinging structure of the plate-pressure field. The present PSP signals exhibit clear periodic modulation at the fundamental loop frequency and its harmonics (see cyclic-coherence evidence in Appendix B), motivating the use of CS-SPOD, which extracts modes that maximise correlated energy across the frequency set
 $\Omega$
γ
= {…, γ–2α
0, γ – α
0, γ, γ + α
0, γ + 2α
0, …}. This use is consistent with the original formulation of Heidt & Colonius (Reference Heidt and Colonius2024). In the present analysis, α
0 is taken as the fundamental cycle frequency associated with the dominant loop tone identified in § 4.1. We therefore analyse the wall-pressure statistics using CS-SPOD with α
0 as the cycle frequency to quantify how this fundamental modulation organises the spatial structures and their harmonic companions on the plate. Each record was divided into blocks of 520 samples, corresponding to t
end
= 40T
0 = 40/α
0, to provide sufficient cycles for stable second-order estimates. We use 67 % overlap with a Hamming window to reduce cyclic leakage and estimator variance, following standard cyclostationary practice (Antoni Reference Antoni2009). The resulting 100 blocks provide the statistical convergence required for the subsequent CS-SPOD eigen-decomposition.
(a) The CS-SPOD energy spectrum of circular DIJs, and (b) CS-SPOD eigenvalues at γ St = 0, normalised by the total energy at that frequency set.

Real component of the CS-SPOD modes of circular DIJs (a) at four dominant modes with γ St = 0, and (b) with four different frequency deviation γ St of mode 1.

Figure 9. Long description
Panel A: Four heat maps showing the real component of CS-SPOD modes of circular DIJs at four dominant modes with St = 0. Each heat map is labeled as Mode 1, Mode 2, Mode 3, and Mode 4. The x-axis and y-axis are labeled as x/D and y/D, respectively. The color scale ranges from -1 to 1, with darker colors indicating lower values and lighter colors indicating higher values. Panel B: Four heat maps showing the real component of CS-SPOD modes of circular DIJs with four different frequency deviations St of mode 1. Each heat map is labeled with different values of St: 0.003, 0.02, 0.04, and 0.06. The x-axis and y-axis are labeled as x/D and y/D, respectively. The color scale ranges from -1 to 1, with darker colors indicating lower values and lighter colors indicating higher values.
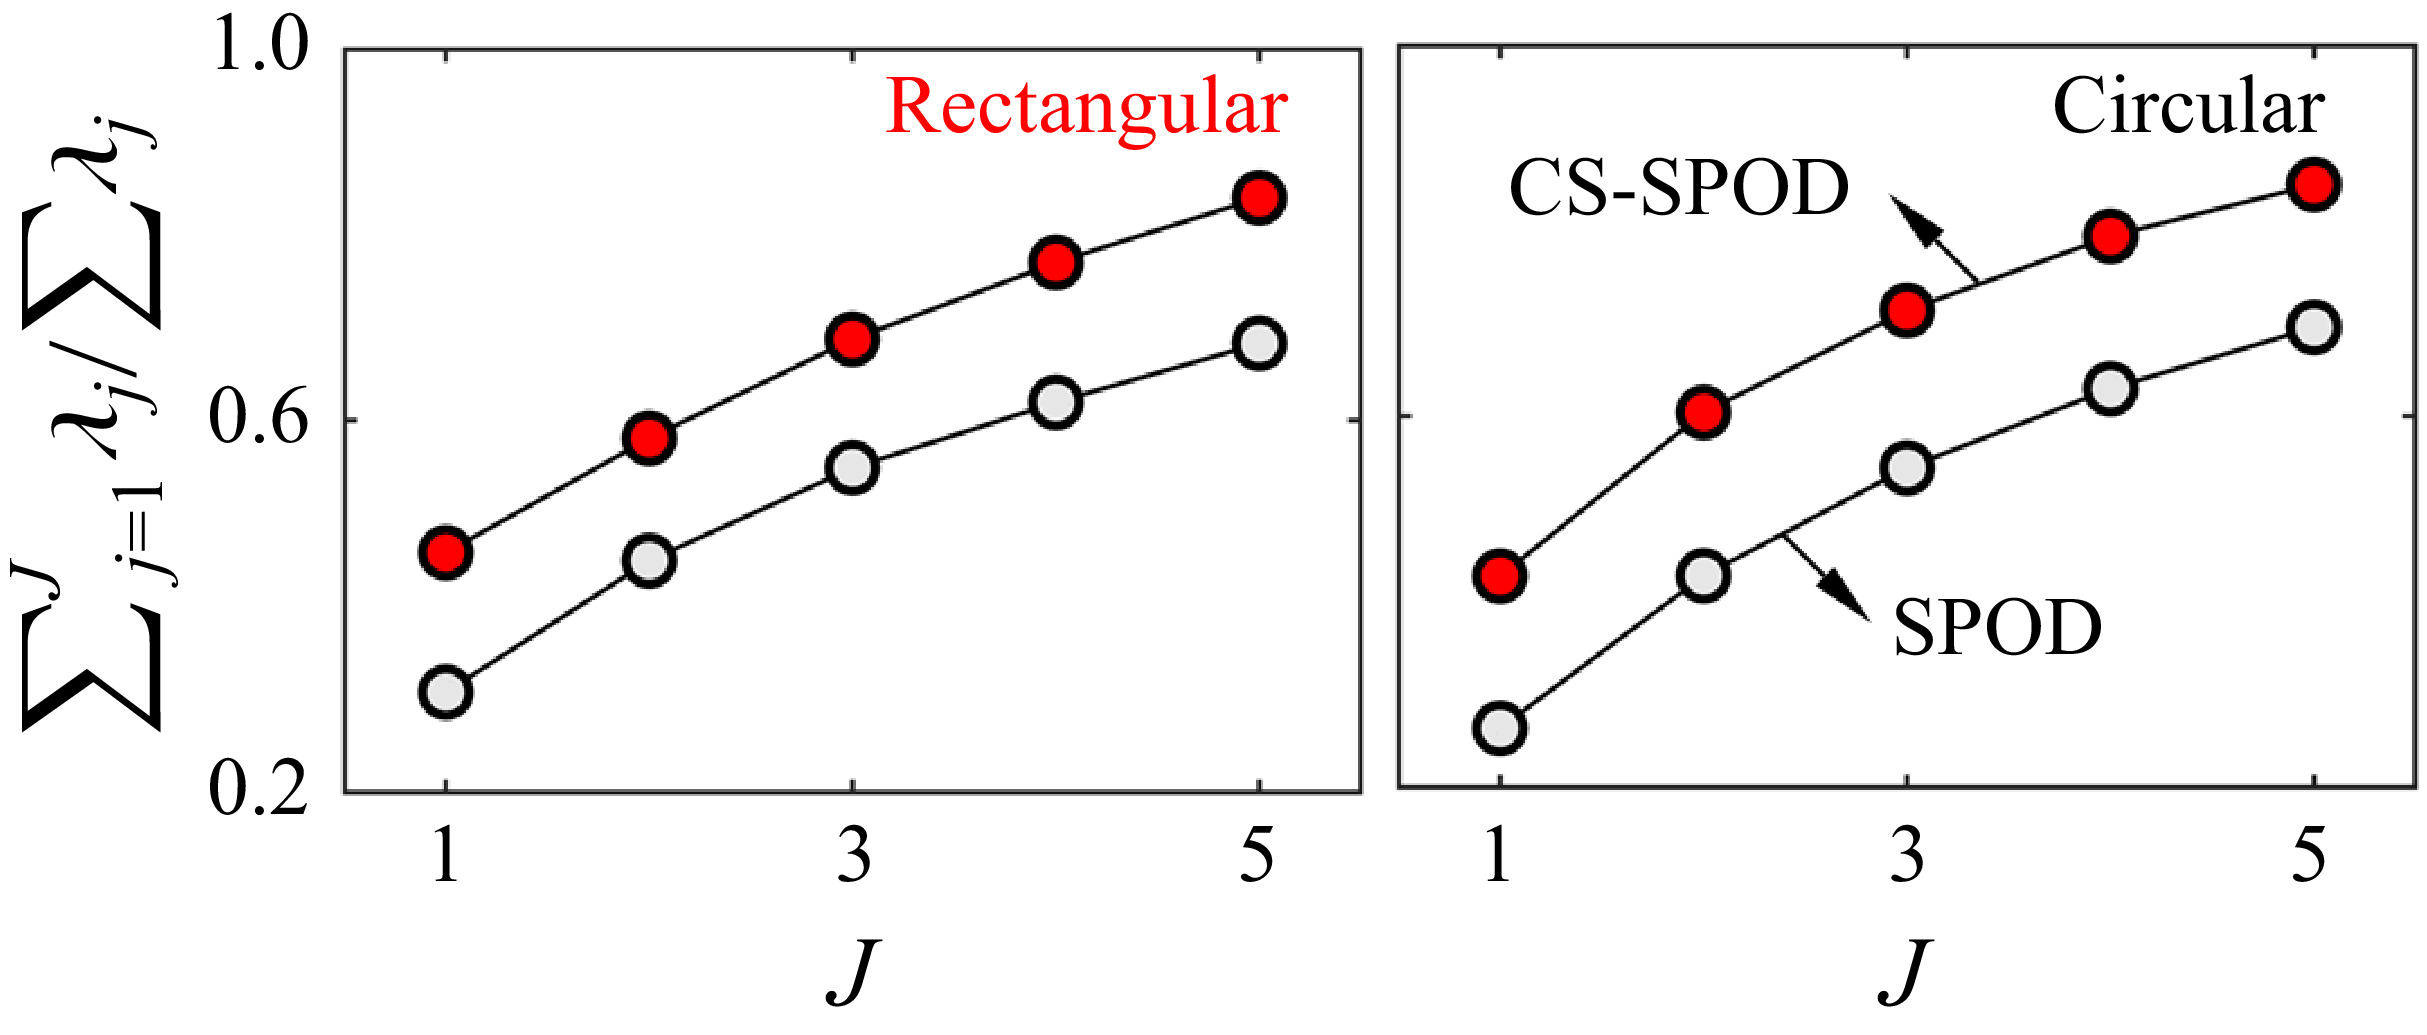
Taking the circular DIJs as an example, we present their CS-SPOD energy spectrum and modal-energy distribution (figure 8) as a benchmark. Under the condition of h/D = 3 and M = 1.2, it is known that circular DIJs exhibit a strong pressure fluctuation peak at the fourth harmonic (n = 4), and consequently, a strong CS-SPOD energy peak is observed only at γ
St
= 0 (figure 8
a). This indicates that the frequency set composed of the fundamental α
0 and its harmonics nα
0,
 $\Omega$
γSt = 0 = {α
0, 2α
0, 3α
0, …}, dominates the energy content in the CS-SPOD decomposition. Here, γ
St
denotes the non-dimensional frequency deviation γ from the fundamental and its harmonics, defined as γ
St
= γD/U. In this study, the frequency resolution of γ
St
is (α
0/40) × D/U ≈ 3 × 10⁻³. Within the frequency set
 $\Omega$
γSt = 0, the first two modal energies (λ
j/Σλ
j) account for 42.8 % and 17.6 % of the total energy, respectively. We then present the normalised real components of CS-SPOD modes for various mode numbers and frequency deviations, as shown in figure 9. Within
 $\Omega$
γSt = 0, the coherent structures identified become increasingly fragmented as the mode number increases (figure 9
a). Notably, the first CS-SPOD mode at
 $\Omega$
γSt = 0 exhibits an annular-symmetric structure that closely resembles the acoustic source pattern obtained from COP analysis (figure 6
b). The leading CS-SPOD mode at
 $\Omega$
γSt = 0 yields a surface-pressure footprint that is spatially consistent with the high-COP regions extracted at the same tone frequency. This agreement provides a useful cross-check between two independent analyses of the same PSP–microphone dataset. While CS-SPOD captures the most spatially coherent and energetic organisations of the plate-pressure field at a given frequency, COP analysis identifies the effective source regions contributing to far-field radiation. The spatial consistency supports the use of the first CS-SPOD mode as a compact representation of the dominant wall-pressure organisation at the fundamental cycle frequency, which we use as a baseline for comparing rectangular and circular configurations. It is found that the influence of frequency deviation γ
St
on mode identification is significantly greater than that of mode number. Since the circular DIJs exhibit a single-frequency acoustic peak (n = 4) under the current conditions, larger values of γ
St
correspond to broadband aerodynamic noise components that deviate from the dominant tonal feature, manifesting as spatially incoherent structures on the impingement plate (figure 9
b). Based on these observations, the subsequent CS-SPOD analysis focuses on the first-order mode within each characteristic frequency set, as it consistently captures the most spatially coherent and energetically dominant structures associated with the acoustic sources of interest.
(a) The CS-SPOD energy spectrum of rectangular DIJs, and (b) CS-SPOD eigenvalues at γ St = 0 and 0.03, normalised by the total energy at that frequency set.

In figure 10, we present the CS-SPOD energy spectrum and modal eigenvalues of rectangular DIJs at two selected frequency deviations, γ
St
= 0 and γ
St
= 0.03. In contrast to the circular DIJs, the rectangular configuration exhibits three distinct energy peaks in the CS-SPOD spectrum: one at γ
St
= 0 and two symmetric peaks at |γ
St
| = 0.03. These peaks align well with the far-field acoustic peaks shown in figure 3, indicating that, in addition to the fundamental frequency set
 $\Omega$
γSt = 0, the rectangular DIJs also exhibit a more energetic frequency set. Considering the symmetry of the spectrum, we focus our analysis on the positive branch
 $\Omega$
γSt = 0.03. Comparing the energy contribution of the first two modes (figure 10
b), we observe that, for
 $\Omega$
γSt = 0, the first and second modes account for 29.4 % and 17.1 % of the total energy, respectively. These values are significantly lower than those of the circular DIJs, suggesting reduced mode dominance and potentially limiting the clarity of coherent structure identification. In contrast, for the frequency set
 $\Omega$
γSt = 0.03, the first mode dominates with an energy fraction of 47.3 %, while the second mode only accounts for 11.6 %, indicating a much stronger and clearer leading coherent structure at this offset frequency. To verify the convergence of CS-SPOD eigenvalues for the model problem, we further examine the distribution and relative errors of the first 50 modes derived from pressure fluctuations on the impingement plate (figure 11). Here, the frequency deviation is fixed at γ
St
= 0.03 to evaluate the effect of signal duration, t
end
, on the resolution of CS-SPOD modal energy. As shown in figure 11(a), the modal-energy spectrum becomes stable when t
end
reaches 40T
0, indicating that this duration is sufficient to achieve convergence of the CS-SPOD eigenvalues. Using the modal-energy distribution at t
end
= 80T
0 as a reference, we quantify the relative errors of each mode at t
end
= 5T
0, 10T
0, 20T
0 and 40T
0. As illustrated in figure 11(b), the relative errors of the first two modes (red and blue dots) and the average of the first five modes (white dots) are all below 5 % for t
end
= 40T
0, confirming the statistical convergence of the CS-SPOD results. To further assess the uncertainty associated with the modal-energy fractions at the dominant off-harmonic peak, we applied bootstrap and jackknife resampling to the analysis blocks (Efron & Stein Reference Efron and Stein1981; Benedict & Gould Reference Benedict and Gould1996), and the resulting 95 % confidence intervals are shown in figure 11(c). The two resampling procedures yield closely similar uncertainty ranges. In particular, the confidence interval of the first modal-energy fraction remains clearly separated from those of the lower modes, which supports the statistical significance of its dominant contribution despite the finite ensemble size and overlap of the analysis blocks.
(a) The CS-SPOD modes’ energy of rectangular DIJs for multiple signal durations t end , and (b) relative error for different CS-SPOD modes with different t end, showing the convergence of CS-SPOD eigenvalues of the model problem. (c) Bootstrap and jackknife 95 % confidence intervals of the modal-energy fractions for the first five modes at γ St = 0.03, showing the uncertainty associated with the finite ensemble of overlapping blocks.

Figure 11. Long description
Panel A: A line graph shows the CS-SPOD modes’ energy for rectangular dual-impinging jets over multiple signal durations. The x-axis represents the mode number, and the y-axis represents the normalized energy. The graph includes multiple lines indicating different signal durations, with annotations showing specific durations like 80T0, 40T0, 20T0, and 10T0. Panel B: A line graph illustrates the relative error for different CS-SPOD modes at various signal durations. The x-axis represents the signal duration, and the y-axis represents the error percentage. The graph includes lines for different modes, labeled as Mode 1, Mode 2, and Mode 3, along with a line for the mean error. Panel C: A box plot displays the 95 percent confidence intervals of the modal-energy fractions for the first five modes at St = 0.03. The x-axis represents the mode number, and the y-axis represents the normalized energy. The plot includes two sets of box plots, one for Bootstrap and one for Jackknife, with annotations indicating the different methods.
(a) Evolution of annular-symmetric modes in rectangular DIJs at
 $\Omega$
γSt = 0, and (b) normalised modal strength on centreline (x/D = 0), showing the convection velocities on the impingement plate.

Figure 12 presents the first-order CS-SPOD mode and the normalised modal strength along the centreline (x/D = 0) for the frequency set
 $\Omega$
γSt = 0. At this frequency set, the dominant mode exhibits a classical annular-symmetric structure expanding around the nozzle exit. The jet column undergoes necking, converging into a central jet core, which then rapidly expands outward and re-forms into new cores downstream. In this study, two distinct modal peaks are consistently identified on the impingement plate in the outer region of the jet core (y/D < −1.75), as shown in figure 12(b), indicating the presence of a relatively stable double-layered annular structure. A representative convection velocity C
v
of the annular-symmetric inner annular structure at
 $\Omega$
γSt = 0 along the radial direction was estimated from the phase-dependent shift of the peak in the normalised modal strength. Over the interval from 0 to π, the peak position varies approximately linearly with phase, while the interval from π to 2π exhibits the same trend with opposite sign. We therefore determined C
v
from a linear fit of the peak position against phase over the first half-cycle, and used the second half-cycle as a symmetry check. The fitted slope gives C
v
= 0.34D/0.25T = 0.57U ± 0.02U (95 % confidence interval). The 95 % confidence interval was obtained from the uncertainty of the fitted slope in the linear regression of peak position against phase. Additional estimates based on different phase intervals yielded closely similar values, indicating that the inferred convection velocity is not sensitive to the specific phase increment used. This representative value agrees well with the empirical prediction U
c
= 0.60U for circular nozzles (equation (4.2)). The link between this radial propagation velocity and the axial convection velocity lies in the flow-acoustic resonance observed under lock-in conditions (Wei et al. Reference Wei, Zhang, Fan, Wang, Peng and Liu2024). Specifically, at characteristic frequencies where strong flow-acoustic coupling is present, pressure disturbances propagating along the impingement surface tend to synchronise with the convection of coherent structures in the jet shear layer, resulting in comparable velocities. This phenomenon has been confirmed by both numerical simulations (Gojon & Bogey Reference Gojon and Bogey2018) and experimental measurements (Davis et al. Reference Davis, Edstrand, Alvi, Cattafesta, Yorita and Asai2015). For comparison, we also present in figure 13 the real part of the first-order CS-SPOD mode for the circular DIJs at the same frequency set
 $\Omega$
γSt = 0, from which the phase-dependent dynamics of the lower annular shear layer was extracted to compute C
v
. The downstream propagation velocity along the y-direction was found to be 0.60U, in close agreement with the empirical value.
(a) Evolution of annular-symmetric modes in circular DIJs at
 $\Omega$
γSt = 0, and (b) phase-dependent dynamics of the lower annular structure’s shear layer.

Figure 13. Long description
Panel A: This panel contains four heatmap plots showing the evolution of annular-symmetric modes in circular dual-impinging jets at Strouhal number 0. Each heatmap is labeled with a different angle (theta = π/4, π/2, 3π/4, π) and shows the normalized variable Φ^P/||Φ^P||_max. The x and y axes are labeled x/D and y/D, respectively, where D is the diameter. The color scale ranges from -1 to 1, indicating the intensity of the modes. Panel B: This panel features a scatter plot with a fitting curve. The x-axis is labeled Phase and ranges from 0 to π, while the y-axis is labeled y-position and ranges from 0 to 0.6. The scatter plot shows experimental data points with error bars, and the fitting curve represents the modeled relationship between phase and y-position.
This agreement indicates that the annular-symmetric response of the circular DIJs follows the canonical convective timing of the classical single-loop feedback branch. It also provides a useful reference for examining whether the rectangular-specific peak at St = 0.42 can be interpreted as a shifted harmonic caused by a different convection velocity. Figure 14 therefore evaluates the sensitivity of the Powell-predicted harmonic locations to the assumed value of U
c
/U. Within the propagation-velocity range inferred from the rectangular annular-symmetric wall-pressure branch, C
v
/U = 0.57 ± 0.02, the fourth harmonic remains above the measured St = 0.42 peak. Even at the lower bound of this range, U
c
/U = 0.55, the distance between St = 0.42 and the nearest integer harmonic remains approximately 0.022. Exact alignment with the fourth harmonic would require U
c
/U = 0.506, which lies below the range inferred from the measured annular-symmetric branch. Thus, changing U
c
/U within the present mode-based reference range does not move the St = 0.42 peak into natural alignment with an integer harmonic. This supports the interpretation that the peak is not simply a shifted harmonic of the annular-symmetric feedback branch. The circular case therefore provides a useful baseline for judging whether the rectangular-specific peak reflects a modified harmonic response or the appearance of a different modal organisation. This interpretation is consistent with previous supersonic impinging-jet studies showing that symmetric and antisymmetric oscillation modes can occupy distinct tonal branches under resonant conditions. Notably, the first-order mode for the circular DIJs also exhibits a clear annular-symmetric structure under this frequency set. This observation suggests that, under ideal conditions, once a closed acoustic feedback loop is established (originating at the nozzle exit and reflecting off the impingement plate), jets exhibiting annular-symmetric impingement structures tend to lock onto the fundamental frequency and its integer harmonics. Consequently, both rectangular and circular DIJs that produce similar annular-symmetric impingement structures and coherent modal propagation paths can exhibit pronounced frequency responses at integer multiples in the
 $\Omega$
γSt = 0 set.
Sensitivity of the harmonic alignment of the rectangular DIJ peak at St = 0.42 to the convection velocity U c /U. (a) Powell-predicted harmonic Strouhal numbers for n = 1–4, evaluated at p = 0. The brown horizontal line denotes the measured rectangular-DIJ peak at St = 0.42. The red shaded band indicates the propagation-velocity range inferred from the annular-symmetric wall-pressure branch in rectangular DIJs, C v /U = 0.57 ± 0.02. The blue vertical line denotes U c /U = 0.60, which is close to the circular-DIJ value and the empirical estimate from equation (4.2). (b) Minimum distance between St = 0.42 and the nearest integer harmonic. Matching St = 0.42 to the nearest harmonic requires U c /U = 0.506, while at U c /U = 0.55, the lower bound of the rectangular-DIJ range, the remaining distance is approximately 0.022.

By comparing the common peak intensity at n = 4 for rectangular and circular DIJs in figure 3(a), it is evident that the peak amplitude is significantly attenuated for the rectangular nozzles. Given that both nozzle types exhibit nearly identical mean impingement intensity and convection velocity along the y-direction, this attenuation can be attributed to the reduced energy contribution within the frequency set
 $\Omega$
γSt = 0 and a weakened interference region. As shown in figure 10(a), the frequency set
 $\Omega$
γSt = 0 carries a lower proportion of total modal energy in the case of rectangular DIJs. This suggests that the annular-symmetric feedback loop, which dominates the acoustic resonance mechanism in circular DIJs, is not the primary contributor in the rectangular configuration. To illustrate this, a schematic of the simplified annular modes for both rectangular and circular DIJs is provided in figure 15(a). In rectangular configuration, the two nozzles are identically oriented, with their major axes parallel to the plate y-axis and their centres aligned along the same axis. This configuration alters the resulting annular-symmetric structure from a circular to an elliptical shape. Furthermore, the apparent transport speed of this annular-symmetric footprint along the plate x-direction is reduced to approximately 0.47U, which spatially confines the effective interference region. Despite this, both the rectangular and circular DIJs exhibit phase-dependent variations of normalised modal strength under the nozzle projection area on the impingement plate, which follow a regular sinusoidal trend, as shown in figure 15(b). This reflects a similar periodic jet behaviour in both configurations. However, the first-order mode energy contribution under
 $\Omega$
γSt = 0 is significantly lower in rectangular DIJs, which compromises the coherence and integrity of the annular structure. As a result, the interference between the two jets is weakened. This observation is supported by the distribution of the acoustic source structures on the impingement plate, as shown in figure 7, where the source intensity in the interference region is notably weaker for rectangular DIJs. Consequently, despite exhibiting a similar resonance mechanism, the lower modal energy and diminished interference strength in rectangular DIJs result in a weaker acoustic peak at the shared characteristic frequency (n = 4).
(a) Schematics of simplified annular-symmetric modes for rectangular and circular DIJs, and (b) phase-dependent variations of mean modal strength under the nozzle projection area on the impingement plate.

At γ
St
= 0.03, the evolution of modal structures in rectangular DIJs reveals deviations in the dominant acoustic peak frequency, suggesting a distinct flow–acoustic coupling mechanism compared with the circular configuration (figure 13). At the strongest peak frequency (St = 0.42), the modal structure on the impingement plate exhibits a clear transition between rectangular and annular patterns (figure 16
a). Drawing upon the spatial mode characteristics reported in studies of free jets (Rodríguez, Jotkar & Gennaro Reference Rodríguez, Jotkar and Gennaro2018; Rodríguez et al. Reference Rodríguez, Stavropoulos, Nogueira, Edgington-Mitchell and Jordan2023; Mazharmanesh et al. Reference Mazharmanesh, Nogueira, Weightman and Edgington-Mitchell2025), we refer to the corresponding leading wall-pressure organisation at this frequency set as a flapping-antisymmetric mode with four stages. In rectangular DIJs, this mode is associated with a geometry-conditioned antisymmetric organisation of the jet response. This interpretation is also compatible with recent free-jet results showing that supersonic rectangular jets can support a flapping-type branch when the downstream shock/shear-layer organisation departs from the nozzle-exit symmetry (Mazharmanesh et al. Reference Mazharmanesh, Nogueira, Weightman and Edgington-Mitchell2025). The coupled impingement process then selects and amplifies its plate-pressure signature. The stage labels I–IV provide a compact description of the phase-dependent surface-pressure morphology of the leading CS-SPOD mode, and are used here for clarity of presentation. Unlike the annular-symmetric modes that radiate uniformly outward, this mode exhibits a spatially antisymmetric distribution with distinct dynamical stages. Figure 16(b) shows the mean modal strength extracted from the nozzle projection region on the impingement plate, capturing the essential features of this flapping-antisymmetric mode. At the zero-phase point (stage I, stage corresponding to the COP-identified source footprint), the coherent structure displays a bi-antisymmetric distribution with a central nodal line along the streamwise direction, and its spatial distribution is consistent with the COP distribution discussed in § 4.2. Energy concentrates along the two longer edges of the rectangular footprint, while the shorter edges exhibit localised instabilities. This configuration likely reflects the influence of shear-layer perturbations originating from the short axis, as observed in prior studies (Karnam et al. Reference Karnam, Baier, Gutmark, Jeun, Wu and Lele2021). As the phase advances (stage II, transition stage), the surface-pressure footprint evolves from a bi-antisymmetric rectangular pattern toward an annular-like distribution, accompanied by a gradual weakening of the long-edge-dominated features. By phase = π/2, the rectangular signature has nearly vanished, giving way to a hollow, annular-like footprint. In the subsequent phase interval (stage III, recovery stage), a central high-amplitude patch reappears in the plate-pressure field, and the overall footprint regains a more rectangular character. In the final stage (stage IV, perturbation stage), the plate-pressure footprint shows renewed localisation near the short-axis edges, consistent with the re-emergence of antisymmetric flapping signatures on the surface. During this final stage, the mean modal strength remains relatively unchanged, yielding a configuration that persists over a finite phase interval. This four-stage evolution recurs twice within a single CS-SPOD cycle, with the 180°–360° phase interval mirroring the 0°–180° development, thereby forming a complete cycle of the flapping-antisymmetric mode. The modal behaviour described above is consistent with a geometry-conditioned antisymmetric organisation of the rectangular jets. This interpretation is supported by three observations from the present data. First, the COP footprint at St = 0.42 is concentrated near the nozzle-edge regions rather than in the centre interference region, as shown in figure 7(c). Second, the dominant frequencies vary across the plate, as shown in figure 5(b), which indicates that the strongest non-harmonic response is confined to specific jet–wall interaction zones. Third, the leading mode at
 $\Omega$
γSt = 0.03 is much more dominant than that at
 $\Omega$
γSt = 0, as shown in figure 10(b). Notably, while bi-axial flapping modes reported in free rectangular jets are characterised by transverse anti-symmetry and streamwise periodicity (Mazharmanesh et al. Reference Mazharmanesh, Nogueira, Weightman and Edgington-Mitchell2025), the impingement configuration introduces additional constraints and mode interactions. These results suggest that the dominant antisymmetric branch is favoured by the rectangular geometry, while the coupled impingement process selects and strengthens its plate-pressure signature. In this study, the term flapping-antisymmetric mode refers to the leading wall-pressure organisation associated with this frequency set under impinging and coupled conditions.
(a) Evolution of flapping-antisymmetric mode at
 $\Omega$
γSt = 0.03, (b) phase-dependent variations of mean modal strength and (c) schematic of simplified flapping modes for rectangular DIJs.

4.4. Co-resonance amplification in rectangular DIJs
To quantify the influence of twin-jet coupling on the tonal response of rectangular DIJs, we employ the co-resonance framework of Stahl et al. (Reference Stahl, Gaitonde, Bhargav and Alvi2022). In the DIJs, in addition to the feedback loops formed individually by each jet, the acoustic propagation paths between the two jets establish a broader global feedback loop (GDIJ ) (figure 17 a). The interaction between the global DIJ loop (GDIJ ) and the single-jet loop (SDIJ = f 1) provides a kinematic route for constructive or destructive interference, depending on their phase alignment. Following Stahl’s framework (2022), the co-resonance factor RDIJ (0–1) is defined to quantify the degree of phase matching between the single-jet and global loops
 \begin{align}& N=n\frac{S_{\textit{DIJ}}}{G_{\textit{DIJ}}}=n\boldsymbol{\cdot }f_{1}\boldsymbol{\cdot }\left(\frac{2h}{U_{c}}+\frac{2\sqrt{h^{2}+S^{2}}}{c_{a}}\right)\! ,\end{align}
 \begin{align}&\qquad\quad R_{\textit{DIJ}}=1-2\left| N-\text{round}(N)\right|\! , \end{align}
where n denotes the integer coupling state associated with the two-loop phase relation, and S/D and h/D denote the nozzle spacing and impingement distance, respectively. A larger RDIJ indicates a stronger potential for constructive two-loop phasing at a given frequency, whereas a smaller value suggests a tendency toward cancellation. As shown in figure 17(b), RDIJ varies quasi-periodically with the Strouhal number St, highlighting the frequency-selective nature of two-loop phasing. Peaks observed at frequencies with high RDIJ are therefore consistent with constructive coupling. For the rectangular DIJs, this interpretation is especially relevant to the non-harmonic peak at St = 0.42. As shown in §§ 4.2 and 4.3, the modal identity of this peak is inferred from the COP footprint and the CS-SPOD wall-pressure mode, rather than from the co-resonance model itself. The role of RDIJ is therefore to assess whether this observed flapping-antisymmetric response is favoured by the phase relation between the single-jet and global dual-jet loops. The peak near St = 0.42 falls close to a strong co-resonant phase-matching condition, which is consistent with its large amplitude in the dual-jet configuration. Stahl et al. (Reference Stahl, Gaitonde, Bhargav and Alvi2022) noted that the integer index can, in principle, take any positive value, while practical interpretations often emphasise integer-multiple coupling as a phase-delay-consistent reference (Jeun, Wu & Lele Reference Jeun, Wu and Lele2021). In the present rectangular DIJs, the flapping-antisymmetric mode identified suggests that geometry-conditioned mode selection can shift the dominant peak away from the classical integer-harmonic sequence. We therefore interpret RDIJ as a complementary phase-consistency measure for the observed peaks. The framework is not used as a stand-alone predictor of modal existence, but as a test of whether an observed peak is favoured or suppressed by dual-jet phase coupling.
(a) Schematic of co-resonance feedback mechanism and (b) the co-resonance factor RDIJ for DIJs.

Figure 17. Long description
Panel A: A schematic diagram of the co-resonance feedback mechanism. It shows an upstream process and a downstream process with dual-nozzles and an impinging plate. The diagram includes labels for the upstream process, downstream process, dual-nozzles, impinging plate, and various arrows indicating the direction of processes and feedback loops. Panel B: A line graph showing the co-resonance factor RDIJ for dual-impinging jets. The x-axis is labeled St and the y-axis is labeled RDIJ. The graph highlights regions of strong instabilities and shows lines representing constructive and destructive interference.
Acoustic spectrum for SIJs and DIJs of (a) rectangular and (b) circular nozzles to show the two-nozzle coupling effect.

Schematic diagram illustrating the main aeroacoustic instabilities induced by rectangular dual-jets’ interference effect.

Figure 19. Long description
Panel A: The initial nozzle modulation effect shows the transition from a circular to a rectangular nozzle. The mean pressure and coefficient of pressure distributions are displayed for both configurations. Panel B: The dual-jets interference effect is depicted with different values of n and R DIJ. Constructive interference at n equals 3.7 and R DIJ equals 0.92 enhances instabilities with a SPL increase of 13.4 dB. At n equals 4 and R DIJ equals 0.39, the interference has minimal impact on the SPL, showing a 3.3 dB increase. Destructive interference at n equals 2 and R DIJ equals 0.19 weakens instabilities with a SPL decrease of 7.9 dB. Panel C: The downstream wall blockage effect illustrates different modes: flapping-antisymmetric mode, annular-symmetric mode, and weakened mode. The weakened mode shows suppressed peaks in the dual-jets.
We compared the acoustic spectra of SIJ (black line) and DIJs (red line) for both rectangular and circular nozzles to illustrate the coupling effects between the two nozzles (figure 18). The black dashed lines indicate the integer-multiple relationship of the classic feedback-loop frequencies. At n = 2, both rectangular and circular DIJs show a noticeable reduction in tonal amplitude, with values of 7.9 and 7.6 dB, respectively. The co-resonance factor at this frequency is the same for both cases, with RDIJ
= 0.19, indicating that the coupling between the jets suppresses the acoustic peak at this position. At n = 4, RDIJ
= 0.39, suggesting that the interference between the twin jets has minimal impact on the tonal amplitude, with respective increases of 3.3 and 0.6 dB for the circular and rectangular DIJs. When comparing the SIJ, it is evident that the rectangular SIJ exhibits a weaker tonal amplitude near n = 4, implying a lower degree of mode amplification in each rectangular nozzle. The rectangular-specific peak near n = 3.6 coincides with a high RDIJ
, indicating favourable two-jet phasing for this mode. The strong tonal intensity near n = 3.6 is therefore interpreted as the result of a rectangular-geometry-favoured antisymmetric branch that is further amplified by favourable dual-jet phasing, with a total increase of 13.4 dB. The key findings regarding the role of dual-jet interference in the observed tones are (figure 19): (i) the rectangular nozzle geometry favours an antisymmetric hydrodynamic organisation that is absent from the circular baseline. In the dual-nozzle configuration, jet–plate feedback and favourable two-jet phasing strengthen this branch, so that its plate-pressure signature becomes a prominent tonal response near n = 3.6. The resulting peak reflects both geometry-conditioned modal preference and constructive co-resonant coupling. The high value of RDIJ
therefore rationalises why this branch is strongly amplified in the dual-jet configuration, even though the branch itself is selected by the rectangular-nozzle geometry rather than predicted uniquely by the two-loop model. The convection-velocity estimates and the sensitivity check in figure 14 are most directly relevant to the annular-symmetric branch at
 $\Omega$
γSt = 0, for which both the circular and rectangular DIJs exhibit comparable representative propagation speeds. By contrast, the strongest rectangular-specific peak at St = 0.42 is associated with the flapping-antisymmetric mode at
 $\Omega$
γSt = 0.03, whose phase-dependent wall-pressure organisation does not admit a single monotonic transport path comparable to that of the annular mode. We therefore do not interpret the St = 0.42 peak as arising from a modified convection velocity within the classical harmonic branch. Instead, it is more consistently understood as the manifestation of a different modal branch, selected by the rectangular geometry and strengthened by coupled impingement and favourable two-loop phasing. (ii) For the annular-symmetric mode-dominated acoustic peaks, when the value of RDIJ
is small, the interference effect of the dual jets is limited or, due to destructive interference, can even suppress aeroacoustic instability. In this case, the dominant modes formed by the upper and lower nozzles remain relatively independent, and their energy contributions are lower. (iii) The coupling effects from the dominant modes of the dual jets transition from strong to weak as follows: rectangular nozzle’s flapping-antisymmetric mode, circular nozzle’s annular-symmetric mode and rectangular nozzle’s annular-symmetric mode.
This interpretation is based on the measured wall-pressure modes and the acoustic spectra, rather than on a separate reconstruction of the free-jet development upstream of the plate. The present results also suggest a broader qualitative interpretation of the rectangular-nozzle effect beyond the specific operating point used for the detailed modal analysis. Within the parameter range examined in figure 3(c), the rectangular DIJs more frequently exhibit dominant peaks that deviate from the classical integer-harmonic feedback lines, whereas the circular DIJs remain more closely aligned with the harmonic prediction. In the present framework, these off-harmonic peaks are associated with the flapping-antisymmetric branch identified in § 4.3, which modifies the classical feedback organisation and gives rise to a rectangular-specific tonal response, most prominently near n = 3.6. This tendency should not be interpreted as a universal frequency band detached from operating conditions. Rather, it reflects the modal-selection outcome produced jointly by nozzle geometry, impingement distance and twin-jet coupling. The roles of S/D and h/D can be interpreted directly through the co-resonance model. In this formulation, both parameters enter the phase-matching quantity N, and therefore affect the co-resonance factor R DIJ . Changes in h/D alter not only the local jet–plate interaction time but also the relative weighting of the downstream convective path and the upstream acoustic return path. Changes in S/D modify the global dual-jet propagation path and the phase relation between the single-jet and global loops. As a result, variations in either parameter are expected to shift the degree of phase matching for the flapping-antisymmetric branch, and hence its relative prominence, rather than merely translating the acoustic peaks in a kinematic manner. This interpretation is consistent with previous studies showing that interaction strength in dual impingement reorganises both the near-wall-pressure field and the acoustic response (Bhargav et al. Reference Bhargav, Mehta, Kumar and S. Alvi2022; Mehta et al. Reference Mehta, Natarajan, Sellappan, Gustavsson and Kumar2022). The sensitivity to nozzle AR is expected to follow the same geometric logic. The nozzle AR of 2 : 1 is a representative rectangular-jet configuration, and the associated flapping-antisymmetric response is consistent with the broader tendency of non-axisymmetric jets to favour geometry-conditioned flapping-type branches. As the nozzle departs further from axisymmetry, the asymmetry between the major- and minor-axis shear-layer development is expected to become more influential, which would favour a stronger departure from the circular-like annular response (Gojon et al. Reference Gojon, Gutmark and Mihaescu2019; Mazharmanesh et al. Reference Mazharmanesh, Nogueira, Weightman and Edgington-Mitchell2025). In this sense, higher-AR rectangular jets may be expected to exhibit a more pronounced redistribution of modal dominance. The planar jet may be viewed as an idealised limiting case of this trend, for which flapping-type organisation is especially prominent (Thomas & Goldschmidt Reference Thomas and Goldschmidt1986; Matsubara et al. Reference Matsubara, Alfredsson and Segalini2020). These results therefore suggest that the observed rectangular-specific tone is not an isolated anomaly of the chosen configuration, but part of a broader geometry-conditioned shift in modal preference in high-speed DIJs.
5. Conclusions
In this study, we examine the aeroacoustic instabilities of high-speed rectangular DIJs and compare their dominant surface-pressure modes and tonal responses with a circular baseline. Using synchronised fast-response PSP and far-field microphones, we establish a plate-resolved, frequency-specific link between coherent impingement-surface-pressure structures and radiated tonal content for the two nozzle geometries. Although the rectangular nozzle reduces the mean impingement pressure (by 8.25 %), it is accompanied by a richer set of spatially structured pressure signatures and a broader spread of prominent tonal components. A prominent rectangular-DIJ peak appears at St = 0.42, which does not align with an integer harmonic of the reference single-loop frequency, indicating an additional geometry-enabled tone beyond baseline feedback scaling. Coherent output power analysis shows frequency-dependent coherence between wall-pressure fluctuations and the far-field microphone signal, with the rectangular case exhibiting a more spatially concentrated, mode-conditioned source footprint for the dominant peaks. The dominant St = 0.42 peak is associated with a quadrupole-like COP footprint and a flapping-antisymmetric CS-SPOD mode on the plate; the centreline interference zone contributes less to the coherent radiation at this frequency. The CS-SPOD also identifies an annular-symmetric mode common to both geometries, while the rectangular configuration exhibits an additional flapping-antisymmetric surface-pressure mode at the strongest peak. These modes are discussed through their wall-pressure signatures on the impingement plate and their near- to far-field acoustic correlation. The directivity comparison, where discussed, is limited to the microphone-array plane normal to the impingement plate, and azimuthal variations in other observer planes remain a topic for future measurements. Within the co-resonance framework, this peak is consistent with favourable twin-jet phasing, suggesting that the strongest rectangular-DIJ tone arises from the combined effects of geometry-conditioned antisymmetric hydrodynamic organisation and constructive inter-loop coupling. In this interpretation, co-resonant phasing does not create the flapping-antisymmetric mode by itself. Instead, the rectangular nozzle favours an antisymmetric branch, and impingement feedback and twin-jet phasing strengthen its plate-pressure signature. The observed variations in modal dominance in rectangular DIJs may be associated with azimuthally localised K–H instabilities (Stahl et al. Reference Stahl, Prasad and Gaitonde2021), imperfect phase locking between the jets (Jeun et al. Reference Jeun, Karnam, Jun Wu, Lele, Baier and Gutmark2022) and the non-axisymmetric response tendencies reported in comparable rectangular-jet studies. Since the present diagnostics focus on the impingement plate and the far field, the discussion of potential-core development, shock-cell organisation and axis switching is taken from prior studies of comparable rectangular jets and serves as physical context for the measured plate-pressure response. Direct characterisation of the upstream free jets, for example using schlieren, particle image velocimetry or high-fidelity simulations, would be a useful extension for future work.
Funding
The authors gratefully acknowledge financial support for this study from National Natural Science Foundation of China (Grant Nos. 12172221, 12202476, 12372274), Natural Science Foundation of Shanghai (Grant No. 23ZR1433500), the Foundation of State Key Laboratory of Aerodynamics (Grant No. SKLA-2024-KFKT-3-003) and China Scholarship Council (No. 202506230376).
Declaration of interests
The authors report no conflict of interest.
Appendix A. Dynamic validation of PSP pressure fluctuations
This appendix validates the PSP pressure fluctuations in terms of spectral agreement, r.m.s. amplitude, coherence and high-frequency attenuation. Figure 20 compares the pressure fluctuation spectra obtained from PSP and the four in situ dynamic sensors for both rectangular and circular DIJs. The PSP spectra are extracted from the plate locations corresponding to the PCB sensor positions. For both nozzle geometries, the PSP-derived spectra reproduce the dominant tonal peaks observed by the PCB sensors with good agreement in both frequency and relative amplitude. Owing to the different sampling rates of the two systems, the PCB signals cover a broader frequency range than the PSP signals. The agreement is particularly clear in the frequency range containing the main impingement tones, which is also the range most relevant to the modal and near-/far-field analyses in the main text. Some divergence becomes visible toward the upper end of the plotted frequency range, where the PSP spectra exhibit a smoother roll-off than the PCB spectra. This behaviour is consistent with the finite dynamic frequency response of the PSP system.
Dynamic validation of PSP pressure fluctuations against four dynamic sensors for (a) rectangular and (b) circular DIJs.

A quantitative comparison is summarised in figure 21. Figure 21(a) shows the relative error of the r.m.s. pressure fluctuations measured by PSP with respect to the PCB sensors at the four sensor locations. The relative r.m.s. errors remain within a few per cent at all four positions for both nozzle geometries, indicating that the PSP captures the fluctuation amplitude with high accuracy for the present application. Figure 21(b) presents the frequency-dependent coherence between the PSP and PCB signals at sensor 1 as a representative example. The coherence remains high over most of the dominant-tone range, and is especially strong in the neighbourhood of the principal peaks. This result supports the use of the PSP data for frequency-resolved analysis of tonal structures and for correlation with the far-field microphone signal. In a previous calibration study of the same PSP formulation (Wei et al. Reference Wei, Zhang, Fan, Wang, Peng and Liu2024), the frequency-dependent attenuation was independently characterised, and the fitted attenuation curve was obtained as ΔL(f) = 5.6×10⁻⁸ f 2 − 0.0016f − 0.17, where ΔL is the attenuation in dB. This fitted relation indicates substantial attenuation over the upper part of the frequency range considered here, while the dominant peak locations remain well preserved over the frequency range of interest. At f = 7600 Hz, the fitted attenuation is approximately −8.7 dB. Using the conventional definition of cutoff frequency as the frequency at which the gain attenuation reaches −3 dB, the fitted response yields a practical −3 dB cutoff frequency of approximately 1.9 kHz. This cutoff characterises amplitude attenuation rather than the ability to identify dominant peak frequencies, which remain well preserved up to 7600 Hz in the present calibration and PSP–PCB comparisons. The slight underestimation of spectral amplitude by PSP at the upper end of figure 20 is therefore consistent with the independently calibrated frequency response of the paint system. At the same time, the close alignment of the dominant peak frequencies in figure 20 and the high coherence in figure 21(b) indicate that no appreciable phase-related inconsistency affects the interpretation of the dominant tones. Overall, the results confirm that the fast-response PSP provides dynamically reliable wall-pressure measurements for the high-speed DIJs considered here. In particular, the PSP reproduces the dominant tonal frequencies, captures the fluctuation amplitudes with acceptable r.m.s. error and maintains strong coherence with the in situ PCB sensors over the frequency range that governs the modal and aeroacoustic analyses in the main text.
Quantitative dynamic-validation metrics of PSP pressure fluctuations against dynamic sensors. (a) Relative error of the r.m.s. pressure fluctuations measured by PSP with respect to the dynamic sensors for circular and rectangular DIJs. (b) Frequency-dependent coherence between the PSP and PCB pressure signals at sensor 1.

Appendix B. Validation and comparison of SPOD and CS-SPOD
The SPOD formulation adopted in this work follows Towne et al. (Reference Towne, Schmidt and Colonius2018), while the CS-SPOD analysis is based on the framework developed by Heidt & Colonius (Reference Heidt and Colonius2024) for flows with periodically varying statistics. In this study, CS-SPOD is used as a complementary extension of SPOD to explicitly exploit the strong tonal modulation associated with the impingement feedback loop. This appendix provides a concise, data-driven validation of the suitability and consistency of CS-SPOD for the fast-PSP and far-field microphone datasets considered here.
We first examine whether the far-field pressure signal exhibits cyclostationary behaviour consistent with a well-defined cycle frequency. To this end, a cyclic spectral analysis of the far-field microphone data is performed using the cyclic coherence/cyclic spectral density (CCSD) framework. For a representative rectangular and circular DIJ cases at M = 1.2 and h/D = 3, the normalised CCSD
 $\tilde{\mathit{S}}(\mathit{\alpha })$
in figure 22 shows a clear ridge near the cycle frequency α = f
1 (green line). The peak for the circular nozzle occurs slightly below f
1, whereas that for the rectangular nozzle lies slightly above f
1. This indicates that the second-order statistics of the signal are periodically modulated at f
1, consistent with the feedback-loop interpretation in § 4.1, and justifies taking α
0 = f
1 as the cycle frequency in the CS-SPOD analysis.
Normalised cyclic spectral density of far-field pressure for circular and rectangular DIJs at M = 1.2, h/D = 3. The normalised CCSD
 $\tilde{\mathit{S}}(\mathit{\alpha })$
exhibits a pronounced ridge near the cycle frequency α = f
1 (green line) for both nozzle geometries, with the circular-nozzle peak occurring slightly below f
1 and the rectangular-nozzle peak slightly above f
1.

As a second check, we compare the eigenvalue spectra of SPOD and CS-SPOD at the dominant tonal set for both circular and rectangular DIJs. Figure 23 reports the cumulative fraction of modal energy resolved by the first J modes (here J ≤ 5) for SPOD and CS-SPOD. Consistent with the behaviour described by Heidt & Colonius (Reference Heidt and Colonius2024), the CS-SPOD curves lie above the SPOD curves, indicating that, for a given number of modes, CS-SPOD accounts for a larger portion of the total variance. This is expected because the cyclostationary formulation admits phase-dependent second-order statistics across the frequency set, whereas classical SPOD assumes stationarity and cannot represent this phase-conditioned part of the covariance, regardless of how many modes are retained. As a consequence, CS-SPOD can collect energy associated with periodically modulated structures that SPOD tends to distribute over several modes. Overall, the CCSD evidence and the cumulative-energy comparison confirm that the present impinging-jet data possess a cyclostationary component tied to the feedback tone, and that CS-SPOD provides a suitable and internally consistent extension of SPOD for analysing the associated wall-pressure modes in this study.
Cumulative modal energy captured by SPOD and CS-SPOD at the dominant tonal set. Cumulative fraction of total energy resolved by the first J modes for circular and rectangular DIJs. Grey symbols denote SPOD and red symbols CS-SPOD. The CS-SPOD captures a larger fraction of the variance for a given J, consistent with its ability to represent phase-dependent second-order statistics across the frequency set.

Finally, we compare the leading SPOD and CS-SPOD modes on the impingement plate. Figure 24 presents the real part of the first SPOD mode and the corresponding CS-SPOD mode for the dominant tonal set of both rectangular and circular DIJs. In all cases, the resulting mode shapes are nearly indistinguishable; minor discrepancies can occur when the separation between the leading eigenvalues is weak, reflecting limited statistical convergence. Both approaches recover essentially identical spatial footprints, including the quadrupole-like organisation associated with the St = 0.42 tonal peak in the rectangular configuration. This close correspondence confirms that CS-SPOD constitutes a consistent extension of conventional SPOD for the present data. It preserves the dominant plate-pressure structures while reorganising them in a frequency-set- and phase-aware framework that is better suited to the strongly cyclostationary response of rectangular DIJs.
Real part of the first SPOD mode (left) and the corresponding CS-SPOD mode (right) for (a) rectangular and (b) circular DIJs at the dominant tonal set.

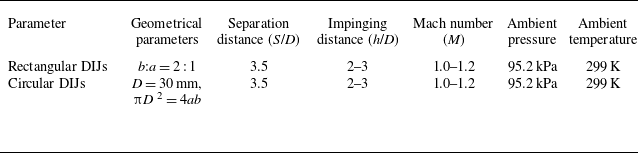
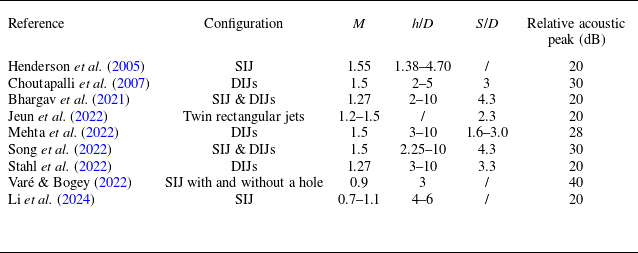



 Θ
 Θ


 Ω

 Ω


 Ω


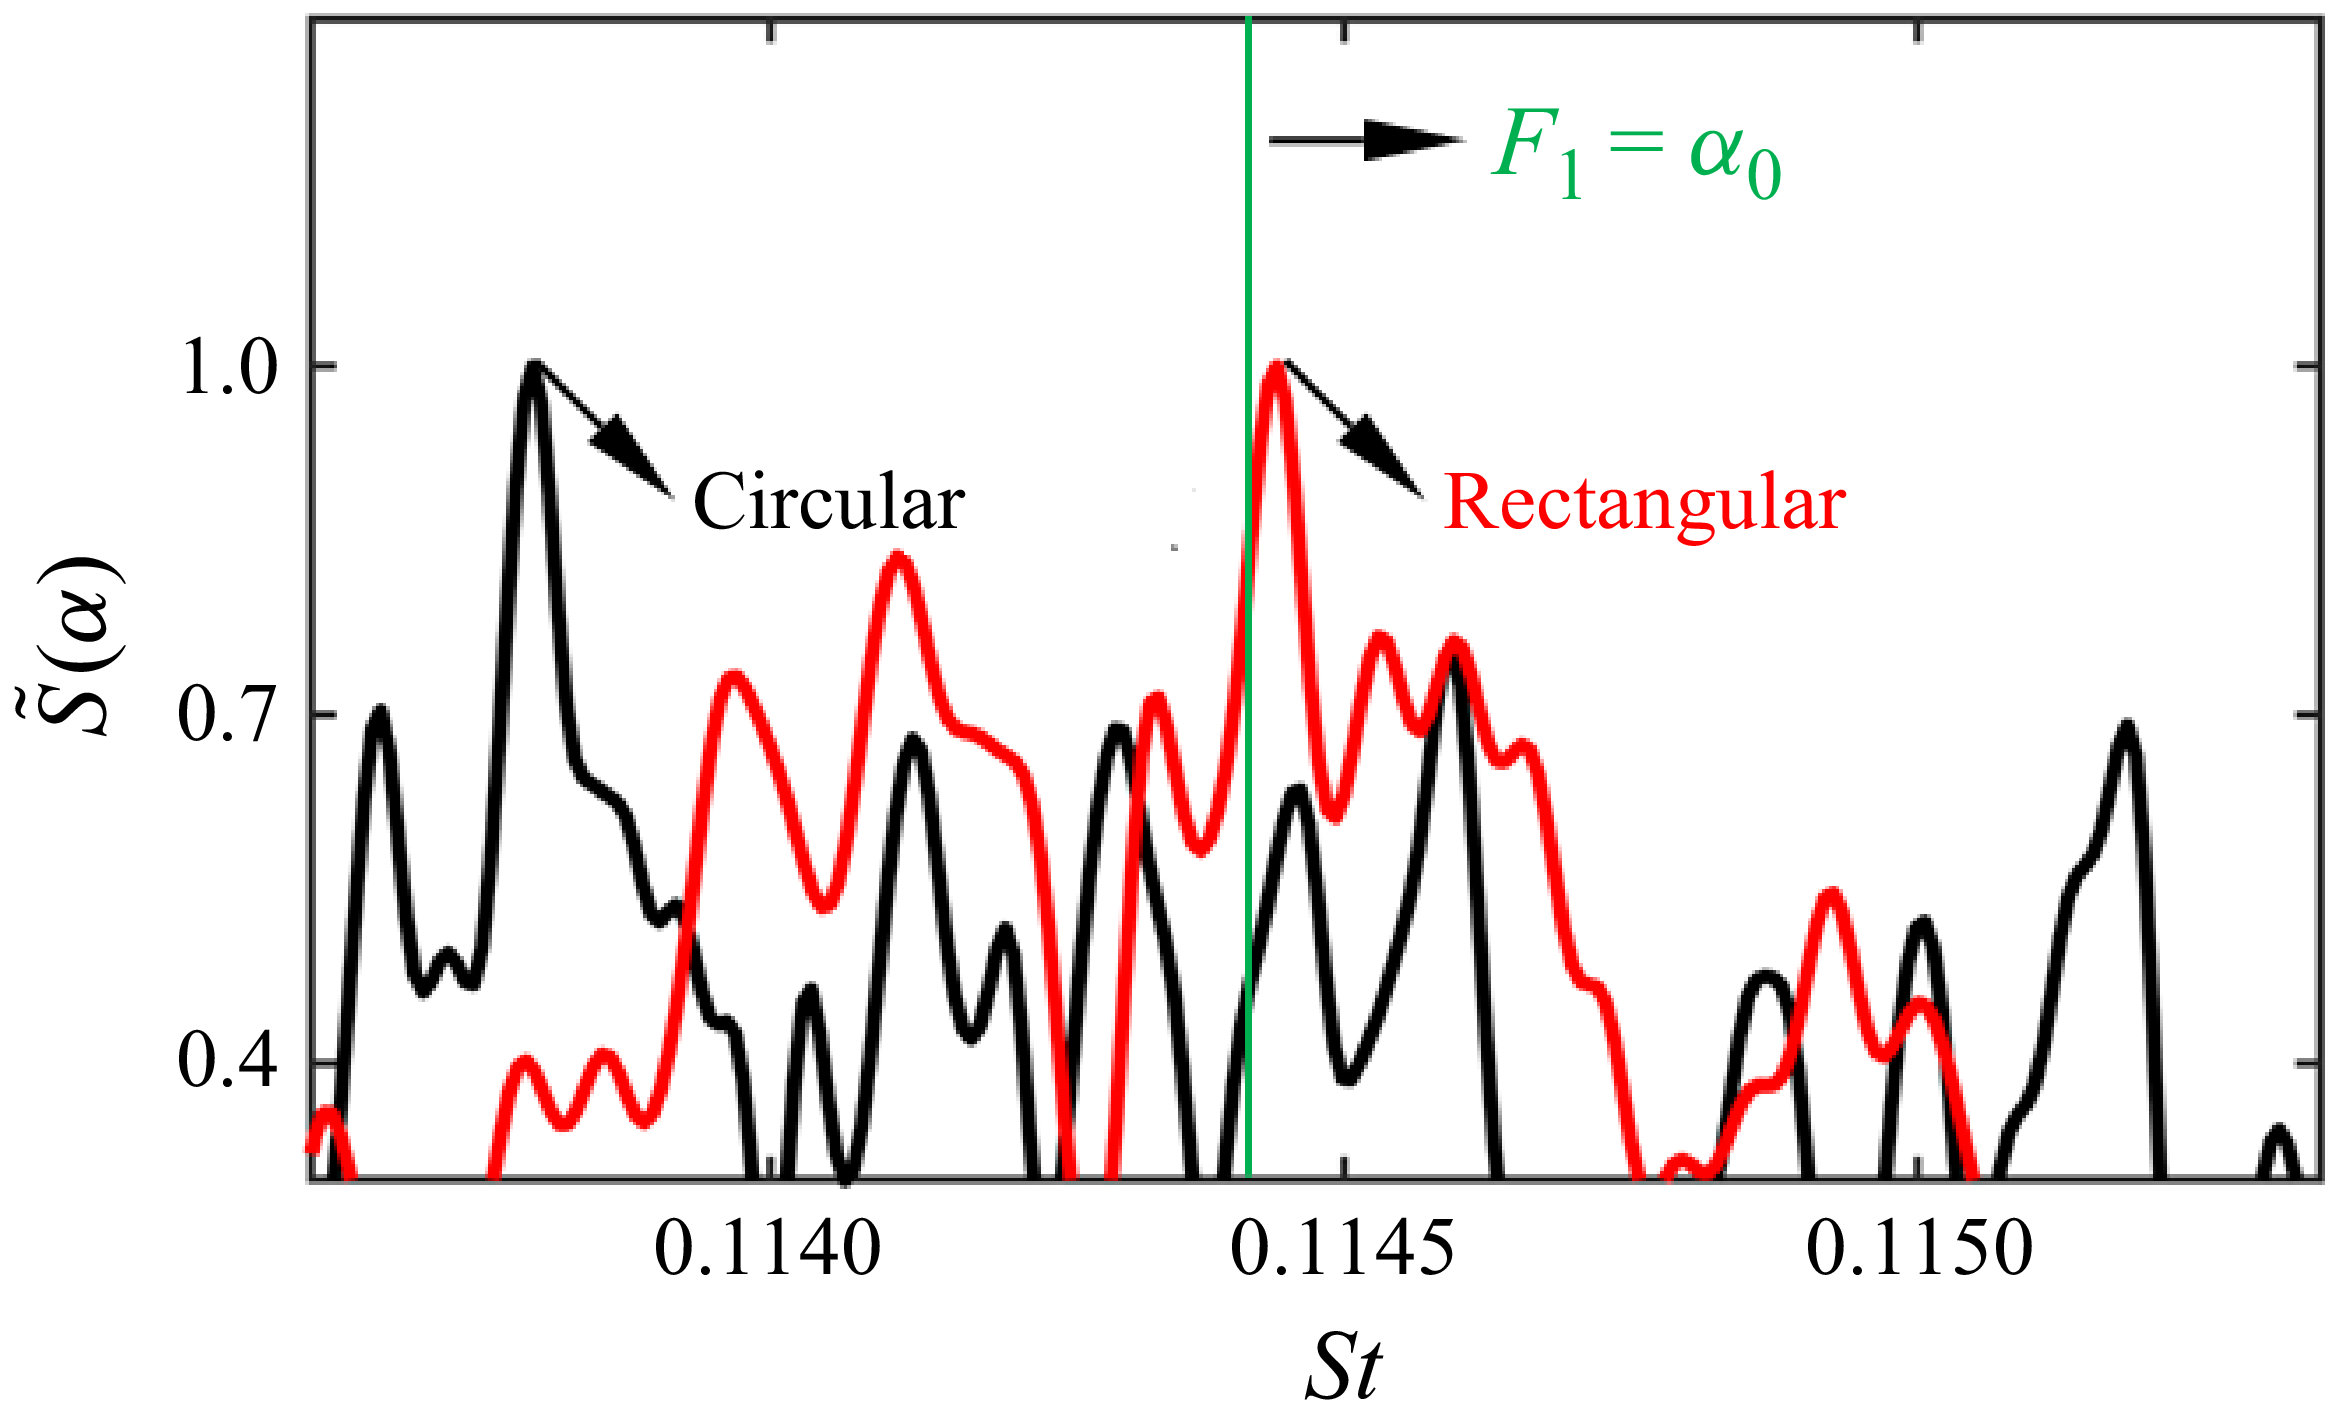
 S~(α)