
I. INTRODUCTION
In recent years there has been much commercial interest in the development of polymer blends from large volume commodity plastics. Polyolefin blends have been studied to improve the processability and properties such as mechanical properties, heat stability and permeability, or gas-barrier of the homopolymers involved. Permeability of gas through polymer blends has been the subject of numerous investigations. Reference Lee, Kim, Lim, Lee, Jo and Ougizawa1–Reference Drzal, Halasa and Kofinas5 Gas separation membranes prepared by blending are of great interest because a useful combination of the advantage of each polymer into a new product can be achieved and a continuous range of performance can be expected by controlling blend composition, the microstructure and the macrostructure. The ability to control the type of microstructure, the degree of molecules orientation, and porosity in blends of semicrystalline polymers is essential for the development of polymeric materials whose gas permeability can be controlled through changes in membrane processing conditions. Physical properties of polymer blends mostly depend on the degree of crystallinity and on the orientation distribution of the crystalline volume portion. Reference Lima, Vasconcellos and Samios6–Reference Piorkowska8 Preferred molecular orientation is one of the advantageous results of the plastic deformation of polymeric materials. Reference Machado, Denardin, Kinast, Goncalves, de Luca, Teixeira and Samios9–Reference Sprague13 Plastic deformation of crystalline and amorphous phases in most semicrystalline polymers is often accompanied by the cavitation. Reference Sprague13–Reference Pawlak, Galeski and Rozanski17 A cavitation phenomenon, meaning the formation of numerous voids (cavities), happens in many semicrystalline polymers deformed at temperatures above their glass transition. Reference Pawlak, Galeski and Rozanski17–Reference Chen, Lu, Zhao, Jiang and Men19 It is known that cavities develop when a polymer is stretched (uniaxially or biaxially) and that the local three-dimensional tensile stress is necessary for voiding. Reference Sprague13–Reference Pawlak, Galeski and Rozanski17 Many studies have been carried out to explain the mechanism of plastic deformation of semicrystalline polymers considering complex hierarchical architecture of such materials, voiding, lamellae fragmentation, crystallographic slips, and intensive deformation of amorphous phase. Reference Lin and Argon12,Reference Pawlak, Galeski and Rozanski17–Reference Tsai and Torkelson22,Reference Michler and von Schmeling34–Reference Wang, Jiang, Fu, Lu and Men38
Some type of semicrystalline polymers, which displayed chain relaxation in the crystalline phase (i.e., an αc relaxation) and row-nucleated morphology, have been found as a good precursors for preparation of porous membranes via the stretching process, which includes isotactic polypropylene (IPP), polyethylene (HDPE), polyoxymethylene (POM), poly(4-methyl-1-pentene) (PMP), poly(vinylidene fluoride) (PVDF). Reference Lee, Park and Song23–Reference Xu, Johnson and Wilkes27 To fabricate such microporous materials followed by stretching process, a number of methods have been proposed. Reference Mizutani, Nakamura, Kanako and Okamura28–Reference Lopatin, Yen and Rogers30 Among these methods most interesting are the swelling of a semicrystalline material followed by a later stretching and removal of the swelling solvent, Reference Soehngen and Ostrander31 stretching (uniaxially and/or biaxially) of a polymer matrix containing particles of the filler that have poor adhesion to the matrix, which leads to cavitation of the matrix upon deformation Reference Lee, Macosko and Bates32–Reference Michler and von Schmeling34 and three-stage methods, which includes the MEAUS method. Reference Lee, Park and Song23,Reference Dmitriev, Bukošek, Lavrentyev and Elyashevich26,Reference Johnson and Wilkes35,Reference Johnson and Wilkes36 In MEAUS method deformation of lamellae and appearance of voids in semicrystalline polymers initiate the formation of microporous systems in the process based on the extrusion-annealing-extension. This method was mainly applied to PMP and POM. Reference Johnson and Wilkes35,Reference Johnson and Wilkes36
In this work, we investigate the structural and porosity properties of mixture of two semicrystalline polymers: LDPE and PMP. These two blend components are immiscible on the molecular level, however preliminary experiments showed that good dispersion of the minor component in the blend (i.e., inclusion size in the micrometer range) could be expected only if the content of PMP is limited to 15%. These blends can be easily used for preparation of films in which the formation of voids near inclusions can be expected after stretching, so they are potentially interested as materials with enhanced permeability for liquids or gases.
The main aim of this study is characterization of LDPE/PMP polymer films as precursors for production of porous polymeric materials. MEAUS, MEUS, and MEUBS processes were used to modify the relationship of microphase separated lamellar populations and produce orientation textures applicable for the construction of porous materials.
The permeability and overall porosity results coupled with small-angle x-ray scattering (SAXS) data and infrared spectroscopy (FTIR) provide a direct connection between changes in microstructure and observed changes in the gas transport properties.
II. EXPERIMENTAL SECTION
A. Materials
Table I provides some fundamental properties of polymers used in this study. The LDPE (MALEN E FABS 23-D022, Sabic, Riyadh, Saudi Arabia) and two types of the poly(4-methyl pentene-1) (PMP): TPX DX 560M and TPX DX 820 (supplied by Mitsui Chemicals, Inc., Tokyo, Japan) were used for the preparation of polymer blends and porous films.
Characteristics of the materials (obtained from manufacturers).

B. Methods
1. Blending and production of precursor polymer films
a. Twin-screw compounding
LDPE/PMP blends were prepared using a double co-rotating twin-screw extruder Leistritz Micro 27 (Leistritz Pumpen GmbH, Nuernberg, Germany). The length of extruder screw is 1188 mm with an L/D ratio of 44. The process parameters for all the mixtures were the same: feeding section: 220 °C, plasticizing section: 230–240 °C, dosing section: 235–240 °C, screw rotations: 500 rpm, the pressure in front of the head: 20–25 bar, process efficiency: 20–30 kg/h.
For each type of PMP, three different LDPE/PMP compositions with concentration ratios of 95:5, 90:10, and 85:15 (by weight) were prepared. In the next stage, these blends were used to prepare precursor polymer films by tubular film processing.
b. Tubular film processing
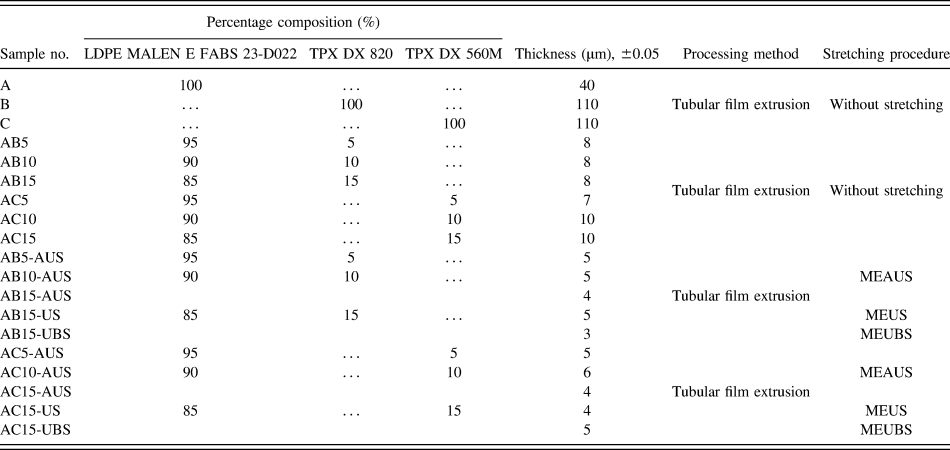
All the tubular film samples were made on a laboratory scale tubular film processing line type WFW 30-28 F made by K&K Plast company: extruder with a 40 mm annular die, a die gap of 0.4 mm, and a single screw with a 30 mm diameter (aspect ratio, L/D = 28). The blow-up ratio was maintained at unity, thereby promoting only planar extensional flow with the deformation direction along the machine direction (MD). This leads to the expected result of uniaxial symmetry about the MD. The extruded melt was quenched with an air-ring system using ambient air at about 25 °C. Five main processing parameters were used: extruder barrel temperature, which was in region 130–245 °C; extrusion speed of the screw in revolutions per minute was between 10 and 25 rpm; quench height was 60 mm, the distance from the die exit to the cooling ring 30 mm; and the line speed in meters per minute 2–6 mpm. Compositions of PE/PMP blends, process for the preparation of films and film thickness are summarized in Table II.
Relevant characteristics of the precursor films for producing microporous films.

MEAUS—three-stage process (melt-extrusion/annealing/uniaxial-stretching), MEUS—two-stage process (melt-extrusion/uniaxial-stretching), MEUBS—two-stage process (melt-extrusion/uniaxial and biaxial stretching) for producing microporous.
AUS—annealing/uniaxial-stretching, US—uniaxial-stretching, BS—biaxial-stretching.
2. Preparation of micro/nanoporous films
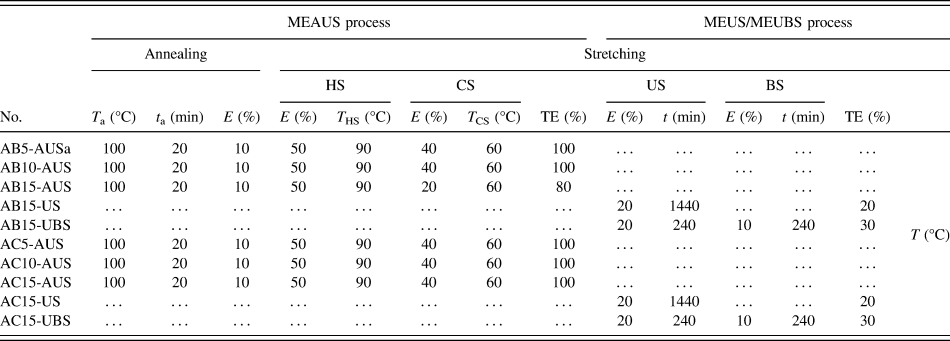
Three methods [MEAUS, MEUS, melt-extrusion/biaxial stretching (MEUBS)] utilizing stretching have been applied to initial films (precursors) to produce the porous polymeric materials. We assumed that the deformation mechanism can proceed for these films via two pathways. The first is brittle fracture occurring under high loading rates at lower temperatures (MEUS and MEUBS process), and the second is ductile drawing after plastic deformation. The second deformation type occurs under lower rates of drawing and higher temperature (MEAUS process). All parameters of MEAUS, MEUS, and MEUBS processes are presented in Table III and other details of these processes are described below.
Process parameters of producing microporous polymer films.

E—percentage extension; CS, HS—cold and hot stretching; US, BS—uniaxial and biaxial stretching. TE—total extension.
MEAUS process: In this process, the initial step is the melt-extrusion of the polymer into a precursor, followed by annealing and subsequently uniaxial stretching along the MD of the film.
MEUS and MEUBS process: During these processes the annealing step has been skipped and the stretching has been carried out at the room temperature. Films were uniaxially and biaxially stretched i.e., first along and then perpendicular to the MD, respectively.
a. Annealing
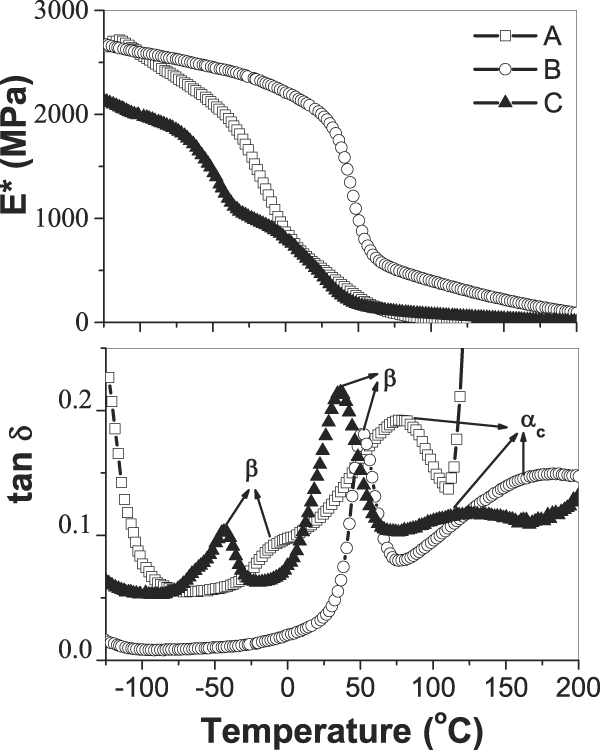
Annealing temperatures were selected based on dynamic mechanical thermal analysis (DMTA) study, upon the range of temperatures encompassing the PMP and LDPE mechanical αc relaxation, as expressed by tan δ (Fig. 1). From this analysis, the annealing temperature equal to 100 °C was selected for PMP/LDPE films. The annealing time used was 20 min. The tension level was 10%. All parameters of MEAUS and MEUBS process are presented in Table III. The final value of the annealing time and tension level have been chosen based on results of our earlier studies for different annealing times and also based on results obtained for PMP polymer by other researchers. Reference Dmitriev, Bukošek, Lavrentyev and Elyashevich26,Reference Lee, Macosko and Bates32,Reference Michler and von Schmeling34–Reference Johnson and Wilkes36
Temperature dependence of E* (top layer) and tan δ (bottom) for LDPE and PMP polymers using a heating rate 2 °C/min, a frequency of 10.0 Hz, and a static initial strain 0.3%. Symbols: (-□-)—A, (-○-)—B, and (-▲-)—C.

b. Stretching
This stage for MEAUS process was composed of two stretching steps followed by a thermal-relaxation/heat-setting step. First step is designated the “cold” stretch (CS), while the second is the “hot” stretch (HS). The cold-stretch temperature (T cs) generally occurs above the polymer T g but below the hot-stretch temperature (T hs), which itself is below the annealing temperature of the prior stage but still in the upper temperature range of the αc relaxation for a given polymer. The extension levels utilized for investigated samples are listed in Table III. The stretching process for both HS and CS cases was carried out along the MD using the Instron strength testing machine with elongation head and extensometer. The uniaxial (US) and the biaxial (BS) stretching to the MD in the MEUBS process also was carried out using the same testing machine.
3. Polymer films characterization
a. Differential scanning calorimetry (DSC)
DSC measurements were performed with a Mettler Toledo TGA/DSC 1 (Mettler-Toledo AB, Stockholm, Sweden). Sample weight was about 5 mg, and the heating rate was 10 °C/min. Sample were closed in light aluminum pans (20 µm) and heated from 30 °C to 270 °C, held at that temperature for 2 min, than cooled to 30 °C (cooling rate was 10 °C/min). Samples were then reheated to 270 °C and followed by a second crystallization. All DSC scans were performed under N2 atmosphere. A nitrogen flow (50 mL/min) was maintained throughout the test. Baseline corrections were also done with the supplied software. Instrument calibration was done with indium and tin samples at the same heating rate of 10 °C/min.
The mass fraction of crystallinity using DSC was calculated from the following mass fraction relationship Reference Menczel and Prime39,Reference Al-Rawajfeha, Al-Salahb and Al-Rhaelc40 :
 $${X_{\rm{c}}} = {{\Delta {H_{\rm{f}}}} \mathord{\left/ {\vphantom {{\Delta {H_{\rm{f}}}} {\left( {{w_{\rm{c}}}\Delta H{^\circ _{\rm{f}}}} \right)}}} \right. \kern-\nulldelimiterspace} {\left( {{w_{\rm{c}}}\Delta H{^\circ _{\rm{f}}}} \right)}} \times 100\% \quad ,$$
where ΔH f is the measured heat of fusion/gram from the area under the melting endotherm, ΔH°f is the enthalpy of fusion/gram for a 100% crystalline sample and w c is the mass fraction homopolymer component of the mixture. In the case of iPMP, there have been several reported values for ΔH°f ranging from 61.9 to 118.9 J/g. Reference Johnson and Wilkes35,Reference Charlet and Delmas41 The value of ΔH°f 61.9 J/g Reference Johnson and Wilkes35,Reference Charlet and Delmas41 was chosen and used here for calculating the level of crystallinity. The value of ΔH°f for LDPE at 100% crystallinity is 293.6 J/g in the literature studies. Reference Menczel and Prime39,Reference Kim, Kobayashi, Rahim, Zhang, Khusainova, Hillmyer, Abdala and Macosko42
b. Dynamic mechanical thermal analysis
The DMTA for neat polymers (LDPE, TPX DX560M, TPX DX 820) was carried out using Eplexor 500 N of Gabo Qualimeter device (Gabo, Munich, Germany). The samples were tested in tensile mode. Complex elastic modulus, E*, and loss tangent, tan δ were measured at frequency of 10 Hz, in the temperature range from 120 °C to 200 °C, at a heating rate of 2 °C/min−1. The applied static initial strain was 0.3% and dynamic strain amplitude was equal to ±0.1%. For polymeric materials a drop in storage modulus and a peak in tan δ are used as indicators of a glass transition.
c. Small-angle x-ray scattering
The presence of nanocavities in polymeric films was determined by SAXS. It is known that if some objects having electron density ρ are embedded in medium characterized by electron density ρo then the intensity of scattering I is proportional to (ρ − ρo)2. Reference Glatter and Kratky43 It means that scattering from the system: crystalline phase of polymer-amorphous phase of polymer is ordered and less intensive than scattering on the void-polymer system. The electron density of void is zero and density of polymer is taken here as a medium value between these for crystalline and amorphous phases. Usually a large increase (10 times and more) of scattering intensity is the clear evidence of cavitation.
A 1.2 m long Kiessig-type SAXS camera was coupled to a GeniX Xenocs X-ray system (Xenocs, Sassenage, France; Cu Kα, wave length 0.154 nm, operating at 50 kV and 1 mA). The scattered radiation was recorded by Pilatus 100K detector (Dectris Ltd., Baden-Daettwil, Switzerland). Because the examined samples were 4–15 µm thick films so for obtaining reasonable intensities of x-ray scattering these films were 8 or 16 times folded before fixing in experimental setup. Time of acquisition was 500 s. Our SAXS system allowed for resolution of scattering objects up to 60 nm.
d. Infrared spectroscopy (FTIR)
The experimental IR spectra were collected using a Fourier transform spectrometer, Bio-Rad FT-IR 6000 (Bio-Rad Laboratories GmbH, Munich, Germany) equipped with deuterated triglycine sulfate (DTGS) detector and KBr beamsplitter. The polarized spectra were recorded using a step-motor-driven ZnSe polarizer. Spectra were measured as a function of the polarizer angle (ω) with respect to the stretching direction (MD direction) in the range 600–4000 cm−1, with a resolution of 1 cm−1. Analysis of the absorbance profile A∼ω for fundamental bands enables us to obtain information about the orientation of the vibrational dipole moment, which corresponds to the particular mode. For aligned sample, it is shown that the orientation of the maximal absorbance coincides well with the direction of the alignment axis. To determine the direction of vibrational dipole moment, the dichroic ratio was calculated:
 $$R = {{{A_{{\rm{II}}}}} \mathord{\left/ {\vphantom {{{A_{{\rm{II}}}}} {{A_ \bot }}}} \right. \kern-\nulldelimiterspace} {{A_ \bot }}}\quad ,$$
where A II = A (ω = 0°) is the absorbance for the linearly polarized light parallel to the chain axis and A ⊥ = A (ω = 90°) is the absorbance for the linearly polarized light perpendicular to the chain axis. This ratio can change from zero to infinity. For an unoriented polymer, no dichroism occurs and also the ratio is equal to 1.
e. Atomic force microscopy (AFM)
A NanoWizard®3 BioScience atomic force microscope (AFM; JPK Instruments AG, Berlin, Germany) combined with a Zeiss Axio Observer (Carl Zeiss AG,Jena, Germany) inverted optical microscope was utilized for all AFM measurements. All experiments were performed in air using the intermittent contact mode (AC mode) with the Z range set to 15 µm and a scan rate of 0.5–1 Hz. The topography and phase images of selected areas were carried out using the Tapping Mode NSC15/AL BS etched silicon probes with a resonance frequency 265–410 kHz (MikroMasch, Portland, Oregon).
f. Scanning electron microscopy (SEM)
Morphologies of the polymer films were examined by using analytical scanning electron microscope JSM 6010LA (SEM; JEOL Ltd., Tokyo, Japan). Films for studies were sputtered with gold and examined in a high vacuum mode.
g. Water vapor permeability
Water vapor transmission rate measurements were performed using a Lyssy L80-5000 tester (PBI-Dansensor, Ringsted, Denmark) following PN-EN ISO standard 15106-1:2007. Tests were performed at 37.9 ± 0.1 °C and at atmosphere pressure. The relative humidity was set to 98% in the wet chamber to avoid condensation and 10% in the dry chamber. Calibration was performed with a 19 μm polyethylene terephthalate (PET) film.
III. RESULTS AND DISCUSSION
A. Relaxation studies
Figure. 1 shows values of the complex elastic modulus, E*, and damping factor, tan δ, versus temperature at 10 Hz for neat polymers (LDPE, TPX DX560M, TPX DX 820). From the correlation of tan δ versus temperature, three distinguished peaks can be observed. Within the temperature range from −50 to 50 °C, tan δ exhibits sharp maximum, which can be identified as the β relaxation, occurring at a characteristic temperature T
β. This transition has been associated to various molecular mechanisms: diffusion movements of amorphous chain segments containing branch points, segmental motions occurring within the amorphous-crystal interfacial regions, and cooperative motions of the amorphous phase. It is known that the location and height of the β relaxation clearly depends on branching content. The maximum in tan δ shifts to higher temperatures and the intensity decreases as the branching content decreases, i.e., as the fraction of amorphous phase decreases. For LDPE film (sample A) β relaxation occurs at around −7 °C degree. The TPX DX560M polymer (sample C) exhibits two peaks in the region of β relaxation. The first peak occurs at a lower temperature (T
β = −50 °C) and can attest to the presence of some additive having similar branching content like LDPE. The second peak occurs at around 25 °C. For TPX DX 820 (sample B) β relaxation occurs at around 50 °C degree (Fig. 1). All neat materials possess the αc relaxation understood as ability for crystalline mobility. The peak of the αc mechanical relaxation distribution is termed
 ${T_{{\alpha _{\rm{c}}}}}$
. The αc relaxation is associated with main chain translational mobility of nonchemical defects along the polymer chain backbone in the crystalline lattice. From Fig. 1, it can be observed that the PMP mechanical αc relaxation is relatively large in magnitude. As Fig. 1 shows the onset of the αc relaxation for sample C occurs at approximately 80 °C reaching a maximum (i.e.,
 ${T_{{\alpha _{\rm{c}}}}}$
) at 120 °C and continues up until melting of the crystalline phase around 222 °C. The onset of the αc relaxation for sample B occurs at approximately 90 °C reaching a maximum (i.e.,
 ${T_{{\alpha _{\rm{c}}}}}$
), around 160 °C and continues up until melting of the crystalline phase around 236 °C. According to the LDPE (sample A), the αc relaxation starts at around 25 °C reaching a maximum (i.e.,
 ${T_{{\alpha _{\rm{c}}}}}$
), around 90 °C.
B. Structural and morphology analysis
1. DSC results
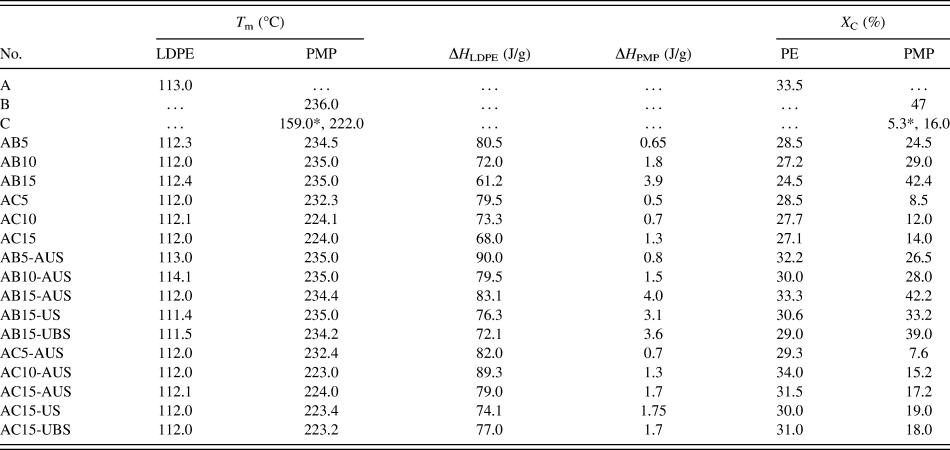
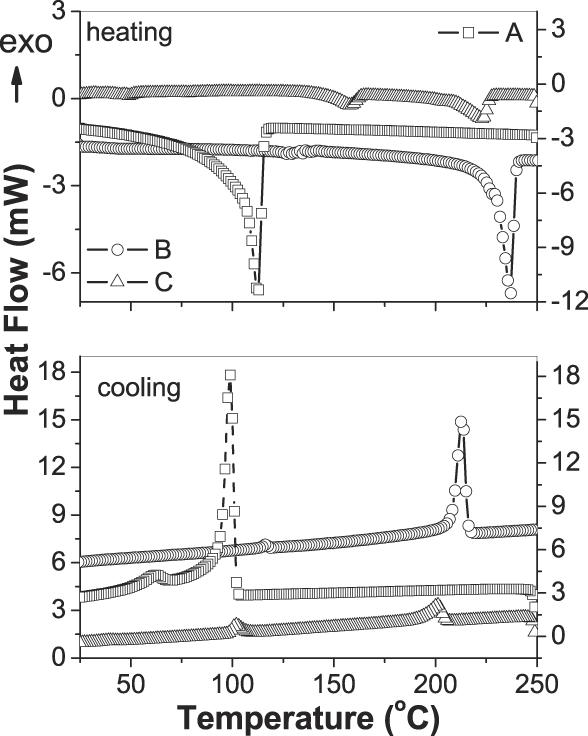
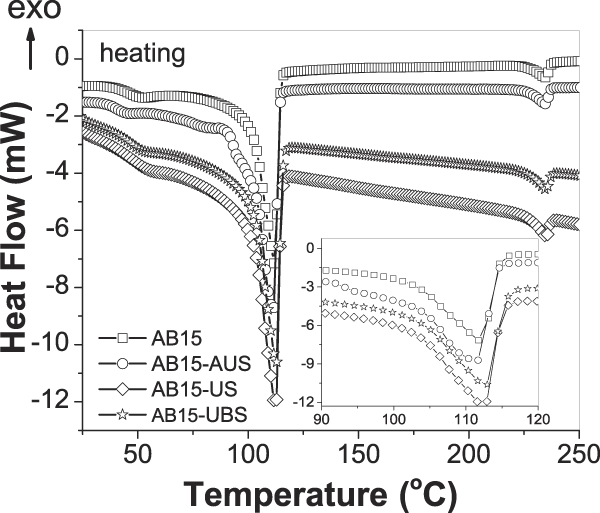
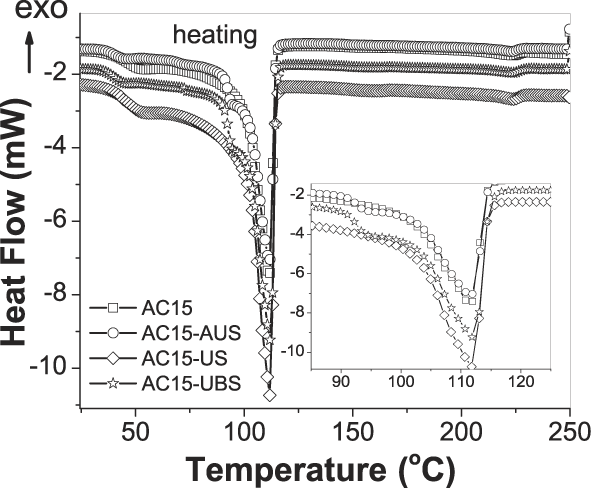
The crystallinity was determined by calculating the area under the melting endotherm using Eq. (1). The melting temperature (T m), the enthalpy of polymers (ΔH) and crystallinity (X c) are summarized in Table IV. Figure 2 shows the DSC scan of the first heating and cooling of precursor films. DSC analysis of LDPE (sample A) showed that the melting peak occurred at about 113 °C and the crystallinity was X c = 33.5%. There were observed differences in the melting temperature and crystallinity between two types of the poly(4-methyl pentene-1): TPX DX 820 (sample B) and TPX DX 560M (sample C). The polymer B is characterized by higher melt temperature T m = 236 °C (Fig. 2) and higher crystallinity X c = 47% when compared with polymer C. DSC scan for polymer C showed two melting peaks. The first melting peak T m1 = 159 °C results from the presence of an additive such as polyethylene and the second melting peak (at 222 °C) is characteristic for pure polymer C. The degree of crystallinity of sample C was 16% and it is much lower than that of sample B. Figures 3 and 4 show the DSC first heating scans for the AB15 and AC15 films, respectively. The calculated degree of crystallinity for polymer A in mixtures with a 15% of the PMP content (B or C polymer) is approximately 20% lower than that for pure polyethylene. While, the crystallinity degree of the PMP with a 15% content in mixtures is less than 10% for polymer B and about 12% for polymer C.
Thermal properties of DSC for all investigated films.

T m—melting point, Xc—crystallinity, ΔH—the measured heat of fusion/gram.
*—it refers to the T m an X C of LDPE as an additive in a C polymer (TPX DX 560 M).
DSC scans of the first heating (top layer) and first cooling (bottom) of precursor LDPE and PMP films using a heating rate of 10 °C/min. Symbols: (-□-)—A, (-○-)—B, and (-△-)—C.

Comparison of DSC first heating scans for the AB films with 15% of PMP content (TPX DX 820). Symbols: (-□-)—AB15, (-○-)—AB15-AUS, (-◊-)—AB15-US, and (-☆-)—AB15-UBS.

Comparison of DSC first heating scans for the AC films with 15% of PMP content (TPX DX 560M). Symbols: (-□-)—AC15, (-○-)—AC15-AUS, (-◊-)—AC15-US, and (-☆-)—AC15-UBS.

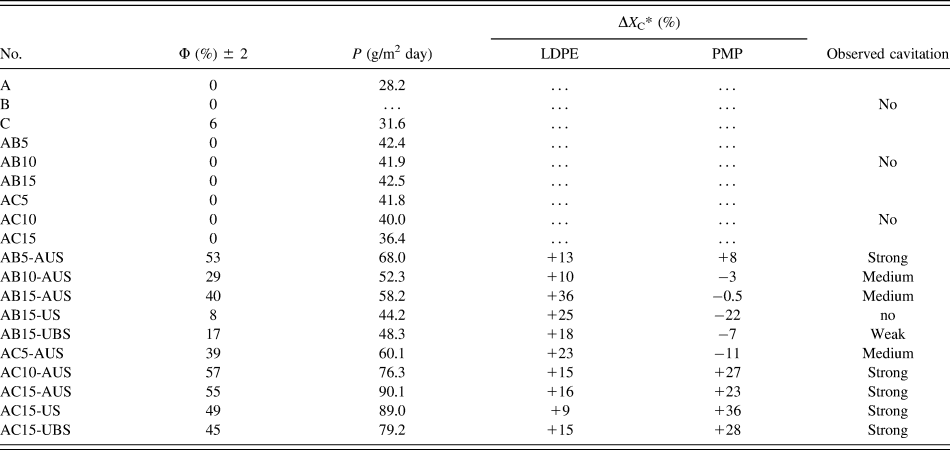
To better illustrate the changes taking place in the organization of molecules through the annealing and the uniaxial or biaxial stretching process, the percentage changes in the degree of crystallinity were determined in relation to the starting mixtures. Table V provides a comparison of changes in the degree of the crystallinity, ΔX c, with the detection of cavities from the SAXS measurements (discussed in detail below) and with the overall porosity and water vapor permeability of the films. For all of AB mixtures after modifications the increase of the crystallinity degree in the range from 10 to 40% for polymer A was observed but in case of polymer B mostly the drop of the X c was detected. The strong cavitation was observed only in case of AB5-AUS sample in which the increase of the X c occurs simultaneously for both A and B polymers. The medium cavitation was observed in case AB10-AUS and AB15-AUS films, for which the crystallinity increases in the range of 10–40% for the A polymer and decreases to 3% for the B polymer. The weak cavitation was obtained for AB15-UBS film with the decrease in crystallinity of the B polymer more than 5%. No cavitation was observed for the AB15-US film with the decrease of the X c more than 20% for the B polymer.
Characteristics of the permeability (P), the overall porosity (Φ) and the changes in the degree of the crystallinity (ΔX C) of precursor films and after modifications.

Φ—overall porosity, P—speed of the permeation of steam.
*—percentage changes in the degree of crystallinity as a result of annealing and stretching process.
In contrast, all investigated AC films after annealing and stretching stages show the formation of cavities. However, the weakest effect was obtained for the AC5-AUS sample with the decrease of the X c about 10% for the C polymer.
Based on these studies, we can say that the process of annealing has a strong importance on the growth of crystallinity and changing the reorganization of the molecules and thus the cavities formation. Within the PMP polymer can be observed that the polymer C is more suited for the preparation of polymeric membrane.
2. SAXS results
Careful analysis of SAXS results, taking into account the thickness, gave a chance to correctly identify these materials where the scattering was only on the crystalline-amorphous structure and those which cavitate. The following criteria were taken together in the identification of cavities presence: total scattering of x-ray on the sample, maximum value of scattering intensity, thickness of the sample. If two samples with similar thickness were compared and it was observed that total intensity of x-ray scattering and the maximum intensity of the signal were significantly higher for one of these samples, it was interpreted as a scattering on nanometer voids, having size in range of 2–60 nm, i.e., in detecting range of SAXS.
Concentration of scattering near the central beam stop, observed in cavitating samples, suggests preferential formation of larger voids, with size of 20–60 nm. The results of examinations of our samples were classified in categories: without cavitation, weak, medium, or strong cavitation.
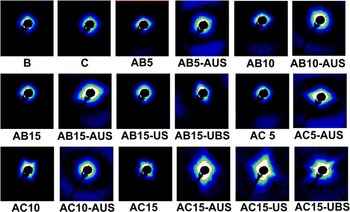
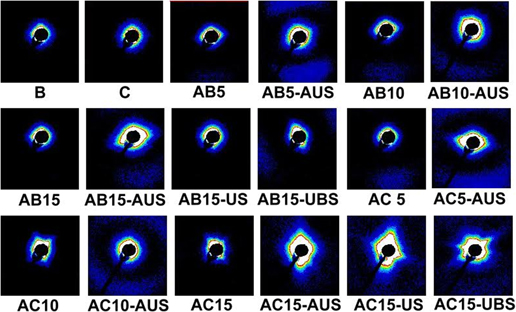
The exemplary SAXS patterns are presented in Fig. 5. Table V shows the result of observations of cavitation for all investigated films. Films prepared from pure LDPE and PMP (samples: A, B, C) did not show the cavitation and the intensity of scattering is low. Films of AB and AC polymer blends were uniform and before deformation did not contain nanometer sized cavities.
SAXS patterns recorded for LDPE/PMP films.

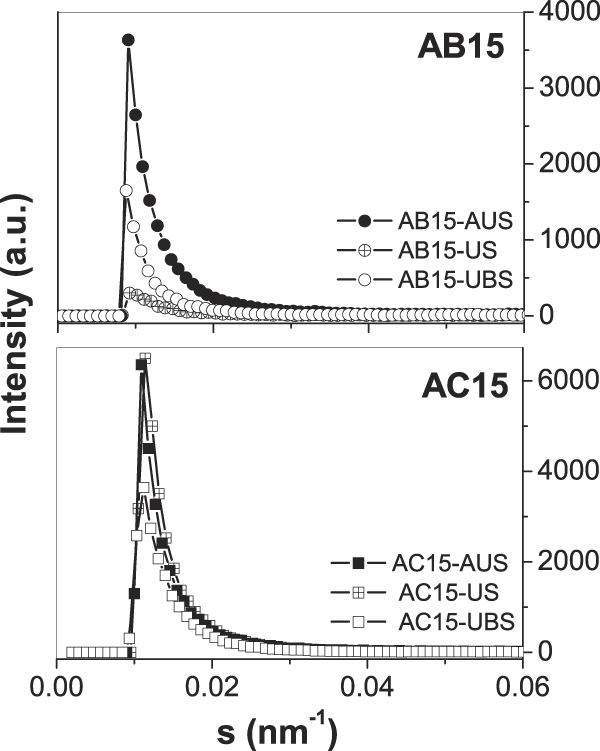
AB polymer films treated by MEAUS process showed medium and strong cavitations, which is clearly visible when we compared patterns of non-processed films with processed one (e.g., AB5 and AB5-AUS, AB10 and AB10-AUS, AB15 and AB15-AUS; see Fig. 5). However, the cavitation was not observed for the AB15-US sample after the cold uniaxial stretching, and very weak scattering on voids was observed for sample AB15-UBS after uniaxial and biaxial stretching at the room temperature. Figure 6 shows scattering intensity profiles for the selected patterns of AB15 and AC15 films from Fig. 5, taken in the directions of maximum intensities. The rapid increase of intensity in AB15-AUS sample to 3700 a.u. confirms strong cavitation. A weak cavitation inside AB15-UBS sample resulted in observed maximum on level of 1600 a.u. The scattering from noncavitating AB15-US has a maximum value of 200 a.u. only. In case of AC blends, voids were not present in initial films, but very strong cavitation was observed for all films after processing (MEAUS, MEUS and MEUBS). The strong cavitation in processed AC15 blends is confirmed by profiles in Fig. 6. Here the registered intensities had maximums between 3700 and 7000 a.u. The shape of scattering patterns is ellipsoidal for some processed films, for example AC5-AUS, AC15-AUS, which is evidence of elongation of voids due to orientation of voids. The process of voids orientation during deformation is well described in the literature studies. Reference Pawlak, Galeski and Rozanski17,Reference Chen, Lu, Zhao, Jiang and Men19,Reference Wang, Jiang, Fu, Lu and Men38
Intensity profiles for the selected patterns of AB15 and AC15 films from Fig. 5, taken in the directions of maximum intensities. Symbols: (-●-)—AB15-AUS, (-⌖-)—AB15-US, (-○-)—AB15-UBS, (-■-)—AC15-AUS, and (-○-)—AC15-US (-□-)—AB15-UBS.

The ability to perform cavitation of films from immiscible blends of LDPE depended on the dispersion of second component, because the size of the minor component inclusions strongly modifies the behavior of film during deformation. Also the adhesion of blend components is important. In the case of homopolymers, voids in amorphous phase are responsible for a strong scattering, but in polymer blends with dispersed one component, the scattering occurs also for unbound inclusions of second polymer. The compositions containing polymer B (TPX DX 820) are more sensitive on the used processing method than compositions with polymer C (TPX DX 560M). For better understanding of morphological differences, our samples were examined with microscopic methods. The expected nonmiscibility of blends components and formation of inclusions of minor component (TPX) was confirmed both by AFM and SEM observations.
3. Morphology
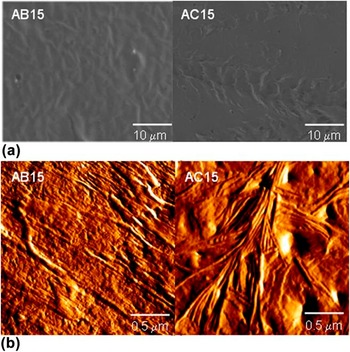
Surfaces of films were investigated by SEM and AFM and exemplary images are presented in Figs. 7 and 8. Figure 7(a) shows the scanning electron micrographs for LDPE/PMP precursor films with 15% content of minor component (AB15 and AC15). SEM micrographs shows that our films are in principle uniform, even the inclusions of PMP are present and visible. The analysis of nondeformed films reveals that the microsized voids are not present in them. Figure 7(b) shows the AFM amplitude images of morphologies after first stage, i.e., melt-extrusion for AB15 and AC15 precursors. As discussed in the literature studies, Reference Lee, Macosko and Bates32–Reference Mohr and Paul37 upon melt-extrusion, the resulting lamellar morphology has been observed to be influenced by the level of stress applied to the molten polymer during extrusion. More twisted row-nucleated morphology was observed for the AC precursor film.
Surface and structure of AB and AC precursor films with 15% of PMP content. (a) SEM micrographs (b) AFM phase images. Images are 2 × 2 μm.

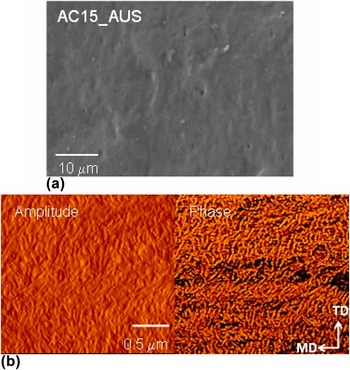
Surface and structure of AC15-AUS film after MEAUS process. (a) SEM micrograph and (b) AFM phase and amplitude images. Images are 2 × 2 μm.

For the stretched AB films, some voids were observed on micrographs; however, their number was very limited for films with 5% of the PMP content, so they are not important elements of deformed structure. The highest contents of microvoids were observed for films with higher PMP contents (i.e., 10–15%) after MEAUS and MEUBS processes, but they were irregularly distributed in the films. Films from blends of LDPE with second PMP, (AC films) show quite uniform structures, and before the deformation, similarly as previously discussed, cavities were not visible on micrographs. When the films were stretched, some microvoids were formed. Figure 8(a) shows an example the SEM micrograph of AC15-AUS sample. Figure 8(b) shows AFM phase and amplitude images of morphology after second stage i.e., annealing process with 10% tension of the AC15-AUS film. When uniaxial tension was applied during annealing, the morphology was the result of lamellar separation. This produced interlamellar voids on the order of nanometers in size parallel to the stretching, as viewed by AFM and similarly as it was detected by SAXS experiment.
C. Overall porosity and water vapor permeability
Table V presents the results of water vapor permeability in (g/m2 day) and the overall porosity Φ. After the area (A), the mass (W s), and the thickness (D) of all samples were measured, the volume of pores can be calculated by subtracting the volume occupied by polymer from the volume of the membrane sample. The volume of the sample (V s) equals to D × A and the volume occupied by polymer (V p) can be expressed as W s/ρ, where ρ is the density of polymer. Densities of polymers were presented in Table I, to calculate density for polymer blends weight ratio was used. Then, the overall porosity can be calculated by the following equation:
 $$\Phi = {{\left( {{V_{\rm{s}}} - {V_{\rm{p}}}} \right)} \mathord{\left/ {\vphantom {{\left( {{V_{\rm{s}}} - {V_{\rm{p}}}} \right)} {{V_{\rm{s}}}}}} \right. \kern-\nulldelimiterspace} {{V_{\rm{s}}}}} \times 100\% = \left( {D \times A - \left( {{{{W_{\rm{s}}}} \mathord{\left/ {\vphantom {{{W_{\rm{s}}}} {{\rho _{\rm{p}}}}}} \right. \kern-\nulldelimiterspace} {{\rho _{\rm{p}}}}}} \right)/\left( {D \times A} \right)} \right) \times 100\% \quad .$$
Results show that precursor films are quite dense and their calculated porosity is almost zero, except the pure polymer C, which shows slight porosity equal approximately 6%. The highest overall porosity obtained for samples after MEAUS process (i.e., AB5-AUS, AB15-AUS, AC10-AUS, AC15-AUS) possess highest overall porosity. The annealing process influences the lamellae orientation and makes cavitation during stretching more probable.
Table V also presents results of vapor permeation rate for tested samples. It can be observed that the water vapor permeability P is much higher for AC blends than for AB.
D. FTIR spectroscopy analysis
Vibrational analysis of oriented polymers provides a method of determining independently the molecular orientation both in crystalline and amorphous phases of polymers. Reference Koenig44,Reference Sung45 In addition, it can be used for the calculation of chain orientations for different polymers in a blend. Reference Lefebvre, Jasse and Monnerie46–Reference Vij, Kocot, Kruk, Wrzalik and Zentel48
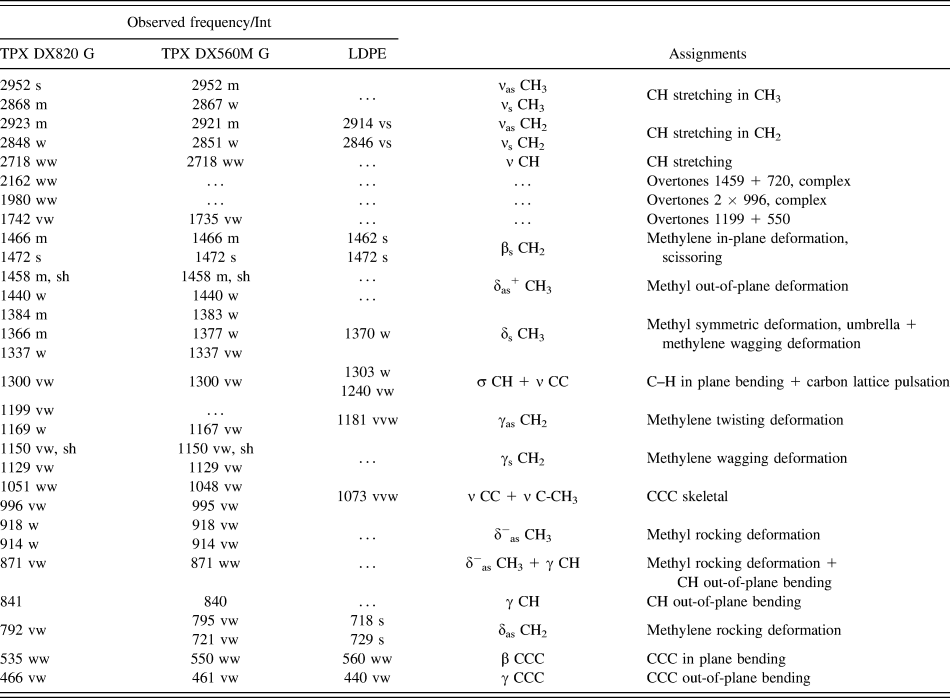
The observed frequencies of PMP and LDPE with their relative intensities and proposed assignments are summarized in Table VI. Assignments have been made on the basis of relative intensities, magnitude of frequencies, and mainly on the normal coordinate calculations as well as the literature data of polymers of similar structure. Reference Pouchert49–Reference Samuela and Mohan51 The dominant feature of the side chain is the presence of the -di-methyl group in each monomeric unit of PMP in the blends. Since there are methyl groups in the side chain and in principle if they see different potential fields then each give rise to slightly shifted asymmetric modes. The asymmetric stretching modes of the methyl group (CH3) are assigned to 2973 and 2954 cm−1 of IR spectra. The symmetric stretching modes of CH3 are assigned to very strong band at 2880 cm−1. The observed frequency at 1466 and 1458 cm−1 in the spectra has been assigned to the asymmetric degenerate deformation modes of the methyl groups. The rocking modes depend upon the environment of the CH3 group and they can be observed at 940 and 918 cm−1. The twisting modes of methyl groups are have been observed at very weak band 1158 and 1114 cm−1. The CH stretching of the methylene group (CH2) are highly localized and are generally observed in the frequency range 3000–2800 cm−1 in all polymers. The asymmetric deformation modes of CH2 groups have been observed at 1473 and 1458 cm−1. The CH2 wagging and twisting are assigned to 1232, 1213 cm−1 and strong bands of 1198, 1173 cm−1. The C–C stretching modes are assigned to 1102, 1063, 1054, 996, and 951 cm−1. The back bone and side chain attachment are known as mixed modes. These are generally dispersive in nature. The C–C in plane bending modes are assigned to 628, 550, 539 cm−1.
FTIR observed vibration wavenumbers, intensities and assignments for polymer precursors.

vs—very strong, s—strong, m—medium, w—weak, vw—very weak, ν—stretching, δ—deformation, β—in-plane bending, γ—out-of-plane bending, γs/γas—wagging/twisting deformation, δas—rocking deformation, δs—umbrella deformation, s/as—symmetric/asymmetric vibration.
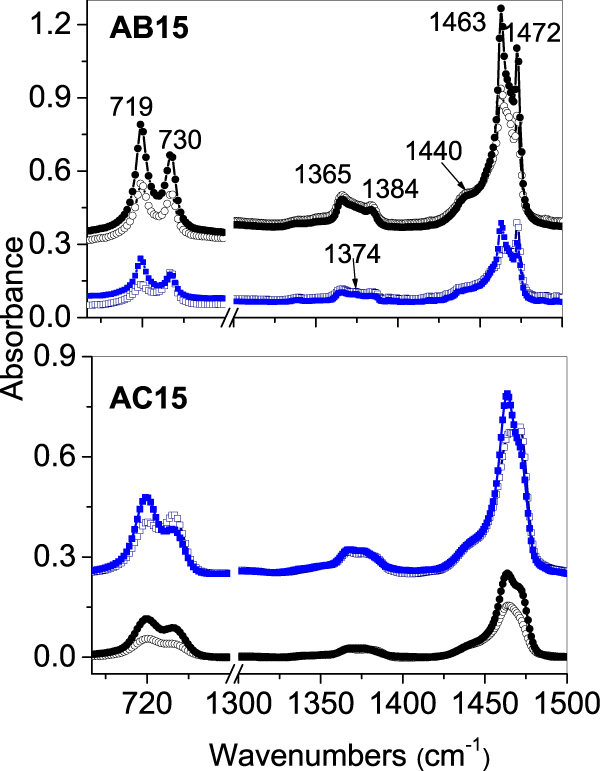
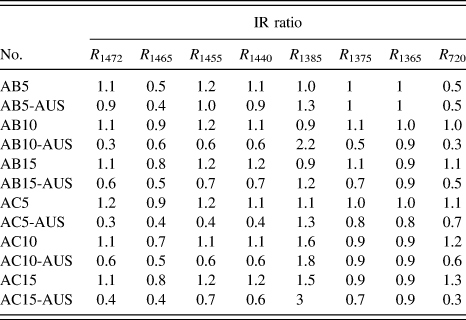
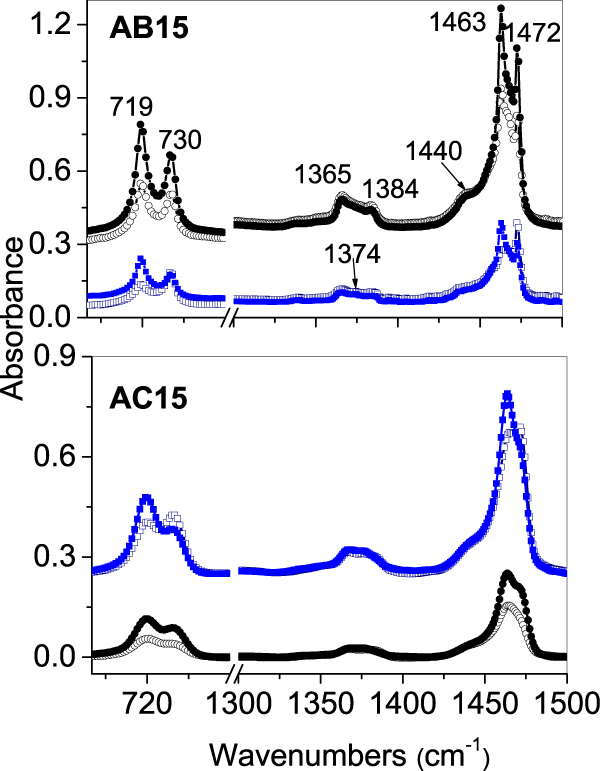
Polarized IR absorbencies have been measured for the films of precursor and for the stretched one. In a drawn polymer, the macromolecular chains are preferentially oriented in the direction of strain. Figure 9 shows parallel and particular spectra for AB15 and AC15 samples after modification using MEAUS process. Table VII contains the dichroic ratio calculated for selected bands. As expected all bands with the transition dipole moment either parallel or perpendicular to the long molecular axis show a relatively high dichroic ratio. In particular all bands with the transition dipole parallel to the long molecular axis have a maximal absorbance when the light vector is parallel to the stretching direction (MD direction), which was observed for asymmetric stretching vibration of CH3 group at 2950 cm−1, for carbon lattice pulsation bands at 1167 cm−1 and 1050 cm−1 and also for C–H out-of-plane bending at 840 cm−1. Inverse behavior was observed for transition dipole perpendicular to the long molecular axis, like in case of scissoring (at 1472 cm−1) and rocking (at 720 cm−1) deformation of CH2 groups. Analyzing the dichroic ratio of deformation vibration of CH2 groups at (1472, 1455, 720 cm−1) for extruded films before having been stretched, can be observed that chains are not oriented in a spotlight direction or they show only to a slight degree of the perpendicular orientation to the extrusion direction. When films are stretched, both the crystallites and the amorphous regions become oriented. In stretched films, the significant drop of the dichroic ratio for deformation vibration of CH2 groups was observed, which means the parallel orientation of chains to the stretching direction.
Comparison of the polarized IR spectra of the PE/PMP precursor films with spectra after MEAUS process modification. Top layer—spectra of the AB15 and the AB15-AUS films. Bottom layer—spectra of the AC15 and the AC15-AUS films. Symbols: ()—p0, ()—p90, for precursor films (navy & blue); (-○-)—p0, (-●-)—p90, for MEAUS films (black).
Dichroic ratio of selected bands for LDPE/PMP films.

Authors Wang et al. Reference Wang, Jiang, Fu, Lu and Men38 have observed that cavitation at higher temperatures appears after yield point where ellipsoidal shaped cavities were generated in those lamellae stacks with normal parallel to the stretching direction followed by an improvement of their orientation at larger strains. They proposed the schematic model of the evolution of cavitation during stretching at relevant temperature which can fairly well explain the observed changes in our films after MEAUS process. Initially, after the annealing stage, the response was amorphous interlayer deformation (i.e., between the stacked lamellae) with rigid separation of the lamellae. As the tie-chains between the lamellae become taut, chain slip initiates within the crystalline lamellae. In addition, crystalline blocks shear apart with portions decrystallizing once they are below a critical crystal size. Reference Wang, Jiang, Fu, Lu and Men38 With further stretching, crystallization of the oriented amorphous regions occurs, which is consistent with our DSC results.
IV. CONCLUSIONS
The main aim of this research was investigation of the processing-structure-properties relationship for two types of LDPE/PMP blends. The manuscript presents a comparison of three different approaches (MEAUS, MEUS, and MEUBS) in the preparation of porous polymer films. These results demonstrate that the initial melt-extruded morphology, crystal orientation, and the annealing stage have the enormous influence on the microporosity and the permeability of the final films.
DSC studies show that the annealing and the orientation by stretching significantly increased the crystallinity of LDPE matrix (A polymer) and PMP component especially C polymer. In the case of AB blends, it can be concluded that the significant impact on improving the crystallinity of the polymer B has the annealing process.
It was found that the annealing and the orientation by hot stretching were essential in obtaining high crystal orientation and planar lamellar morphology. The interesting correlation between increase of PMP crystallinity and occurring of the cavitation was observed. Highly crystalline PMP inclusions in LDPE matrix supported the formation of voids. Many nanosized voids were detected by SAXS measurements and the appearance of lamellar separation was specifically confirmed by AFM measurements. SEM observations revealed that each film possessed a slightly twisted stacked lamellar morphology and structures of films before deformation were continuous, without visible voids. Porous structures of films were characteristic for the most of processed blends with exception of AB15-US film. Studies of the overall porosity and water vapor permeability showed very good correlation with results obtained from SAXS measurements.
FTIR studies with analysis of the dichroic ratio of selected bands confirmed that crystallites and amorphous regions become much more oriented as a result of the annealing and the orientation by stretching. However, structural changes caused by the formation of nanocavities do not substantially affect the micro-organization of molecules.
LDPE/PMP blends seem to be very interesting materials and alternative to the existing, in terms of producing thin films with controlled porosity and MEAUS method can be successfully used for this purpose.
ACKNOWLEDGMENTS
The results of the research have been obtained in the framework of statutory research of Central Mining Institute No. 11530144-162 and statutory research of Center of Molecular and Macromolecular Studies.
The authors would like to thank Dr. Horst Deckmann from Gabo Qualimeter Testanlagen GMBH for his help in DMTA experiments.