Implications
On the basis of international unit system, a biopotency factor of 1.00 for all-rac-α-tocopheryl acetate and 1.36 for RRR-α-tocopheryl acetate is used to discriminate between both vitamin E sources. In the present study, we demonstrate that lambs preferentially accumulate the natural form of vitamin E (RRR-α-tocopherol) over the synthetic form (all-rac-α-tocopherol). Moreover, it was found that the relative bioavailability of RRR- and all-rac-α-tocopheryl acetate is dose- and tissue-dependent and the use of a fixed equivalence ratio is an imprecise approach to understand vitamin E distribution in lamb tissues.
Introduction
After its discovery nearly 100 years ago, the role of vitamin E as a major chain-breaking antioxidant present in membranes and lipoproteins has become largely undisputed. However, vitamin E is not a single molecule but instead consists of a family of compounds, including α-, β-, γ- and δ-tocopherol and four corresponding unsaturated analogs (α-, β-, γ- and δ-tocotrienol) (Brigelius-Flohe and Traber, Reference Brigelius-Flohe and Traber1999). α- and γ-tocopherol are the predominant forms of vitamin E found in nature, of which α-tocopherol has the greatest biological activity and is the main form of vitamin E found in blood and tissues of animals (Wolf, Reference Wolf2006). Unlike the other vitamins, chemically synthesized α-tocopherol (all-rac-α-tocopherol) is not biochemically equivalent to the natural form (RRR-α-tocopherol) due to the presence of eight different stereoisomers (RRR-, RRS-, RSR-, RSS-, SRR-, SRS-, SSR- and SSS-) with RRR- accounting for 12.5% of the total mixture (Weiser and Vecchi, Reference Weiser and Vecchi1981).
Interestingly, no consensus has been reached on determining an equivalence ratio between the two vitamin E sources (RRR- v. all-rac-α-tocopherol). The United States Pharmacopeia (USP, 1979) adopted the official biopotency factors of 1.00 for all-rac-α-tocopheryl acetate and 1.36 for RRR-α-tocopheryl acetate. These values were based on results from a rat resorption-gestation test, which were first published by Harris and Ludwig (Reference Harris and Ludwig1949) and were later supported by data using a similar model on the relative biopotency (i.e. capacity of a chemical substance to function in a biological system) of each α-tocopherol stereoisomer (Weiser and Vecchi, Reference Weiser and Vecchi1982). However, controversy arose after human and animal studies in which deuterium-labeled forms of RRR- and all-rac-α-tocopheryl acetate were used, and has been found that a ratio 2:1 (RRR-:all-rac-α-tocopheryl acetate) would better explain the biopotency differences between the two sources (Jensen and Lauridsen, Reference Jensen and Lauridsen2007).
In many ruminant production systems, animals are kept indoors and fed ensiled forages and concentrates as an alternative to grazing. However, there is compelling evidence that animals allowed to graze present higher levels of α-tocopherol in the tissues (more specifically in muscle) than those fed preserved forages and concentrates (Lanari et al., Reference Lanari, Brewster, Yang and Tume2002; Turner et al., Reference Turner, McClure, Weiss, Borton and Foster2002; Realini et al., Reference Realini, Duckett, Brito, Dalla Rizza and De Mattos2004; Ripoll et al., Reference Ripoll, González-Calvo, Molino, Calvo and Joy2013). One could argue that the lower vitamin E status found in animals kept indoors can be tackled with vitamin E supplementation. However, the most commonly used source of α-tocopherol in animal diets is all-rac-α-tocopheryl acetate, which is different from the RRR-α-tocopherol found in pasture, and may explain to some extent the lower α-tocopherol levels in tissues of animals kept indoors.
We hypothesized that the general accepted equivalence value of 1.36 is inadequate to predict differences in α-tocopherol deposition in tissues of lambs supplemented with different vitamin E sources (RRR- or all-rac-α-tocopheryl acetate). Therefore, our objective was to investigate the effect of different dietary levels of RRR-α-tocopheryl acetate or all-rac-α-tocopheryl acetate on total α-tocopherol concentration and stereoisomer distribution in muscle, heart, liver and spleen of lambs kept indoors and supplemented for 14 days.
Materials and methods
Animals and diets
The animal management, care, feeding and performance have been previously reported in a study that discussed the effect of vitamin E dosage and source on meat quality parameters in lambs (Leal et al., Reference Leal, Beltrán, Alonso, Bello, den Hartog, Hendriks and Martín-Tereso2018). Briefly, 360 weaned Rasa Aragonesa breed lambs (males and females) with an average BW of 22.3±1.18 kg purchased from local dealers were housed at a commercial farm (Franco and Navarro, Zaragoza, Spain). Two batches of 180 animals were used for the experiment. At arrival, lambs were weighed and brought into 20 m2 straw pens, blocked according to sex and batch of arrival following a randomized complete block design, with four blocks of nine pens each (with 10 lambs per pen). Within each block, pens were randomly assigned to one of nine experimental diets.
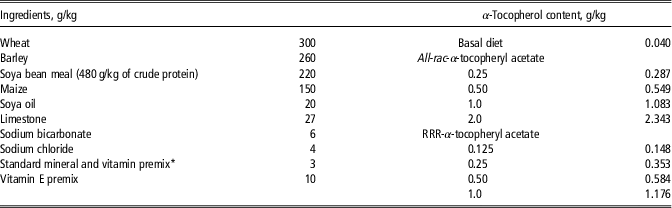
All experimental diets were formulated to be adequate in protein, energy, vitamins and minerals for this type of animal. Despite the native α-tocopherol present in the basal diet, an extra 0.025 g/kg feed of all-rac-α-tocopheryl acetate was included in all experimental diets as part of the mixture of vitamins and minerals. In addition, increasing amounts of α-tocopherol were added to the diets; 0.25, 0.5, 1.0 and 2.0 g/kg feed added as all-rac-α-tocopheryl acetate or 0.125, 0.25, 0.5 and 1.0 g/kg feed added as RRR-α-tocopheryl acetate. Diets were pelleted at 2.5 mm diameter. Supplemental vitamin E (all-rac- and RRR-α-tocopheryl acetate) was sourced from Trouw Nutrition Netherlands (Putten, The Netherlands). Ingredients and chemical composition of the experimental diets are shown in Table 1. For a period of 14 days after arrival, the lambs had free access to the experimental diets, wheat straw and water via separated troughs available in each pen. Lambs were weighted individually at the beginning of the experiment and before slaughter (14 days after) to determine BW and average daily gain. Intakes of the experimental diets were recorded weekly per pen and orts measured at the end of the experiment. Intake of wheat straw and water were not registered.
Composition of the basal diet and analyzed α-tocopherol content in the experimental lamb diets

* Mineral and vitamins provided: Ca, 0.24 g; Na, 0.47 g; S, 0.34 g; Mn, 62 mg; Zn,110 mg; Cu, 5 mg; I, 0.6 mg; Co, 0.3 mg; Se, 0.1 mg; Fe, 20 mg; vitamin A, 8000 IU; vitamin D3, IU; all-rac-α-tocopheryl acetate, 25 mg. All-rac-α-tocopheryl acetate, synthetic vitamin E. RRR-α-tocopheryl acetate, natural vitamin E.
Sample collection
Animals were slaughtered at a local slaughterhouse (Mercazaragoza S.A., Zaragoza, Spain) within 2 h after leaving the farm. Dissection took place within 30 min after slaughter and liver, heart, spleen and muscle (longissimus throracis et lumborum) samples were collected from three animals randomly selected from each pen, vacuum packed and frozen at −20°C until analyzed for α-tocopherol concentration and stereoisomer distribution.
Tocopherol analysis
Tocopherols were determined by HPLC after saponification and extraction into heptane according to Jensen et al. (Reference Jensen, Engberg and Hedemann1999) as follows. In the clean-up procedure, 2.0 g dry feed sample was mixed with 70 ml of 96% v/v ethanol, 30 ml methanol (Peter Mark, C 2517), 30 ml ascorbic acid (Merck, 5.00074.1000) and 20 ml KOH/water 1:1 (w/v) (B&B, 5268120). The mixture was saponified for 30 min at 80°C in the dark and cooled in cold water. Exactly 2 ml of the saponified mixture were diluted with 1 ml distilled water, after which tocopherols were quantitatively extracted with 2×5 ml heptane (Peter Mark, C 2514) and centrifuged at 1500×g for 10 min between each extraction (Leal et al., Reference Leal, Beltrán, Alonso, Bello, den Hartog, Hendriks and Martín-Tereso2018). From the combined heptane extract, 100 μl was injected into the HPLC. Tissues were homogenized in twice the amount of ethanol by an Ultra-Turrax homogenizer (IKA-Werke GmbH, Staufen, Germany), while being kept on ice. Aliquots of the homogenates were saponified in a mixture of ethanol, methanol, ascorbic acid (20% w/v) and KOH/water 1:1 (w/v) (B&B, 5268120) at 80°C for 20 min. After cooling in the dark, the samples were extracted with two portions of 5 ml heptane after which 100 μl was injected into the HPLC.
The HPLC column for determination of total tocopherols consisted of a 100×4.6 mm Brownlee Spheri-5 Silica 5 µm column (Perkin-Elmer GmbH, D-7770 Überlingen, Germany). The mobile phase was heptane containing 2-propanol (3.0 ml/l) and degassed with helium. The flow rate was 3.0 ml/min. A comparison of retention time and peak areas with Merck (D-6100 Darmstadt, Germany) external standards of RRR-α-tocopherol and all-rac-α-tocopherol was performed to obtain the identification and quantification of the tocopherols. Fluorescence detection was performed with an excitation wavelength of 290 nm and an emission wavelength of 327 nm (Leal et al., Reference Leal, Beltrán, Alonso, Bello, den Hartog, Hendriks and Martín-Tereso2018). The HPLC system was a Perkin-Elmer, Series 200.
Stereoisomers of α-tocopherol were analyzed by HPLC as follows. The remaining heptane extract was evaporated to exact dryness under a stream of nitrogen at 45°C. Then the α-tocopherol was derivatized to its methyl ether based on the method described by Drotleff and Ternes (Reference Drotleff and Ternes2001) and described in detail by Jensen and Lauridsen (Reference Jensen and Lauridsen2007). The methyl ether derivative was extracted with 1.5 ml heptane, of which 100 µl was injected into the HPLC. Chromatographic separation was achieved on a Chiralcel OD-H column (250×4.6 mm, 5 µm particle size, cellulose tris (3,5-dimethylphenylcarbamate) from Daicel Chemical Industries, Ltd (Tokyo, 100-6077, Japan) with heptane as eluent.
The method allowed the quantification of total tocopherol content and composition by normal phase HPLC after saponification and extraction into heptane with subsequent separation of the stereoisomers of α-tocopherol as methyl ethers by chiral HPLC. By this method, the α-tocopherol stereoisomers were separated into five peaks. The first peak consists of the sum of four Ʃ2S configured isomers (SSS-, SSR-, SRR-, SRS-), the second peak of RSS-, the third peak of RRS-, the fourth peak of RRR- and the fifth peak consisted of RSR-α-tocopherol.
Statistical and mathematical calculations
All statistical analyses were performed using SAS, version 9.3 (SAS Institute, Inc., Cary, NC, USA). Pen was the experimental unit, and individual measurements were averaged per pen.
Total tocopherol content in the tissues and stereoisomer distribution were subjected to ANOVA analysis (PROC MIXED procedure, SAS Inst. Inc., Cary, NC, USA). The model included the fixed effects of the block, vitamin E source, dose and interaction of vitamin E source and dose. Orthogonal-polynomial contrasts were used to determine linear and quadratic effects of increasing vitamin E dosages on α-tocopherol deposition in tissues. The statistical significance level was claimed at P < 0.05 and all the values are reported as least square means.
In addition, a non-linear regression procedure (PROC NLIN procedure, SAS Inst. Inc.) was also used to describe the effect of the dietary vitamin E supplementation on α-tocopherol concentrations in the selected tissues. An exponential response was calculated using the equation proposed by López-Bote et al. (Reference López-Bote, Daza, Soares and Berges2001): y = a+b (1−e−cx), where y is a dependent variable; a is the intercept; a+b is the asymptote; c is the curvature steepness and x is an independent variable.
For the non-linear regression procedure, the supplemental α-tocopherol was calculated based on the analytical values (Table 1) to represent the level of α-tocopherol supplemented above the content in the basal diet. This was achieved by subtracting the basal dietary levels found in the different treatments from the total analyzed α-tocopherol. Therefore, the α-tocopherol contents used for the statistical analysis were 0.108, 0.313, 0.544 and 1.136 g/kg of compound feed for the RRR-α-tocopheryl acetate groups and 0.247, 0.509, 1.043 and 2.303 g/kg compound feed for the all-rac-α-tocopheryl acetate (Leal et al., Reference Leal, Beltrán, Alonso, Bello, den Hartog, Hendriks and Martín-Tereso2018).
Results
Animal performance
Overall least square means and SEMs for BW, average daily weight gain, feed intake and feed efficiency are presented by Leal et al. (Reference Leal, Beltrán, Alonso, Bello, den Hartog, Hendriks and Martín-Tereso2018). Neither dietary α-tocopherol supplementation level, nor source had an effect (P > 0.05) on the aforementioned parameters.
α-Tocopherol concentration in tissues
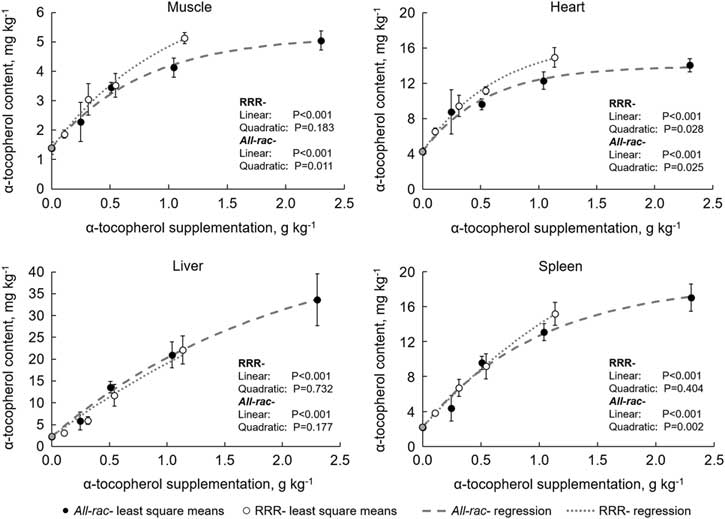
The highest α-tocopherol concentration per unit wet tissue, after the 14-day supplementation period, was found in liver followed by spleen, heart and muscle (Figure 1). α-Tocopherol concentration in all tissues increased with the increasing dietary level of both α-tocopherol sources (P < 0.001).
Effect of dietary all-rac-α-tocopheryl acetate (synthetic vitamin E) or RRR-α-tocopheryl acetate (natural vitamin E) supplementation on α-tocopherol concentrations in lamb tissues. The data, per tissue and vitamin E source were fitted to the following exponential equation: tissue α-tocopherol concentration (mg/kg of tissue) = a+b (1 – ecx), where a = common intercept for both vitamin E sources; b and c = regression coefficients; x = dietary vitamin E concentration (g/kg of feed). The regression coefficients for the non-linear model are given in Supplementary Material S1.

In the muscle, RRR-α-tocopheryl acetate supplementation led to a linear increase in α-tocopherol (linear effect, P < 0.001; quadratic effect, P = 0.183), whereas the effect of all-rac-α-tocopheryl acetate supplementation on α-tocopherol content in muscle was found to be quadratic (linear effect, P < 0.001; quadratic effect, P = 0.011). In the heart, however, increasing dietary inclusion of both α-tocopherol sources led to a quadratic increase in α-tocopherol content in the tissue (linear effect, P < 0.001; quadratic effect, P < 0.05). At similar supplementation levels (0.25, 0.50 and 1.0 g/kg), α-tocopherol content in the muscle and heart was not affected by α-tocopherol source (P > 0.05). However, the ratio between RRR- and all-rac-α-tocopherol increased in the muscle from 1.06 at 0.25 g/kg feed to 1.10 and 1.16 at 0.50 and 1.0 g/kg feed. Similarly, in the heart, the ratio between the two sources increased from 1.07 at 0.25 g/kg feed to 1.11 at 0.50 g/kg feed and to 1.15 at 1.0 g/kg feed. Supplementation of 1.0 g/kg of RRR-α-tocopheryl acetate or 2.0 g/kg of all-rac-α-tocopheryl acetate was found to yield the highest α-tocopherol concentrations in both tissues (P < 0.05) (Figure 1).
In liver, supplementation of both sources (RRR- or all-rac-α-tocopheryl acetate) induced a linear increase in α-tocopherol content (linear effect, P < 0.001; quadratic effect, P > 0.05). Similar to muscle and heart, at similar dosages (0.25, 0.50 and 1.0 g/kg), no differences were found between the two α-tocopherol sources (P > 0.05). Despite that, the ratio between the two forms of α-tocopherol increased from 0.91 at 0.25 g/kg feed to 0.94 at 1.0 g/kg feed. Moreover, supplementation of 2.0 g/kg of all-rac-α-tocopheryl acetate led to a 1.52-fold increase in total α-tocopherol concentration in liver (P < 0.05), when compared with 1.0 g/kg of RRR-α-tocopheryl acetate (33.6 and 22.1 mg/kg, respectively) (Figure 1).
Spleen tissue showed a similar pattern to that observed for muscle, in that the lambs fed RRR-α-tocopheryl acetate showed a linear increase in α-tocopherol content (linear effect, P < 0.001; quadratic effect, P = 0.40), whereas increasing supplementation levels with all-rac-α-tocopheryl acetate led to a quadratic increase of total α-tocopherol content in this organ (linear effect, P < 0.001; quadratic effect, P = 0.003). At similar levels of supplementation (0.25, 0.50 and 1.0 g/kg), no differences were found between the two α-tocopherol sources. Notwithstanding, the ratio between RRR- and all-rac-α-tocopherol increased in spleen from 0.98 at 0.25 g/kg feed to 1.02 at 0.5 g/kg feed and to 1.10 at 1.0 g/kg feed.
Distributions of α-tocopherol stereoisomers in tissues
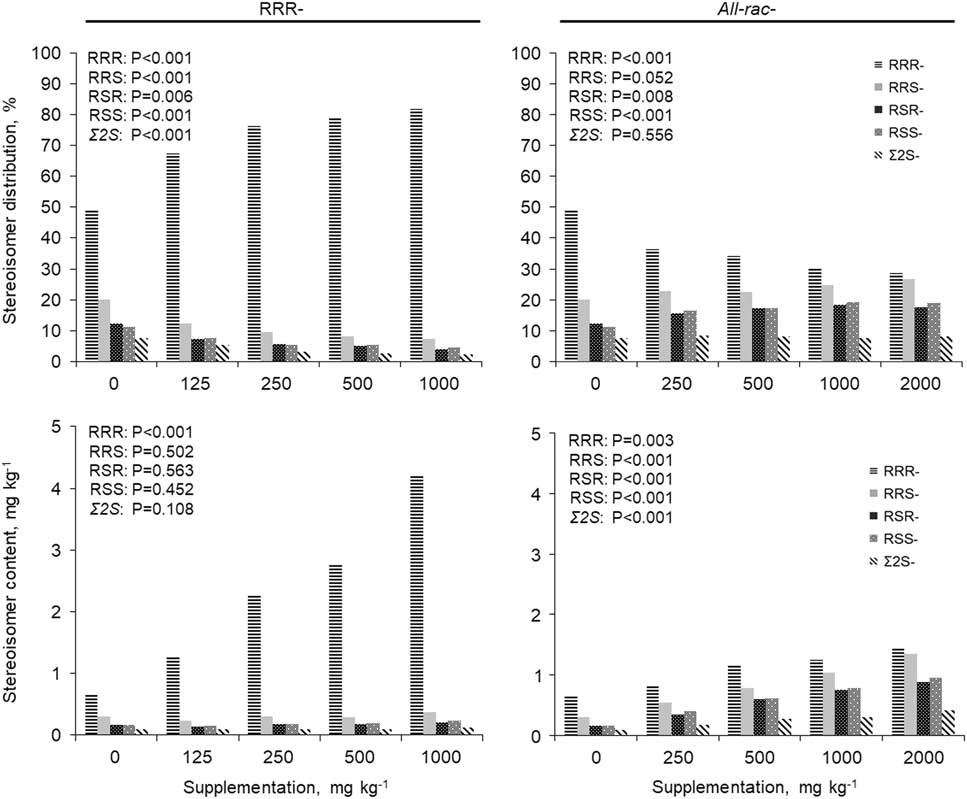
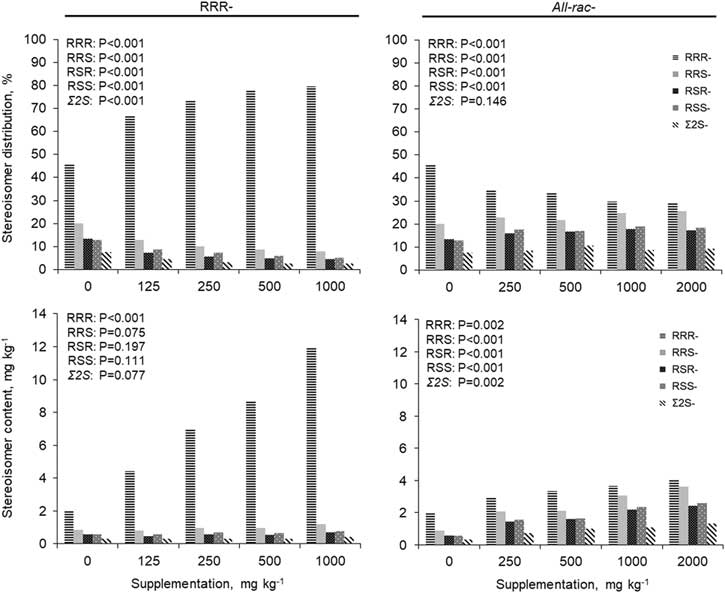
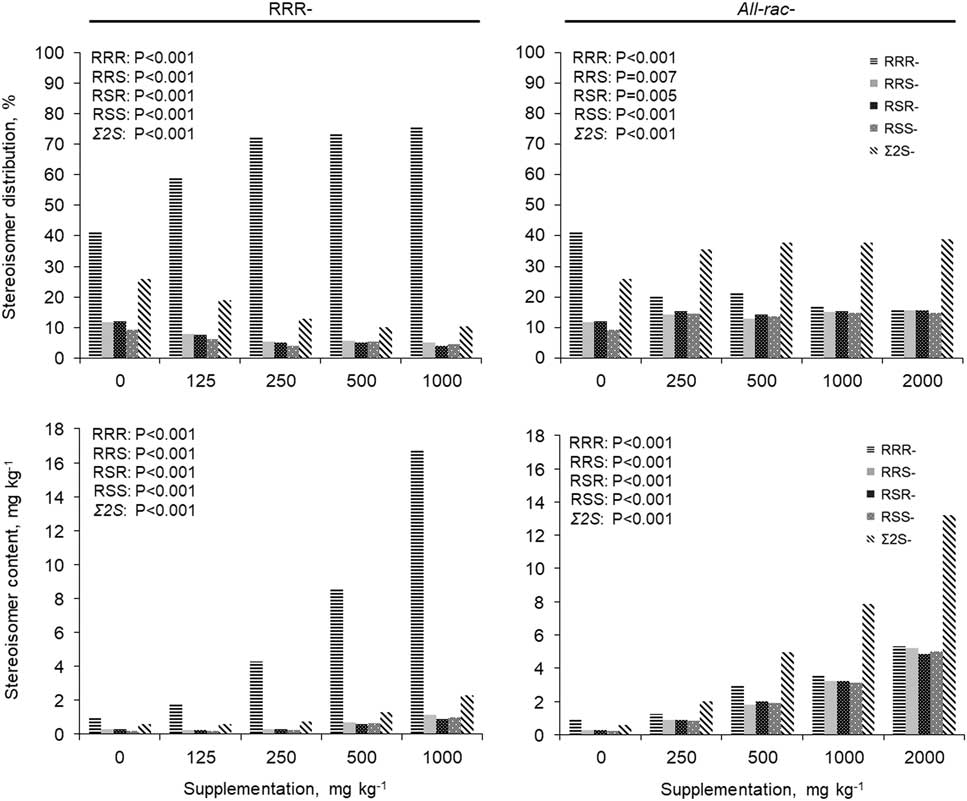
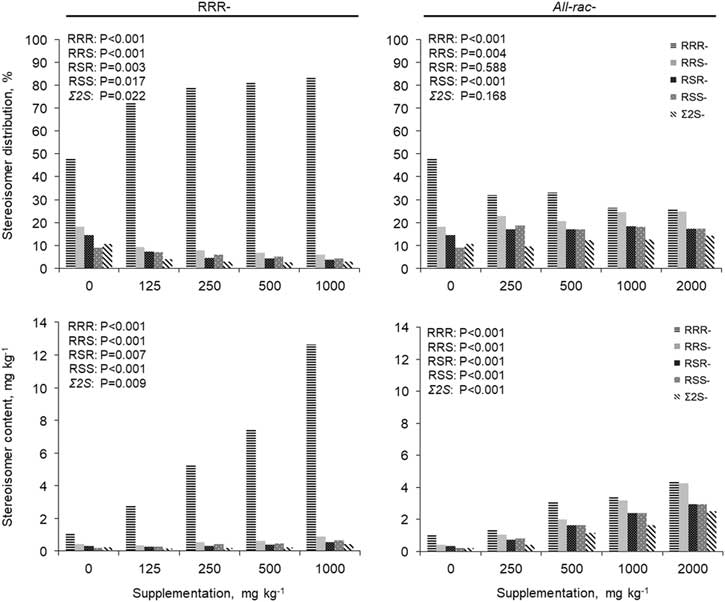
The relative and absolute distributions of α-tocopherol stereoisomers in muscle, heart, liver and spleen from lambs fed either RRR- or all-rac-α-tocopheryl acetate are described in Figures 2 to 5. With increasing dietary content of RRR-α-tocopheryl acetate, the relative proportion of RRR-α-tocopherol increased in all tissues (P < 0.001). The increase in the relative proportion of RRR-α-tocopherol stereoisomer led to a reduction in the proportion of the remaining stereoisomers (P < 0.01). However, the relative reduction in the RRS-, RSR-, RSS- and ∑2S- (sum of SSS-, SSR-, SRS- and SRR-α-tocopherol) stereoisomers had no effect on their absolute concentration in muscle (Figure 2) and heart (Figure 3) (P > 0.05). In liver (Figure 4) and spleen (Figure 5), however, it was found that when RRR-α-tocopheryl acetate concentration increased in the diets, the absolute concentration of all stereoisomers also increased (P < 0.01).
Relative and absolute proportion of α-tocopherol stereoisomers (RRR, RRS, RSR, RSS and ∑2S = SSS+SSR+SRS+SRR) in muscle of lambs supplemented with RRR-α-tocopheryl acetate (natural vitamin E) or all-rac-α-tocopheryl acetate (synthetic vitamin E).

Relative and absolute proportion of α-tocopherol stereoisomers (RRR, RRS, RSR, RSS and ∑2S = SSS+SSR+SRS+SRR) in heart of lambs supplemented with RRR-α-tocopheryl acetate (natural vitamin E) or all-rac-α-tocopheryl acetate (synthetic vitamin E).

Relative and absolute proportion of α-tocopherol stereoisomers (RRR, RRS, RSR, RSS and ∑2S = SSS+SSR+SRS+SRR) in liver of lambs supplemented with RRR-α-tocopheryl acetate (natural vitamin E) or all-rac-α-tocopheryl acetate (synthetic vitamin E).

Relative and absolute proportion of α-tocopherol stereoisomers (RRR, RRS, RSR, RSS and ∑2S = SSS+SSR+SRS+SRR) in spleen of lambs supplemented with RRR-α-tocopheryl acetate (natural vitamin E) or all-rac-α-tocopheryl acetate (synthetic vitamin E).

When lambs were fed increasing levels of all-rac-α-tocopheryl acetate, the relative distribution of RRR-α-tocopherol was reduced in all tissues (P < 0.01). In muscle and heart, the reduction in the relative proportion of RRR-α-tocopherol was followed by a significant increase in the relative proportions of RRS-, RSR- and RSS-stereoisomers (P < 0.01). Whereas, the relative proportion of ∑2S stereoisomers was unaffected (P > 0.05) (Figures 2 and 3). Despite all the changes in the relative stereoisomer distribution in muscle and heart, RRR-α-tocopherol was the most abundant stereoisomer (mg/kg tissue) followed by RRS-, RSS-, RSR- and ∑2S-α-tocopherol (P < 0.01).
In liver, with the increase in all-rac-α-tocopheryl acetate supplementation, the relative proportion of ∑2S-stereoisomers increased from 26.0% in the non-supplemented lambs to 38.8% in the group supplemented with 2.0 g/kg feed (P < 0.001) (Figure 4). The increase in the relative proportion of ∑2S-stereoisomers was associated with a concomitant reduction in the relative proportion of the RRR-stereoisomer (P < 0.001), from 41.5% in the non-supplemented lambs to 16.1% in lambs supplemented with 2.0 g/kg feed. Although the absolute concentration (mg/kg tissue) of all stereoisomers in liver increased with all-rac-α-tocopheryl acetate supplementation (P < 0.001), the ∑2S-stereoisomers were the most abundant followed by RRR-, RRS-, RSS- and RSR-α-tocopherol.
The relative and absolute contents of each stereoisomer in spleen are presented in Figure 5. Similar to the other tissues, feeding all-rac-α-tocopheryl acetate to the lambs caused a decrease in the relative proportion of RRR-α-tocopherol in spleen tissue (P < 0.001). The decrease in the proportion of RRR-α-tocopherol was accompanied by an increase in the proportion of RRS- (P = 0.004) and RSS- (P < 0.001) stereoisomers, while no change in relative distribution was found for RSR- (P = 0.588) and ∑2S- (P = 0.168) stereoisomers. Despite all the changes in the relative stereoisomer distribution in spleen, RRR-α-tocopherol was the most abundant stereoisomer (mg/kg tissue) followed by RRS-, RSS-, RSR- and ∑2S-α-tocopherol (P < 0.01).
Discussion
As previously reported by Leal et al. (Reference Leal, Beltrán, Alonso, Bello, den Hartog, Hendriks and Martín-Tereso2018), neither dietary vitamin E supplementation level nor source had an effect on average daily weight gain, feed intake and feed efficiency in light weight lambs. This is in agreement with early findings in lambs (López-Bote et al., Reference López-Bote, Daza, Soares and Berges2001; Turner et al., Reference Turner, McClure, Weiss, Borton and Foster2002; De la Fuente et al., Reference De la Fuente, Díaz, Álvarez, Lauzurica, Cañeque and Pérez2007) and beef (Arnold et al., Reference Arnold, Scheller, Arp, Williams, Buege and Schaefer1992; Lee et al., Reference Lee, Panjono Kang, Kim and Park2008; Nassu et al., Reference Nassu, Dugan, Juarez, Basarab, Baron and Aalhus2011), in which vitamin E supplementation had no effect on growth, feed intake nor efficiency.
Four different doses of RRR-α-tocopheryl acetate and all-rac-α-tocopheryl acetate were compared in this study, and as seen from Figure 1, tissue α-tocopherol concentration responded in a curvilinear increase with the increasing dietary level of either α-tocopherol source. Moreover, present data demonstrate that various tissues respond differently to increases of dietary supplementation of RRR- and all-rac-α-tocopheryl acetate. The tissue with the highest α-tocopherol concentration was the liver, followed by spleen, heart and muscle. In line with our findings, Hidiroglou (Reference Hidiroglou1987) reported in sheep that after a single oral dose of 0.1 g/kg of body weight with RRR-α-tocopherol acetate, the highest α-tocopherol concentration in tissue followed the order liver, spleen, heart and muscle. Moreover, when feeding 1000 IU per day of different α-tocopherol preparations to sheep for 56 days, Ochoa et al. (Reference Ochoa, McDowell, Williams, Wilkinson, Boucher and Lentz1992) reported consistently higher α-tocopherol concentrations in liver when compared with heart and muscle tissues. Conversely, Jensen et al. (Reference Jensen, Norgaard and Lauridsen2006) when studying the effect of different dietary doses of RRR- and all-rac-α-tocopheryl acetate in rats found higher α-tocopherol content in the spleen than in the liver. As indicated by the lack of response to incremental doses of RRR-α-tocopheryl acetate in that study, the authors argued that α-tocopherol content in spleen at the start of the study could be already close to a ‘plateau’ or tissue saturation.
As initially postulated by Blatt et al. (Reference Blatt, Pryor, Mata and Rodriguez-Proteau2004) and later supported by the findings of Jensen et al. (Reference Jensen, Norgaard and Lauridsen2006), the relative bioavailability of RRR- and all-rac-α tocopherols varies between tissues, time after dosing, duration of dosing and the amount of each dose. All these factors combined led both authors to conclude that RRR- and all-rac-α-tocopherols are not equivalent in any dose ratio. Accordingly, at similar levels of supplementation (0.25, 0.50 and 1.0 g/kg), the ratio between α-tocopherol measured in the selected tissues of lambs fed RRR- and all-rac-α-tocopheryl acetate increased with increasing dietary vitamin E supplementation. Moreover, in the current study dietary RRR-α-tocopheryl acetate led to a linear increase in α-tocopherol concentration in liver, spleen and muscle. However, increasing supplementation levels with all-rac-α-tocopheryl acetate led to a linear increase of α-tocopherol content only in liver. A linear (P < 0.05) and quadratic (P < 0.05) effect of dietary α-tocopherol supplementation was observed in heart from RRR-fed lambs and in muscle, heart and spleen from all-rac-α-tocopheryl acetate supplemented lambs. The linear plus quadratic response pattern suggested an exponential response, which was fitted as indicated in Figure 1. In an exponential response curve, the asymptote (a+b) indicates the upper limit or ‘plateau’ in tissue α-tocopherol concentration that can be reached. Therefore, lambs fed increasing amounts of all-rac-α-tocopheryl acetate reached a ‘plateau’ for α-tocopherol deposition in muscle and spleen. However, no ‘plateau’ was reached in muscle and spleen from lambs fed increasing amounts of RRR-α-tocopheryl acetate (linear effect). The non-parallel dose/concentration curves in the aforementioned tissues indicates that the relative bioavailability of RRR- and all-rac-α-tocopheryl acetate is not constant (dose and tissue dependent) (Blatt et al., Reference Blatt, Pryor, Mata and Rodriguez-Proteau2004). As tissue α-tocopherol concentrations approach the ‘plateau,’ only a marginal increase in α-tocopherol deposition will be attained at higher supplementation levels, thus explaining the different ratios found in literature to discriminate between these two α-tocopherol sources.
The biological value of different α-tocopherol sources is influenced by a multitude of factors, such as absorption, transport, distribution and metabolism (Bramley et al., Reference Bramley, Elmadfa, Kafatos, Kelly, Manios, Roxborough, Schuch, Sheehy and Wagner2000). All forms of α-tocopherol are taken up to a similar extent, in an unspecific process that includes emulsification by biliary and pancreatic secretions together with other lipids in the diet (Traber, Reference Traber1996; Clifford et al., Reference Clifford, De Moura, Ho, Chuang, Follett, Fadel and Novotny2006). From the intestine, α-tocopherol stereoisomers are transported in chylomicrons and subsequently in remnants to the liver (Brigelius-Flohe et al., Reference Brigelius-Flohe, Kelly, Salonen, Neuzil, Zingg and Azzi2002). Once in the liver, the cytosolic α-tocopherol transfer protein (α-TTP) selectively sorts out the α-tocopherol stereoisomers before their incorporation into very low-density lipoproteins, which are then released into the circulation (Traber et al., Reference Traber, Sokol, Burton, Ingold, Papas, Huffaker and Kayden1990).
From the eight stereoisomers (RRR-, RRS-, RSR-, RSS-, SRR-, SRS-, SSR- and SSS-) found in all-rac-α-tocopherol, the 2R-configured stereoisomers (RRR-, RRS-, RSR- and RSS-) when compared with the 2S-configured stereoisomers (SRR-, SRS-, SSR- and SSS-) are preferentially retained in all tissues except in the liver (Ingold et al., Reference Ingold, Burton, Foster, Hughes, Lindsay and Webb1987; Burton et al., Reference Burton, Trabet, Acuff, Walters, Kayden, Hughes and Ingold1998). Accordingly, the highest relative proportion and tissue concentration of 2S-configured stereoisomers was found in the liver of lambs supplemented with all-rac-α-tocopheryl acetate, accounting for up to 35 to 39% of the total α-tocopherol retained, whereas the proportion of 2S-configured stereoisomers in the other tissues accounted for <14% of the total (Figures 2 to 5). The fate of the 2S-configured stereoisomers retained in the liver is still unclear. However, it seems that 2S-configured stereoisomers are recognized as xenobiotic molecules and are, therefore, predominantly catabolized (Lauridsen et al., Reference Lauridsen, Engel, Craig and Traber2002; Traber et al., Reference Traber, Mah, Leonard, Bobe and Bruno2017). On the other hand, the 2R-configured isomers, and to a greater extent the RRR-stereoisomer, are recognized by α-TTP and re-secreted from the liver back into the plasma (Brigelius-Flohe et al., Reference Brigelius-Flohe, Kelly, Salonen, Neuzil, Zingg and Azzi2002). Increasing all-rac-α-tocopheryl acetate supplementation level in lamb diets was also found to affect the 2R-configured stereoisomer profile in muscle, heart and spleen, thereby increasing the proportions of RRS-, RSR- and RSS- at the cost of RRR-α-tocopherol. These findings indicate that at higher supplementation levels with all-rac-α-tocopheryl acetate, the stereospecificity of α-TTP favors 2R configurations other than only RRR-α-tocopherol.
As expected, when lambs were supplemented with RRR-α-tocopheryl acetate, the relative proportions of all stereoisomers other than RRR-α-tocopherol were reduced in all tissues analyzed. It is noteworthy that although the proportion of 2S-configured stereoisomers was reduced with the increase of dietary dose of RRR-α-tocopheryl acetate in all tissues, the absolute content of 2S-configured stereoisomers was maintained in muscle and heart and increased in liver and spleen. According to Jensen et al. (Reference Jensen, Norgaard and Lauridsen2006), this could mean that 2S-configured stereoisomers remained in the tissues for a longer period than the 2R-configured stereoisomers, and only a small exchange in stereoisomers took place during the 14 days of supplementation.
In conclusion, we found that the different tissues responded differently to the increased supplementations of dietary RRR- and all-rac-α-tocopheryl acetate. Bioavailability of the α-tocopherol stereoisomers in all tissues was affected by vitamin E source and dose. The non-parallel dose/concentration curve found in all tissues indicates that the relative bioavailability of RRR- and all-rac-α-tocopheryl acetate is not constant and that a single ratio cannot accurately describe the nutritional difference between the two sources. Therefore, this study illustrates that the generally accepted equivalence value of 1.36 is inadequate to describe α-tocopherol deposition in ruminant tissues, at least specifically in intensively fed growing lambs. The biological implications of the very distinct tissue distribution of these vitamin E sources deserve further research.
Acknowledgements
Preliminary results from the current study have been presented at the 2017 EAAP meeting (Leal et al., Reference Leal, Jensen, Bello, Den Hartog, Hendriks and Martín-Tereso2017). The authors would like to thank Franco & Navarro S.A. (Zaragoza, Spain), Mercazaragoza S.A. (Zaragoza, Spain) and Alejandro Casanova Higes for their support in this study.
Declaration of interests
The authors’ contributions are as follows: L.N.L. was the principal investigator and contributed to the study design, data analyses and interpretation of the findings and wrote the manuscript; J.M.B. contributed to the study design and data collection; J.M.T., L.D.H. and W.H. contributed to the study design and data interpretation; S.K.J. contributed to the tocopherol analysis and data interpretation. All authors read and approved the final version of the manuscript. S.K.J. and W.H.H. have no conflict of interests. L.N.L., J.M.B., J.M.T., and L.D.H. are employed by Trouw Nutrition, an animal nutrition company.
Ethics statement
The experimental and slaughter procedures used met the guidelines of Council Directive 86/609/EEC (European Communities, 1986) on the protection of animals used for experimental and other scientific purposes.
Software and data repository resources
None of the data were deposited in an official repository.
Supplementary material
To view supplementary material for this article, please visit https://doi.org/10.1017/S1751731118003373