


Tumor necrosis factor (TNF) inhibitors have changed the therapeutic standard and the outcome of treatment for patients with rheumatoid arthritis (RA). As further biologic treatments become available, it is important to investigate the pattern of usage of the three available TNF inhibitors (infliximab, etanercept, adalimumab) to identify the positioning in the treatment chain where a new treatment would be most effective and above all, most cost-effective.
Rituximab has been approved for treating RA patients with insufficient response to TNF inhibitors. When new treatments with a different mechanism of action are introduced, there is uncertainty about their effectiveness and adverse effect profile. As a consequence, they are used cautiously and often late in the treatment sequence, when patients have exhausted all other current treatment possibilities. Clinicians may be particularly cautious in the case of rituximab, due to its long-lasting effect on B-cells, and its activity over several months after each injection.
Using rituximab as “last resort” may, however, not represent the most cost-effective use of the drug. Several studies have investigated the response to subsequent treatments with different TNF inhibitors, but their interpretation appears difficult due to small sample size, short duration, and a general lack of randomized controlled trials (Reference Keystone16). Some studies have found that the response of the second TNF inhibitor depends on the reasons why the first is discontinued. An early study in Sweden in eighteen patients indicated that patients switching therapy because of lack of effect had a better clinical response to the second treatment, while those switching due to adverse events responded equally well to both treatments (Reference Van Vollenhoven, Harju, Brannemark and Klareskog27). Similar results were found in a study of 235 patients in the Danish RA registry (Reference Hjardem, Ostergaard and Podenphant11). A recent analysis of treatment responses in Southern Swedish Arthritis Treatment Group Registry (SSATG) (Reference Geborek and Saxne10) found, however, that overall response rates in first-time switchers were slightly lower than in TNF-naive patients, and markedly lower in second-time switchers (Reference Karlsson, Kristensen and Kapetanovic15). This finding indicates that a treatment with a different mode of action might be indicated already as the second biologic. A prospective study nested within the Swiss Clinical Quality Management cohort found indeed that the change in disease activity (DAS28) among patients switching to rituximab after failing at least one TNF inhibitor was larger than among patients receiving another TNF inhibitor (Reference Finckh, Ciurea and Brulhart8).
We, therefore, present a cost-effectiveness analysis of rituximab as the second biologic treatment using an economic model based on patient level clinical practice data from the SSATG registry. The basic model is described in more detail elsewhere and, therefore, only summarized in this study (Reference Kobelt, Lindgren and Geborek19).
METHODS
Main Data Sources
Clinical Practice Data. Effectiveness of treatment with TNF inhibitors in clinical practice is based on patient level data from SSATG. This registry follows patients on biological treatments since 1999 and has been extensively described elsewhere (Reference Geborek and Saxne10;Reference Karlsson, Kristensen and Kapetanovic15;Reference Kobelt, Eberhardt and Geborek18;Reference Kristensen, Kapetanovic and Gulfe22;Reference Söderlin and Geborek24). Effect variables are collected on regular basis at time 0, 3, 6, 12 (optional 0.5, 1.5, and 9 months) and thereafter every 6–12 months. Missing data are requested from treating physicians 1–2 times per year. The data set for the model was extracted with a closing date of June 1, 2007, and contained baseline demographic data, disease information (all available HAQ [functional capacity] and DAS28 scores), treatment data (biologics and concomitant disease modifying antirheumatic drugs (DMARDs) including start and stop dates), and utility scores (measured with the EQ-5D) (Reference Dolan, Gudex, Kind and Williams5;6). The final data set contained 1,903 patients with sufficient data on up to three lines of treatment (Table 1).
Demographics of Patients in the SSATG Data Set
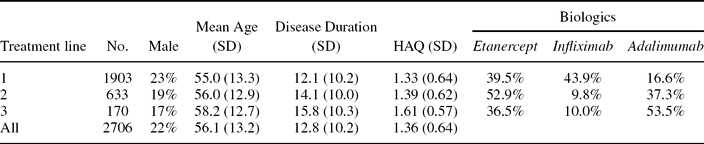
SSATG, Southern Swedish Arthritis Treatment Group Registry; HAQ, functional capacity.
Resource Consumption. Direct medical consumption and productivity losses had only been collected in the first years of follow-up in SSATG (1999–2001) (Reference Kobelt, Eberhardt and Geborek18) and were thus not directly available in the current data set. We, therefore, used resource consumption from a survey carried out at regular intervals by the department of rheumatology at the University Hospital of Malmo (Southern Sweden). The survey covers an estimated 90 percent of the patient population in the area and includes all costs, direct medical and nonmedical, as well as productivity losses (Reference Jacobsson, Lindroth, Marsal and Tejler12;Reference Jacobsson, Lindroth and Marsal13;Reference Kobelt, Lindgren, Lindroth, Jacobson and Eberhardt20). This data set has been used earlier to investigate the influence of disease activity on costs and utility, when controlling for HAQ (Reference Kobelt, Lindgren, Lindroth, Jacobson and Eberhardt20).
We have used the latest survey available at the time of this analysis (616 patients, 2002) (Reference Jacobsson, Lindroth and Marsal13;Reference Kobelt, Lindgren, Lindroth, Jacobson and Eberhardt20) to calculate costs as a function of HAQ and DAS28 (inflated to 2008 using the Consumer Price Index).
Rituximab Effectiveness. Effectiveness of rituximab was based on the registration trial REFLEX (Reference Cohen, Emery and Greenwald4). In the REFLEX trial, patients with active RA and an inadequate response to one or more anti-TNF agents were randomized to receive intravenous rituximab (one course, consisting of two infusions of 1,000 mg each, n = 311) or placebo (n = 209), both with methotrexate as background therapy. The primary efficacy end point was ACR20 response at 24 weeks. Secondary end points were ACR50 and ACR70 response, DAS28, and EULAR response criteria at 24 weeks.
Rituximab had a significantly better response rate on all criteria (p < .0001): ACR20 (51 percent versus 18 percent), ACR50 (27 percent versus 5 percent), and ACR70 (12 percent versus 1 percent) and moderate-to-good EULAR responses (65 percent versus 22 percent). Rituximab-treated patients also had clinically meaningful improvements in fatigue, disability, and health-related quality of life (demonstrated by FACIT-F, HAQ, and SF-36 scores, respectively) and showed a trend toward less progression in radiographically measured joint destruction.
Rituximab depleted peripheral CD20+ B cells, but the mean immunoglobulin levels (IgG, IgM, and IgA) remained within normal ranges. Most adverse events occurred with the first rituximab infusion and were of mild-to-moderate severity. The rate of serious infections was 5.2 per 100 patient-years in the rituximab group and 3.7 per 100 patient-years in the placebo group.
Model Structure
The model was developed as a discrete event simulation (DES) model. In DES models, similar to Markov models, patients are in “states,” for example, levels of disease, treatment, and so on. They remain in the same state until a certain event occurs, for example, change in the disease state, change of treatment, death, and so on. The best way to think about DES models is as a system (e.g., a disease and its treatment) presented as a chronological sequence of events. Thus, DES models are particularly appropriate for analyses of treatment sequences.
Patients in the model can be in three states: on treatment, off treatment, or dead. On treatment, a difference is made between the first, second, or third TNF inhibitors, but not between the different agents per se. The treatment state is further divided into high or low disease activity, the cutoff point being defined as a DAS28 score of 3.2 as in previous models (Reference Kobelt, Lindgren, Singh and Klareskog21). The rationale for the distinction is a significant difference in utility scores and in short-term sick-leave between patients with high or low disease activity event when at the same functional level (HAQ) (Reference Kobelt, Lindgren, Singh and Klareskog21). In-between treatments, all patients are assumed to have high disease activity.
A change of state for each individual patient is triggered by treatment discontinuation, treatment re-initiation, change in disease activity, or death. In the current analysis, rituximab is used in lieu of a TNF inhibitor after a first failure, and compared with the treatment sequence observed in the SSATG registry. The comparison in the economic evaluation is thus rituximab to a second line TNF inhibitor. The simulation starts at initiation of the second biological agent. A schematic outline of the model and the flow are shown in Figure 1.
Outline of the model. The model is programed as a discrete event simulation model (DES model) where individual patients are simulated with their individual chronological events. The events are “start treatment,” “stop treatment,” and “die”; therefore, patients can be on treatment, off treatment, or dead. The chronology for this analysis is as follows: Simulation starts when patients start on second line treatment, either with a second tumor necrosis factor (TNF) inhibitor or with rituximab. Patients will stay on these treatments until discontinuation of the second line TNF inhibitor according to the Southern Swedish Arthritis Treatment Group Registry (SSATG) data or withdrawal from rituximab according to the rates in the clinical trial (REFLEX). Patients previously on a TNF inhibitor will then re-initiate treatment with their third TNF inhibitor according to the timings in SSATG. Patients previously on rituximab will receive their second TNF inhibitor. The simulation may end before all patients have re-initiated treatments. When patients fail again, they will switch to another TNF inhibitor again. In the absence of sufficient data to estimate the event rates for the fourth (or subsequent) TNF treatment lines, these are assumed to be the same as for the third line. Not all patients may re-initiate treatment, representing the data observed in SSATG, as treatment intervals may be longer than the simulation time. At any time during the simulation, patients can die according to disease-specific mortality. While on or between treatments, patients will have a certain HAQ (functional capacity) and DAS28 (disease activity), which in turn drive the costs and utilities.
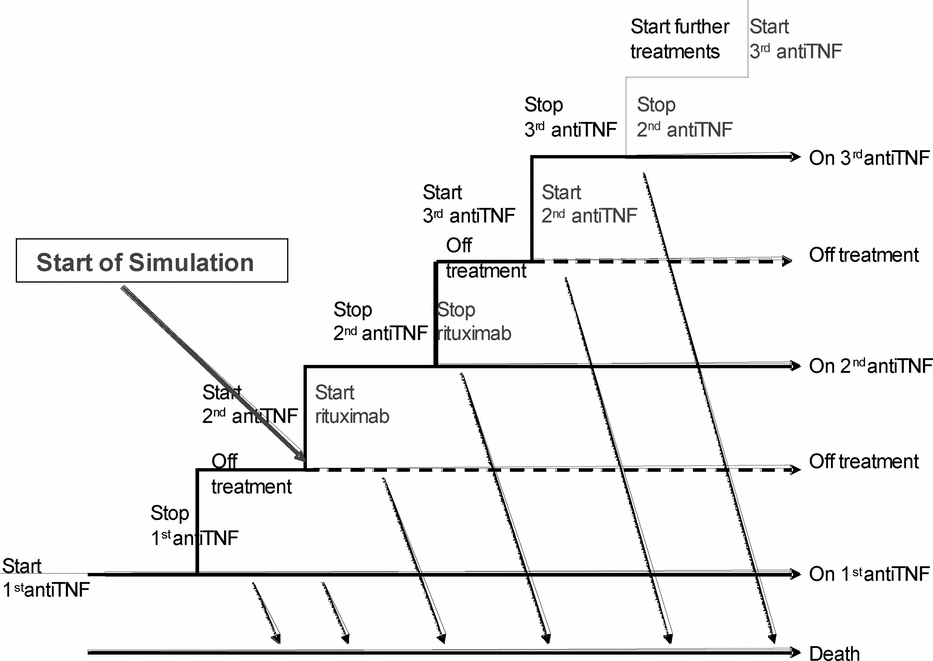
DES models are analyzed as patient level simulations. Thus they contain the full range of information available on patients in the data sets used for building the model. While in a given state, patients can have different characteristics related to gender, age, disease duration, functional, and disease activity scores. These characteristics define the costs for individual patients within the same state and drive the time to the next event.
Time-to-Event Estimates in Clinical Practice (SSATG). For TNF inhibitors, all time-to-event data are based on SSATG (Table 2 summarizes the calculations). A Cox-proportional hazard model was estimated to identify covariates (age, gender, disease duration, current HAQ, current disease activity, treatment line) with a possible impact on times to event. Significant covariates were included and parametric survival models estimated using Weibull models except in the case of time to active disease. In this case, the shape parameter was very close to 1 and an exponential model was used instead. As not all patients had a period with low disease activity, we first estimated the probability of reaching low disease activity using logistic regression and then the time to active disease using survival modeling.
Model Estimates
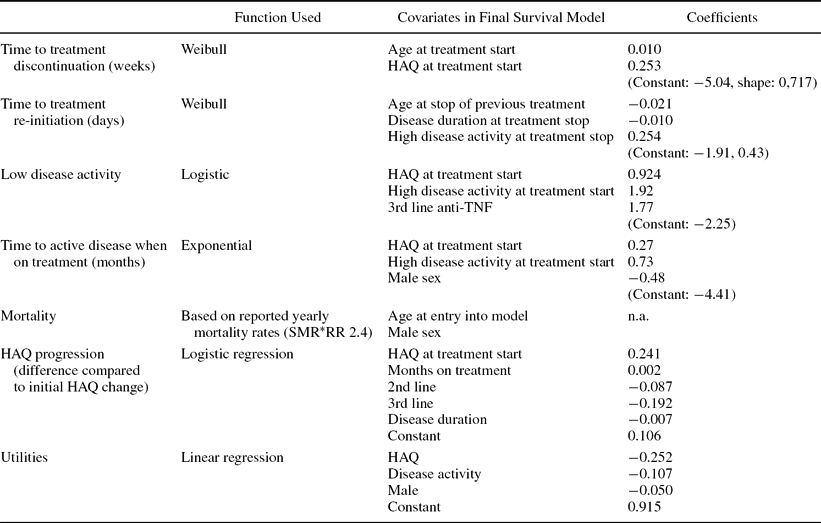
HAQ, functional capacity; TNF, Tumor necrosis factor.
The time to death was estimated from age- and gender-specific mortality rates reported for the general Swedish population (25), multiplied by a relative risk of 2.4 considering the disease severity of patients included in SSATG (Reference Gabriel, Crowson and Kremers9;Reference Jacobsson, Turesson and Nilsson14;Reference Turesson, O'Fallon and Crowson26).
The SSATG data set extracted contained up to three treatment lines, as data on subsequent treatment lines were limited at the time of data extraction. In the model, it is nevertheless possible that patients receive more than three treatments, and parameters for further treatments were based on the estimates for the third line.
Prediction of HAQ. After treatment initiation in SSATG, HAQ declined rapidly and then remained almost constant. In the model, the improvement was assumed to occur immediately and HAQ levels thereafter were assessed using linear regression on the difference compared with the initial HAQ response (Table 2). At treatment discontinuation, patients return to the initial HAQ score and progress at the rate of 0.03 per year while off treatment (Reference Scott, Pugner and Kaarela23).
Modeling Rituximab Treatment (REFLEX). Rituximab was modeled as a second line treatment, and withdrawals were assumed to go back to anti-TNF treatment immediately, using the event data for the second line TNF inhibitors. The rationale behind this assumption is that rituximab treatment should not influence the magnitude of the effect of the next TNF inhibitor.
For REFLEX, the effectiveness calculations are based on mean values reported and assume normal distribution. Mean HAQ scores declined from 1.9 to 1.4 at the 4-week measurement and remained constant up to 24 weeks of treatment. This improvement of 0.5 was applied while on treatment, suggesting that the effect of rituximab is maintained over time, as patients with insufficient response would be the ones that stop or switch treatment.
Mean DAS28 scores declined from 6.9 to 5.4 after 4 weeks and to 5.0 after 24 weeks. Assuming normal distribution of the scores, we estimated that 5.9 percent of patients would achieve a DAS28 below 3.2 at week 4, but that no further change to low disease activity would occur thereafter. We thus ignored the improvement in mean scores reported after week 4, as this may have been due nonresponders withdrawing from the trial.
During the trial, 57 of 311 patients on rituximab withdrew from treatment. Time to discontinuation was estimated with an exponential survival model fitted to the 4-weekly withdrawal rates. The resulting coefficient was 0.86, and no adjustment for covariates could be included. When patients withdraw from rituximab, they were assumed to start treatment with TNF inhibitors again immediately, as no data on the times to restart are available. This shortens the time patients spend off treatment in the rituximab arm, allowing more treatments to take place.
Outcomes and Costs
Utilities. Utility scores available from SSATG were linked to a patient's current HAQ and DAS28. In total, 6,860 observations for 1,787 patients were available for the regression analysis (Table 2).
Cost of TNF Inhibitor Treatment. The cost of TNF-inhibitor treatment was based on the proportional use of each agent in each of the treatment lines (Table 1), and the number of days of usage. Prices were taken from the official price list (7) and based on the dose in the label. This method underestimates the cost of infliximab, as patients in SSATG used higher doses, particularly in the first year. Doses ranged from 200 mg every 10 weeks to 500 mg every 4 weeks, with a mean of 26 ampoules per year. However, as the simulation starts with second line biologics, where infliximab only represents 10 percent, the effect on results would be small. Furthermore, the cost increase would also apply to the TNF treatments after rituximab withdrawal. Finally, a lower cost of TNF treatment biases results against rituximab.
A detailed analysis of concomitant therapy of a subgroup of SSATG patients indicated that 72 percent of patients received combination therapy, in 80 percent of the cases methotrexate and the remainder other nonbiological DMARDs. However, as methotrexate and DMARD therapy were included in the calculation of costs per patient in the Malmo survey, no extra cost was added to TNF-inhibitor therapy in this analysis to avoid potential double counting.
Finally, TNF inhibitors have an adverse event profile that must be expected to increase costs, in particular hospitalizations for severe infections, but also clinical investigations. However, as such costs would occur in both arms, we excluded them from the analysis.
Cost of Rituximab. The cost of rituximab treatment was based on the dose used in REFLEX (two infusions of 1,000 mg each per course). Retreatment may take place between 4 and 12 months, and we assumed a 6-month interval. This is slightly shorter than what was observed in REFLEX, and thus biases against rituximab in our analysis.
Other Costs. All other costs are estimated from the Malmo survey data, with different regressions for direct and indirect costs based on patients HAQ and DAS28.
Analysis
The analysis was conducted for Sweden and adopts hence a societal perspective including both direct and indirect costs, as well as informal care. Costs are estimated in 2008 Swedish kronor (SEK) and presented in Euro (1€ = 9.45SEK); health outcomes are expressed as quality-adjusted life-years (QALYs). Simulations are performed for a population matching the patients in REFLEX, over their lifetime, and costs and effects are discounted with 3 percent. The deterministic analysis in the base case is presented for a 52-year-old female patient with a HAQ of 1.9 at the start of the second biologic and a disease duration of 12 years.
Sensitivity analyses for the key variables and probabilistic sensitivity analysis (PSA) using all available data and patient characteristics were performed. For the PSA (or second order Monte Carlo simulation), parameter inputs were drawn 1,000 times from the underlying distributions. For each second order simulation, a full set of first order simulations was conducted. For parameters where patient level data were available (treatment stop and re-initiation with TNF inhibitors, their effect on HAQ and costs and utilities) bootstrap analysis was used. For parameters relating to rituximab, and the progression of HAQ off treatment, we assumed normal distribution.
RESULTS
Base Case
The model predicts a mean (undiscounted) survival of 24 years. Patients receive on average 2.6 lines of treatment in the current treatment arm, and 3.3 in the rituximab arm (excluding the first TNF inhibitor in both arms). The difference is explained by the immediate re-initiation of TNF treatment for all patients withdrawing from rituximab. Patients remain on rituximab for an average of 2.4 years and receive a total of 5.2 treatments.
Costs in the two arms are similar, but favor the rituximab arm. Total costs were €401,100 and €403,600, respectively, with indirect costs representing 45 percent, treatment costs 25 percent, and other direct costs 30 percent in both arms. The major difference between the strategies is found in the effect, where patients in the rituximab arm gain 0.20 additional QALYs (discounted), due in part to the absence of lag-time in restarting a TNF inhibitor at withdrawal of rituximab. The strategy including rituximab in second line thus dominates current treatment (Table 3).
Results
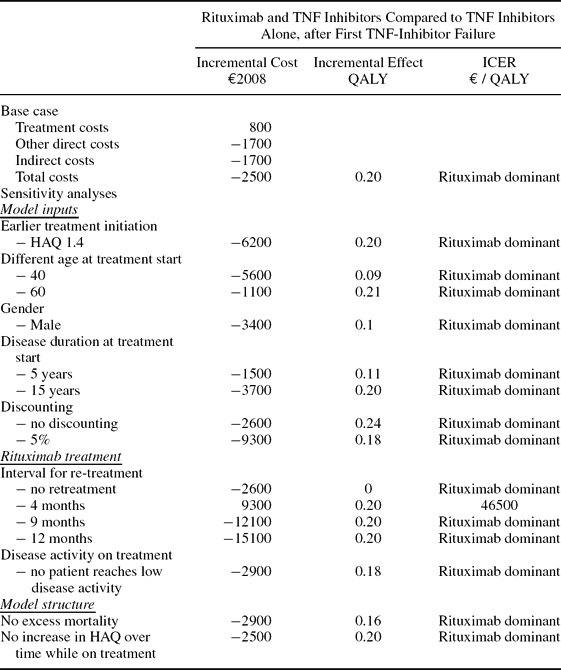
TNF, Tumor necrosis factor; ICER, incremental cost-effectiveness ratio; QALY, quality-adjusted life-year; HAQ, functional capacity.
Sensitivity Analyses
Changes in the individual key inputs do not affect these results (Table 3). Only if rituximab were administered every 4 months or less are costs for this strategy higher. All other scenarios tested yield cost-savings for the rituximab arm. When treatment is started at a lower HAQ, cost savings and QALY gains are larger.
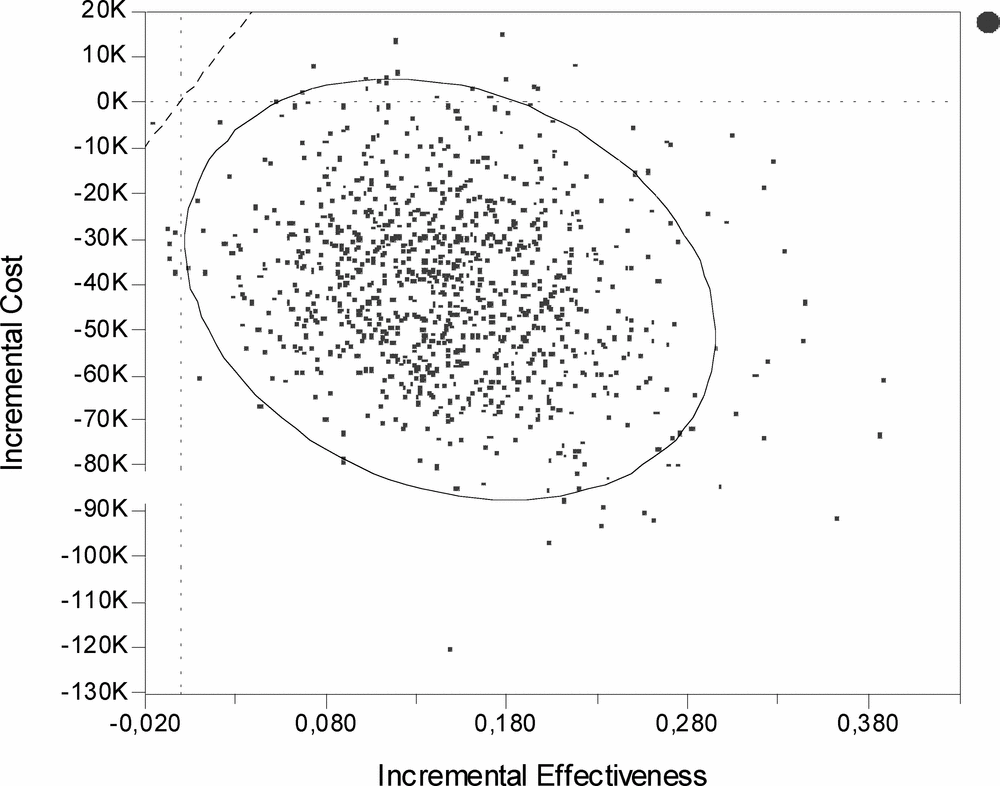
The results from the PSA indicate that all but one of the 1,000 simulations fall below a theoretical threshold of 500,000SEK (€53,000) (Figure 2).
Probabilistic sensitivity analysis. The scatterplot represents 1,000 second order simulations of the cost-effectiveness of rituximab used after failure of the first TNF inhibitor compared with current practice with further TNF inhibitors. The dashed diagonal line represents a theoretical willingness to pay (WTP) of 500,000SEK (€53,000) for a quality-adjusted life-year (QALY) gained. The ellipse is the 95 percent confidence interval covering 95 percent of the simulations.
DISCUSSION
When the TNF inhibitors were introduced, the economic question was whether their high cost was justified in view of their benefit. Several economic evaluations have been performed in the past decade, predominantly at launch of the products in view of reimbursement negotiations. In RA, economic evaluation involves, by default, modeling, as most of the effect both in terms of health effects and costs is in the long term. Thus, TNF inhibitors were compared with nonbiologic DMARDs, using historic data from epidemiological cohorts or published clinical data. The two approaches differed primarily by the availability of data. When extensive longitudinal epidemiological and treatment data are available, it is possible to model the disease process as it evolved under previous therapy and estimate the changes that may occur when using new treatments. This approach adopts almost automatically a broad societal perspective where all costs and consequences are included. In the absence of long-term cohort data, several different clinical trials, which in the field of RA often means relatively old data, have to be combined into a theoretical treatment sequence that may or may not occur in clinical practice (Reference Kobelt17).
After a decade of use of TNF inhibitors, the primary economic question for a new biological agent with essentially similar efficacy data is how the drug compares to the TNF inhibitors and where in the currently established treatment strategy it should be used, rather than how the disease will change. This requires the same type of cohort data as when modeling the “natural history” of the disease. Several special registries in different countries have been established to monitor the safety and effectiveness of the TNF inhibitors in clinical practice, and data are gradually becoming available. One of the earliest of these registries was created in Sweden, as a part of the ongoing national RA registry, and we have used the data from Southern Sweden (SSATG) to model a treatment strategy including rituximab, compared to only using TNF inhibitors. This was rendered possible by the length of follow-up in SSATG (1999–2007) that allowed observing up to three treatment sequences with TNF inhibitors. In addition, SSATG not only includes detailed data on treatment, clinical effects, and adverse events, but also collects utility data using the EQ-5D on a regular basis. Thus, outcome data for the economic evaluation are directly available.
This is, to our knowledge, the first time that registry data have been used as a background of current treatment to investigate changes in costs and outcome that would occur when using a new treatment. Two previous studies using registry data have focused on verifying the results from early cost-effectiveness models comparing TNF inhibitors to nonbiologic DMARD therapy (Reference Brennan, Bansback and Nixon3;Reference Kobelt, Eberhardt and Geborek18). Both these analyses were hampered by the absence of an appropriate comparator group, as patients treated early with biologics represented the most severe group of patients. In the analysis of the first year of treatment in the SSATG registry, patients were their own control using pre- and post–TNF-treatment data (Reference Kobelt, Eberhardt and Geborek18). A more recent model using 3-year data from the larger biologics registry in the United Kingdom (BSRBR) identified a control group within the registry. However, the issue that patients treated with biologicals represented the most severe population remained, and the two groups were not comparable (although this was controlled for to some extent in the simulations) (Reference Brennan, Bansback and Nixon3). In the current analysis, the control group is not an issue, as the same data are used in both arms.
The model was developed as a DES model, whereas we have previously used Markov or Markov-like models evaluated with micro-simulation. The choice of a modeling technique is mainly a question of convenience and data availability—all models should give equal results if they use the same underlying data and provided that they are programmed correctly. In the current analysis, a Markov model was less practical due to the many characteristics changing over time that affect treatment and outcomes. In terms of computational efficiency, a DES model is a better candidate than a micro-simulation model based on a state-transition framework, as fewer calculations need to be made. In DES models, calculations are essentially limited to the number of events occurring, which may be only a few during a patients' life. In state-transition models, probabilities of moving to a different state have to be estimated at every cycle, usually a year, during the remainder of a patients' life. As the economic problem deals with different treatment courses and sequences, with different lengths of time and varying times between them, structuring the question into a chronological “time-to-event” is rather intuitive.
The results of the model are expressed as QALYs, as is the case in most of the published models according to a recent review (Reference Bansback, Ara, Karnon and Anis2). Utilities were estimated from the SSATG data, including individual patient characteristics such as age, gender, HAQ, as well as disease activity. Earlier surveys have identified the additional effect of disease activity on utilities, using the patient global visual analogue scale and incorporated the effect into modeling studies (Reference Kobelt, Lindgren, Lindroth, Jacobson and Eberhardt20;Reference Kobelt, Lindgren, Singh and Klareskog21). In the current analysis, this effect could be verified and incorporated using DAS28.
As in all modeling studies, several assumptions had to be made that require discussion. We have modeled a cohort of patients that is similar to the cohort of patients included in the REFLEX trial. The alternative would have been to adapt the rituximab patients to the characteristics of patients in the SSATG registry, where HAQ scores at baseline were lower. However, without patient-level data for the clinical trial, adjusting the REFLEX data involved substantially higher uncertainty than adapting the SSATG data. In addition, it represents a more conservative scenario. In the sensitivity analysis, starting at a lower HAQ level increased the cost-savings, but this finding must be interpreted with care, because without patient-level data, it is not possible to adjust the absolute HAQ reduction after treatment start and the mean from the trial had to be used.
When patients withdraw from treatment, we assumed that the treatment effect would be lost immediately and patients return to their HAQ score at baseline. The rationale is that those patients that stop treatment are most often those with insufficient treatment effect or adverse events, and that this effect would, therefore, not be lasting. An alternative would have been to include a lag time, but this would only be important if the return to baseline was different for the different agents. In the absence of such information, both arms are treated in the same way, and there is no difference in the results between immediate or delayed return to baseline.
With a similar reasoning, we have excluded specific calculations of costs and dis-utility for adverse events. It has been shown in the national Swedish RA registry that the relative risk of hospitalization due to infection increases is 1.43 in the first, 1.15 in the second, and 0.82 in the third year (Reference Askling, Fored and Brandt1). Considering that the risk is concentrated in the first year, the effect on an analysis starting with second line biologics would be minimal. In addition, any cost increase would be applied to both arms in the model, and thus cancel out. Should the risk be lower for rituximab than for TNF inhibitors, our assumption would favor the TNF inhibitors.
An assumption with a major effect on results is that patients withdrawing from rituximab treatment would start TNF-inhibitor treatment immediately. The rationale is that with rituximab the decision to stop is likely to happen when retreatment would be required, due to the long-lasting effect of each infusion. There are currently no data that would allow estimating a precise time-to-restart. As a result of this assumption, patients in the rituximab arm receive more treatment lines within the simulation time, and treatment costs are thus higher. This cost-disadvantage, however, may be compensated by a utility gain, as patients spend a shorter time with a high HAQ score.
Patients in the model can receive a fourth or fifth treatment with TNF inhibitors, although there are not enough data available to estimate times to events. We assumed that effects would be similar to the third treatment. The effect of this assumption on the results is minimal, considering the average number of treatments that result in the model (2.6 in the TNF-inhibitor arm, 2.3 plus rituximab in the rituximab arm).
From a health economic point of view, it appears efficient to use rituximab in second line treatment. Clearly, however, there are medical considerations and specific patient characteristic that will play a major role in such a decision.
POLICY IMPLICATIONS
As treatment choices in RA are expanding, the relevant question both from a health economic and a clinical point of view is where in the treatment sequence a new treatment should be used. This requires good data on current usage, and patient registries may play a crucial role in the future.
CONTACT INFORMATION
Peter Lindgren, PhD (Peter.Lindgren@3innovus.com), Director, i3/innovus, Klarabergsviadukten 90D, SE-111 64 Stockholm, Sweden; Cardiovascular Epidemiology Unit, Institute of Environmental Medicine, Karolinska Institute, SE-171 77 Stockholm, Sweden
Pierre Geborek, MD, PhD (Pierre.Geborek@med.lu.se), IKVL, Department of Rheumatology, University of Lund, SE-221 00 Lund, Sweden; Associate Professor, Department of Rheumatology, Lund University Hospital, SE-221 85 Lund, Sweden
Gisela Kobelt, PhD (Gisela.Kobelt@he-europe.com), President, European Health Economics, 492 chemin des laurens, FR-06530 Spéracèdes, France; Visiting Professor, Department of Orthopedics, University of Lund, SE-221 00 Lund, Sweden



