Implications
Broiler production is facing to an increasing incorporation (Slominski et al., Reference Slominski, Boros, Campbell, Guenter and Jones2004; Bregendhal, Reference Bregendahl2008) of unconventional feedstuffs (rapeseed meal, beet pulps, palm kernel cake and distiller’s dried grains with solubles) containing more fibers in diets. To restore suitable energy content, fat may be added to fiber rich diets, so that energy source is changed from starch to lipids. Divergently selected chicken lines for body fatness are pertinent experimental models to unravel energy metabolism pathways and body composition and to test possible interactions between genetics and nutrition. Our study showed that these lines are able to use starch or lipids without modifying their respective growth performance and body composition. Therefore, one may assume that broilers could adapt well to different energy sources allowing the inclusion of more fibers in the diet formulation even if the apparent metabolizable energy was lower and lipid digestibility was higher with diet presenting high lipid and high fiber contents compared with diet presenting low lipid content and high starch content.
Introduction
The feed cost represents about 60% of total cost in chicken production. In a context of high prices for raw materials used in animal feed, it is necessary to optimize feed efficiency and especially the use of dietary energy. In chickens, feed energy is mainly provided by starch derived from cereals and by oils. From a metabolic point of view, dietary lipids can be directly stored in body tissues, whereas carbohydrates stimulate hepatic de novo fatty acid synthesis and then, the secretion of neo-synthesized lipids to peripheral tissues. The effects of dietary energy sources on growth performance and body composition of chickens remain however rather controversial between studies (Plavnik et al., Reference Plavnik, Wax, Sklan, Bartov and Hurwitz1997; Adrizal et al., Reference Adrizal, Ohtani and Yayota2002; Malheiros et al., Reference Malheiros, Barbosa Moraes, Collin, Janssens, Decuypere and Buyse2004). The ability to synthesize and store lipids is also controlled by genetics. To increase our understanding of the genetic regulation of adiposity and energy metabolism in chickens, experimental lines have been divergently selected for low or high abdominal fat (Leclercq, Reference Leclercq1988). These lines are also suitable to study the interactions between diets and genetics. Indeed, these lines notably show different responses to variations in energy to protein ratio in diets. Swennen et al. (Reference Swennen, Janssens, Collin, Le Bihan-Duval, Verbeke, Decuypere and Buyse2006) reported that chickens fed a low protein and high fat diet exhibited higher abdominal fat deposition than chickens fed a high protein and low fat diet, and this difference was more pronounced for the fat chickens. Conversely, Jlali et al. (Reference Jlali, Gigaud, Métayer-Coustard, Sellier, Tesseraud, Le Bihan-Duval and Berri2012) showed that decreasing the dietary energy to protein ratio altered glycogen storage and quality traits of breast muscle in lean chickens only. However, the effects of dietary energy source on growth performance, body composition and energy metabolism of these genetically divergent fat and lean lines have not been described so far.
The aim of this study was to determine how experimental slow-growing lines having a contrasted ability to store and synthetize lipids can adapt to different dietary energy sources, by evaluating growth performance, lipid and energy digestibility, body composition, tissue energy metabolism and meat quality traits.
Material and methods
Experimental design
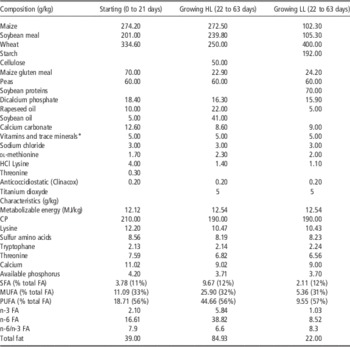
All experimental procedures were performed in accordance with the French National Guidelines for the care and use of animals for research purposes (certificate of authorization to experiment on living animals n°7740, Ministry of Agriculture and Fish Products, and favorable notice of ethics committee of ‘Val de Loire’, 30 March 2012). A total of 120 males from two experimental lines (60 per line) divergently selected on abdominal fat content (fat and lean lines, respectively, Leclercq, Reference Leclercq1988) were obtained from the ‘Pôle Expérimental Avicole de Tours’ (INRA, Nouzilly, France) on the day of hatching. Chickens were reared together in a closed building (6.7 birds/m2) and fed a starting diet (12.12 MJ ME/kg and 210 g CP/kg). At 21 days of age, in order to limit individual variability, 32 chickens per line of similar BW were distributed into two groups receiving one of the two experimental diets and placed in individual cages (60×45×60 cm per cage). To limit the genetic variation, two or four brothers from a same family (one sire crossed with one dam) were equally distributed into the two dietary groups. The chickens had free access to water and feed. The composition and main characteristics of diets are presented on Table 1. All diets were provided under pelleted form. Their characteristics were in adequacy with the requirement of these slow-growing chickens (Larbier and Leclercq, Reference Larbier and Leclercq1992). The growing diets were calculated, thanks to data presented in INRA tables (INRA, 1989), to be isocaloric (12.54 MJ ME/kg) and isonitrogenous (190 g CP/kg) but exhibited a low (LL) or a high (HL) lipid content. Purified cellulose was used as a diluent in the HL diet. The percentages of saturated, monounsaturated and polyunsaturated fatty acids (SFA, MUFA and PUFA, respectively) were similar in the two growing diets. The experimental growing diets were given from 21 to 63 days. The growing diets contained titanium dioxide (5 g/kg feed) to determine apparent metabolizable energy (AME) and lipid digestibility at the beginning and at the end of the growing period (Jagger et al., Reference Jagger, Wiseman, Cole and Craigon1992; Short et al., Reference Short, Gorton, Wiseman and Wiseman1996). Diets were sampled to determine crude fiber (NF V03-040), starch (enzymatic method, NF V18-121), total protein (Kjeldhal method, NF ISO 5983-1) and lipid (Soxhlet method, NF ISO 11085) contents. The dietary FA composition was determined according to Chartrin et al. (Reference Chartrin, Berri, Le Bihan-Duval, Quentin and Baéza2005).
Composition and main calculated characteristics of diets

SFA=saturated fatty acids; MUFA=monounsaturated fatty acids; PUFA=polyunsaturated fatty acids; HL, LL=diets having high or low lipid content.
* Vitamins A: 3.106 IU; D3: 86.104 IU; E: 2.104 UI; K3: 1000 mg; B1: 1000 mg; B2: 1600 mg; pantothenate: 5000 mg; B6: 1400 mg; B12: 5.2 mg; niacin: 2.104 mg; folate: 600 mg; biotin: 60 mg; choline chloride: 110.104 mg; trace minerals: Cu: 4.103 mg; Fe: 1.104 mg; Zn: 18.103 mg; Mn: 16.103 mg; I: 400 mg; Se: 40 mg. The concentration is expressed per kg of premix.
Growth performance and body composition
Birds were weighed at 0, 21, 35, 49 and 63 days of age. Between 21 and 63 days of age, feed consumption was individually recorded every 2 weeks. At 63 days of age, 12 chickens per line and per diet were selected according to their BW close to the average value of their group to limit individual variability. Chickens were feed-deprived for 12 h and then refed for 3 h before being euthanized by decapitation and bleeding. Just after slaughter, the liver, heart, Pectoralis major (PM) and Sartorius (SART) muscles, abdominal fat, fat located on the top of the external face of the thigh and the remaining portion of thigh and shrank (without skin) were immediately removed and weighed in order to determine their percentages relative to BW. Tissue samples were immediately frozen in liquid nitrogen and then stored at −80°C until analyses.
AME and lipid digestibility
At 28 and 62 days of age, all the excreta produced during 24 h (Peron et al., Reference Peron, Bastianelli, Oury, Gomez and Carré2005) were individually collected and immediately frozen at −20°C. Then, excreta were freeze dried, ground with a hammer mill at 0.5 mm and stored at 4°C until analyses. To determine AME and lipid digestibility, the gross energy (GE) and lipid content of diets and excreta were first measured by using an isoperibol calorimeter C7000 IKA (Staufen, Germany) (NF ISO 9831) and a Soxhlet system after an acid hydrolysis (NF ISO 11085), respectively. Then, titanium dioxide concentrations in diets and excreta were measured according to Myers et al. (Reference Myers, Ludden, Nayigihugu and Hess2004). The AME (kcal) and lipid digestibility (%) were calculated as following:
 $$\eqalignno{ {\rm AME}= & {\rm GE\ feed}-[{\rm GE\ feces}\,{\times}\,{\rm (}\%\,{\rm titanium\ dioxide} \cr & {\rm feed}/\%\,{\rm titanium\ dioxide\ excreta)}] \cr {\rm Lipid\ digestibility}= & \,\%\,{\rm lipids\ feed}-[\%\,{\rm lipids \ feces}{\times}(\%\,{\rm titanium} \cr & {\rm dioxide\ feed}/\%\,{\rm titanium\ dioxide\ excreta})] \cr & /{\rm }\%\,{\rm lipids\ feed}{\times}{\rm 1}00 $$
Histomorphometry of the jejunum
Just after slaughter, the intestine was removed. In the median part of the jejunum, a portion (0.5 cm length) was taken, longitudinally opened, washed with NaCl (0.9 g/l) and fixed in a buffered formaline solution for 24 h. Then samples were rinsed three times with ethanol 70% and stored at 4°C. Histological analyses were performed as described by Gabriel et al. (Reference Gabriel, Mallet, Leconte, Travel and Lalles2008). Briefly, the samples were rehydrated, stained with Alcian Blue and periodic Schiff’s reagent, and then rinsed in distilled water before storage at 4°C in a 45% acetic acid solution until analysis the following week (De Verdal et al., Reference De Verdal, Mignon-Grasteau, Jeulin, Le Bihan-Duval, Leconte, Mallet, Martin and Narcy2010). Villi and crypts were carefully individualized under a dissecting microscope and mounted between slides and coverslips. Ten villi and 20 crypts of Liberkühn were measured for each bird using an optical microscope, a camera and image analysis software as described by De Verdal et al. (Reference De Verdal, Mignon-Grasteau, Jeulin, Le Bihan-Duval, Leconte, Mallet, Martin and Narcy2010). Height and width of villi and depth and width of crypts were measured. The surface areas of the villi and crypts were calculated as the product of the height multiplied by the width. An average value was calculated for each parameter and each bird.
Glycolytic potential (GP) and markers of energy metabolism
Glycogen, glucose-6-phosphate, free glucose and lactate contents (µmol/g fresh tissue) were measured in liver and muscles by enzymatic procedures according to Dalrymple and Hamm (Reference Dalrymple and Hamm1973) from 1 g of frozen tissue. The GP, that takes into account the main intermediate metabolites of glycogen degradation in live and postmortem tissue and therefore represents an estimate of the resting glycogen level in tissue (Monin and Sellier, Reference Monin and Sellier1985), was calculated as follows:
 $${\rm GP}={\rm 2[}({\rm glycogen}){\plus}({\rm glucose}){\plus}({\rm glucose{{\hbox -}}6{{\hbox -}}phosphate}){\rm ]}{\plus}({\rm lactate})$$
It was expressed as µmol of lactate equivalent/g fresh tissue.
The activities of three enzymes participating to glycolytic (lactate dehydrogenase, LDH) or oxidative (β-hydroxyacyl CoA dehydrogenase, HAD and citrate synthase, CS) energy metabolism in liver and muscles were spectrophotometrically assayed as described by Bass et al. (Reference Bass, Brdiczka, Eyer, Hoper and Pette1969).
The activities of enzymes participating in lipogenesis were only assessed in liver. Tissue samples were first homogenized in 0.25 M ice-cold sucrose solution containing EDTA (1 mM) and dithiothreitol (1 mM). Mixtures were ultra-centrifuged at 100 000×g during 1 h at +4°C. The resulting supernatants containing cytosolic proteins were collected and frozen at −80°C until use. Specific activities of malic enzyme (ME1), glucose-6-phosphate dehydrogenase (G6PDH), and fatty acid synthase (FAS) were assayed spectrophotometrically at 340 nm absorbance (Bazin and Ferré, Reference Bazin and Ferré2001). Activities were expressed per units of cytosolic proteins.
Meat quality traits
After slaughter, the left PM muscle was removed and stored in a plastic bag at 4°C for 24 h to determine the ultimate pH (pHu) and color parameters, namely lightness (L*), redness (a*) and yellowness (b*) values of the meat as described by Berri et al. (Reference Berri, Le Bihan-Duval, Debut, Santé-Lhoutellier, Baéza, Brunel, Jégo and Duclos2007). The left thigh without skin and SART muscle was stored in a plastic bag at 4°C for 7 days before determining the thiobarbituric acid reactive substances (TBARS) on a sample of the Quadriceps femoris muscle according to Lynch and Frei (Reference Lynch and Frei1993).
Lipid content and FA composition of tissues
The lipid content and FA composition in the liver, abdominal fat and muscles were determined according to Chartrin et al. (Reference Chartrin, Berri, Le Bihan-Duval, Quentin and Baéza2005).
Statistical analysis
The experimental unit was the bird. The effects of line (fat or lean), diet (HL or LL) and the interaction between diet and line (D×L) on the different parameters were submitted to ANOVA (Statview software). Means were compared with a Newman–Keuls’ test. A probability level P<0.05 was retained for significance. We also calculated Pearson correlation coefficients between different parameters.
Results
Characteristics of experimental diets
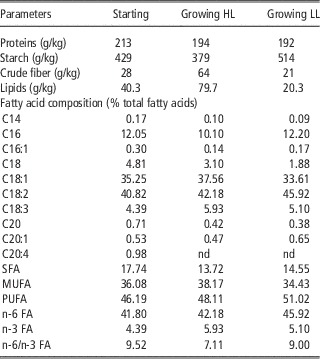
As planned, starch content was greater but lipid and cellulose contents were four-fold and three-fold lower, respectively, in diet LL than in diet HL (Table 2). Contrary to calculated values, the percentage of measured MUFA was slightly lower and that of PUFA was slightly higher for the LL diet than for the HL diet (Table 2). Overall, the LL diet, exhibiting lower lipid content than the HL diet, provided lower quantities of SFA, MUFA and PUFA than the HL diet.
Analyzed characteristics of starting and growing diets

SFA=saturated fatty acids; MUFA=monounsaturated fatty acids; PUFA=polyunsaturated fatty acids; nd=not detected; HL, LL=diets having high or low lipid content.
Growth performance and body composition
No interaction (P>0.10) between diet and line was observed for growth performance and body composition of chickens. The diet had no effect on growth performance (Table 3). Irrespective of diet, chickens of the lean line displayed lower average daily gain (ADG) and lower average daily feed intake (ADFI) over the growth period considered, so that BW at 63 days of age was 6% lower (P=0.02) in the lean line than in the fat line. However, the gain to feed ratios, calculated between 49 and 63 days of age (data not shown) and for the whole growing period (22 to 63 days of age), were higher (P=0.03) in lean chickens than in fat chickens.
Effect of line (fat and lean) and diet (HL and LL) on the growth performance of chickens (n=12)

ADG=average daily gain; ADFI=average daily feed intake; HL, LL=diets having high or low lipid content.
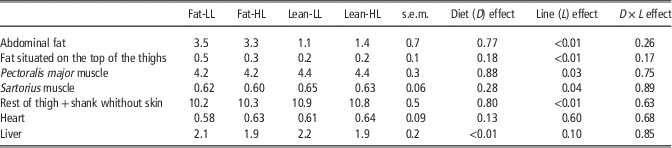
The diet had no effect on body composition at 63 days of age, with the exception of the liver, which was heavier (P<0.0001) with the LL diet than with the HL diet (Table 4). Irrespective of the diet, chickens of the lean line had a higher muscle yield but a lower carcass fatness than fat chickens, as illustrated by the 63% reduction in abdominal fat proportion. The correlations between the percentage of abdominal fat and the percentages of fat located on the top of thighs, PM and SART muscles were +0.72 (P<0.01), −0.40 (P<0.05) and −0.36 (P<0.05), respectively. The line had no effect on the percentages of liver and heart relative to BW.
Effect of line (fat and lean) and diet (HL and LL) on the body composition of chickens at 63 days of age (% BW; n=12)

HL, LL=diets having high or low lipid content.
AME and lipid digestibility and histomorphometry of the jejunum
No interaction between diet and line was observed for digestibility values or histological traits of the jejunum. At 28 days of age, AME was higher (+2.5%, P<0.01) and apparent lipid digestibility was lower (−8.6%, P<0.0001) for the LL diet than for the HL diet (Table 5). At 62 days of age, the diet did not affect AME, whereas lipid digestibility was still lower (−8.7%, P<0.0001) in the LL diet than in the HL diet (Table 5). AME and apparent lipid digestibility were higher at 62 days than at 28 days of age (+3% and +6%, respectively; P<0.05). Irrespective of the diet and age, lean chickens had higher AME (P<0.001) and apparent lipid digestibility (P<0.0001) than fat chickens at both ages.
Effect of chicken line (fat and lean) and diet (HL and LL) on apparent metabolizable energy (AME) and apparent lipid digestibility of diets measured at 28 and 62 days of age (n=12)

HL, LL=diets having high or low lipid content
Chickens fed the LL diet exhibited reduced width (−15%, P<0.01) and area (−16%, P=0.03) of villi and lower depth (−12%, P=0.04) and smaller area (−5%, P<0.05) of crypts in the jejunum than chickens fed the HL diet (Table 6). The morphology of villi and crypts in the jejunum did not differ between lines.
Effect of line (fat and lean) and diet (HL and LL) on the morphology of villi and crypts in the jejunum of chickens at 63 days of age (n=12)

HL, LL=diets having high or low lipid content
GP and markers of energy metabolism in tissues
No interaction between diet and line was observed for glycogen content, GP and enzyme activities related to energy metabolism in tissues.
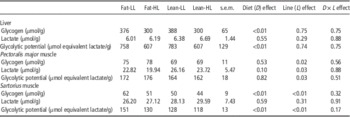
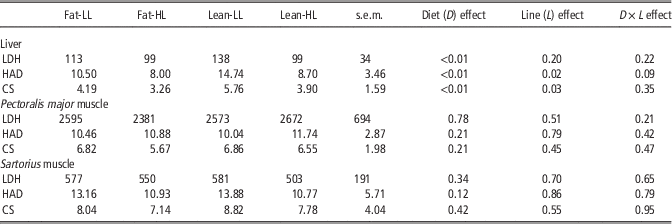
Irrespective of the line, chickens fed the LL diet had higher glycogen content and GP (+27%, on average, for both traits, P<0.0001) in the liver than chickens fed the HL diet (Table 7), without any dietary-associated variation of hepatic lactate content. Chickens fed the LL diet also had higher (P<0.01) activities of LDH, HAD and CS enzymes than chickens fed the HL diet (Table 8); moreover, these chicken had a higher (P=0.0002) activity of FAS, the key lipogenic enzyme, than chickens fed the HL diet, whereas the activities of G6PDH and ME1 enzymes producing NADPH for lipogenesis did not differ between diets (Table 9).
Effect of line (fat and lean) and diet (HL and LL) on glycogen and lactate contents and glycolytic potential of muscles and liver of chickens (n=12)

HL, LL=diets having high or low lipid content.
Effect of line (fat and lean) and diet (HL and LL) on the enzymatic activity of lactate dehydrogenase (LDH), β-hydroxyacyl CoA dehydrogenase (HAD) and citrate synthase (CS) of muscles and liver of chickens expressed as µmoles of substrate transformed/min per g of muscle (n=12)

HL, LL=diets having high or low lipid content.
Effect of line (fat and lean) and diet (HL and LL) on the enzymatic activity of glucose-6-phosphate dehydrogenase (G6PDH), malic enzyme (ME1) and fatty acid synthase (FAS) of liver of chickens expressed as nmoles/min per mg proteins (n=12)

HL, LL=diets having high or low lipid content.
The diet had no effect on glycogen and lactate contents and GP in PM muscle, but chickens fed LL diet had higher glycogen content (+18%, P=0.002) and GP (+13%, P=0.0002) than chickens fed HL diet in SART muscle.
Irrespective of the diet, the line had no effect on the glycogen and lactate contents, GP and LDH activity in the liver (Tables 7 and 8). On the opposite, activities of HAD and CS enzymes were greater (P<0.03) in the lean line than in the fat line. In PM and muscles, the lean chickens had lower glycogen content (−11%, and −17%, P<0.05, respectively) and PG (−6%, and −12%, P<0.05, respectively) than the fat chickens. Activities of enzymes involved in energy metabolism did not differ between the two lines (Table 8).
Meat quality traits
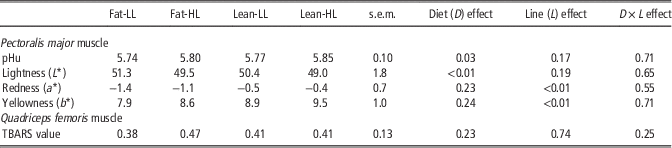
No interaction between diet and line was observed for the meat quality traits (Table 10). Chickens fed the LL diet had lower pHu (5.76 v. 5.83, P=0.03) and b* value (8.4 v. 9.1, P=0.04) but higher L* value (50.9 v. 49.3, P=0.004) in PM muscle than chickens fed the HL diet. The diet had no effect on a* value. Irrespective of diet, the line had no effect on the pHu value of breast muscle (Table 10), but the lean chickens exhibited higher a* (−0.5 v. −1.3, P=0.0003) and b* (9.2 v. 8.3, P=0.04) values than the fat chickens. Overall, the correlation between pHu and L* was 0.44 (P<0.05). The diet and line did not influence the production of TBARS in the thigh muscle.
Effect of chicken line (fat and lean) and diet (HL and LL) on the ultimate pH (pHu) and the color of breast muscle measured after 24 h storage at 4°C and the thiobarbituric acid reactive substances (TBARS value expressed as mg equivalent malondialdehyde/kg) of thigh muscle measured after 7 days of storage at 4°C (n=12)

HL, LL=diets having high or low lipid content.
Lipid content and FA composition of tissues
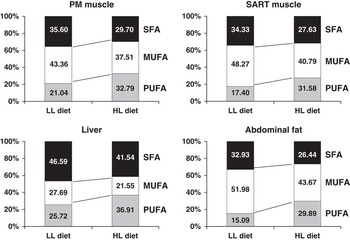
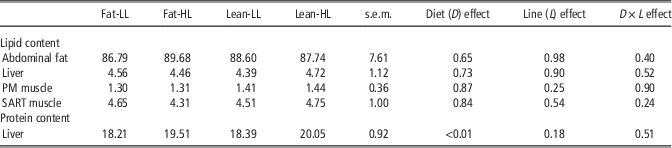
In all examined tissues, diet and line did not affect lipid content (Table 11), but affected the FA composition (Figure 1). In PM and SART muscles, the interaction between diet and line on the FA composition was not significant (data not shown).
Effect of diet having high or low lipid content (HL and LL) on the fatty acid composition (% total FA) of Pectoralis major (PM) and Sartorius (SART) muscles, liver and abdominal fat of chickens (n=12).

Effect of chicken line (fat and lean) and diet (HL and LL) on the lipid content (%) of abdominal fat, liver and Pectoralis major (PM) and Sartorius (SART) muscles and protein content (%) of liver (n=12)

HL, LL=diets having high or low lipid content.
Irrespective of line, chickens fed the LL diet exhibited the highest (P<0.0001) percentages of SFA (particularly C14 and C16) and MUFA (particularly C16:1 and C18:1) in abdominal fat, liver and muscles; they also had the lowest (P<0.0001) percentages of PUFA and n-3 and n-6 FA in all examined tissues (Figure 1 and data not shown).
Irrespective of diet, the line had only minor impacts on FA composition of tissues. In abdominal fat, the lean chickens had a higher percentage of MUFA (48.7% v. 43.9%, P=0.03) and lower percentages of C18:3 (1.9% v. 2.3%, P<0.01) and n-3 FA (1.9% v.2.3%, P<0.01) than the fat chickens. A significant interaction (P<0.05) between diet and line was observed for C16:1 with the fat-LL and lean-LL groups having the highest values and the fat-HL group having the lowest value (data not shown). In PM muscle, the lean chickens had a higher percentage of C18:1 (38.1% s. 36. 6%, P=0.03) and lower percentages of C18:2 (18.6% v. 19.9%, P<0.05) and n-6 FA (22.9% v. 24.3%, P=0.03) than the fat chickens. In SART muscle, the lean chickens had higher percentages of C18:1 (41.3% v. 39.9%, P=0.007) and MUFA (45.4% v. 43.7%, P<0.01) and lower percentages of C18:3 (1.7% v. 2.0%, P=0.04), PUFA (23.3% v. 25.7%, P<0.05) and n-6 (20.8% v. 22. 9%, P<0.05) and n-3 FA (2.5% v. 2.9%, P=0.03) than the fat chickens. The line had no effect on the FA composition of the liver but we observed significant interaction (P<0.05) between line and diet for different FA (data not shown). For C14:0, the fat-LL and lean-HL groups had higher values than the fat-HL group. For C16:1, the fat-LL and lean-LL groups had higher values than the fat-HL and lean-HL groups. For C20:4 and C22:6, the fat-HL group had the highest values and the fat-LL and lean-LL groups had the lowest values.
In the liver, chickens fed the HL diet had a higher protein content than chickens fed the LL diet (Table 11).
Discussion
Diets formulated at the same protein and ME contents but differing by energy source (lipids v. starch) did not alter the respective performance of genetically fat or lean chicken lines between 21 and 63 days of age. The accelerated ADG previously reported in chickens fed high-fat diets (Coon et al., Reference Coon, Becker and Spencer1981) probably reflected the higher energy content of these diets rather than the effects of lipids per se. Our data are therefore consistent with the hypothesis that the main determinant of growth performance is ME content rather than energy source (Coon et al., Reference Coon, Becker and Spencer1981). Importantly, the G : F ratio was not altered by diets, although the digestibility of lipids was lower for the LL diet than for the HL diet. Attention must be given to the fact that these digestibilities are given as apparent values. In LL diet, endogenous losses, proportionally greater than in HL one, may artificially reduce the value. Another explanation could be linked to the high level of wheat in LL diet compared with HL diet (40% v. 25%). Actually, wheat contains soluble NSP affecting all nutrients’ digestibility, and particularly the absorption of dietary lipids (Maisonnier et al., Reference Maisonnier, Gomez and Carré2001). The increase in villi and crypt area observed in the jejunum of chickens fed HL diet could result from the higher level of the poorly fermentable cellulose in this diet compared with LL diet (Goodlad et al., Reference Goodlad, Lenton, Ghatei, Adrian, Bloom and Wright1987). This could have favored the absorption of dietary lipids in chicken fed this high-fat high fiber diet. In the present study, AME was, however, similar in both diets, except at the beginning of the experimental period (28 days) when the chickens had to adapt their digestive physiology to face the cellulose load and the increased lipid intake induced by the ingestion of the HL diet.
The dietary energy source did not affect carcass composition after 6 weeks of experimental feeding. Similarly, Edwards and Hart (Reference Edwards and Hart1971), Bartov et al. (Reference Bartov, Bornstein and Lipstein1974) and Griffiths et al. (Reference Griffiths, Leeson and Summers1977) did not observe any differences in carcass composition resulting from the isocaloric substitution of dietary fat by carbohydrates. By contrast, Carew and Hill (Reference Carew and Hill1964) and Carew et al. (Reference Carew, Hopkins and Nesheim1964) showed that the isocaloric replacement of carbohydrates by maize oil had increased carcass energy retention in the form of fat. These discrepancies between studies could be explained by differences in the level of isocaloric replacement. Beside no effect on carcass composition, a dietary-induced difference was observed in hepatic weight in the present experiment; this was associated with a higher hepatic glycogen content in chickens fed the LL diet as compared with the HL diet, whereas protein content was higher with the HL diet and lipid content did not differ between diets. In support, the hepatic activity of LDH, an enzyme catalyzing an early step in neoglucogenesis from blood lactate, was also greater in chickens fed the LL diet than in those fed the HL diet. The situation in muscles was almost similar, with higher glycogen content in the SART muscle and a lower pHu in PM muscle (a postmortem indicator, which is highly negatively correlated with glycogen content at slaughter) for chickens fed the LL diet than for those fed the HL diet. The lack of dietary-associated difference in glycogen content in PM muscle, in this study, however, suggests that this temporary form of glucose storage might have been more rapidly used in PM than in SART muscle, likely due to differences in glycolytic enzymatic equipment and fiber type composition between these muscles (Rémignon et al., Reference Rémignon, Lefaucheur, Blum and Ricard1994). Beside glucose metabolism, we provide evidence that lipid metabolism was also slightly modified by diets. Indeed, chickens fed different diets had similar lipid contents in abdominal fat, liver and muscles, which suggests that they were able to synthesize FA from carbohydrates with almost the same efficacy than storing directly dietary fat in body tissues. In support to a direct deposition of lipids when feeding the HL diet v. hepatic synthesis and secretion of newly synthesized FA when fed the LL diet, is the composition of tissue lipids. Indeed, chickens fed HL diet had more PUFA, notably C18:2 and C18:3, and less C16:0, C16:1 and C18:1 (the main de novo synthesized FA) in all tissues compared with chickens fed the LL diet. Moreover, the activity of FAS enzyme was also lower in the liver, the main site of lipogenesis in birds, when chickens were fed the HL diet. The decreased FAS activity when fed an HL diet might be associated with its lower content of starch but also to its greater fiber content compared with the LL diet. Indeed, Akiba and Matsumoto (Reference Akiba and Matsumoto1982) have previously demonstrated that FAS activity in the liver of chickens is reduced by dietary cellulose. Conversely, the higher oxidative enzyme activities in the liver of chickens fed LL diet compared with chickens fed HL diet might have sustained the greater energy needs of hepatocytes for de novo lipid synthesis and lipid secretion to peripheral tissues. Although PUFA are more susceptible to lipid oxidation than other FA, the susceptibility of thigh muscle to lipid oxidation after storage at 4°C was not affected by diets.
It is noteworthy that the consequences of feeding diets with different energy sources were similar in both genetic lines regardless of their divergence for body fatness and energy metabolism. Indeed, the experimental lines had important difference in carcass fatness, in agreement with the selection criteria, and this line-associated difference was commensurate in both diets. The lean and fat lines also had contrasted growth performance. In agreement with earlier studies (see Baéza and Le Bihan-Duval, Reference Baéza and Le Bihan-Duval2013 for a review), the lean line had lower ADFI and ADG between 22 and 63 days of age but an improved gain to feed ratio compared with the fat line. However, the difference in ADFI between fat and lean lines (+12%) could not totally explain the large difference in abdominal fat deposition (2.8-fold higher in the fat line compared with the lean line). The better feed efficiency of lean chickens might be partly explained by the improved digestibility of dietary energy and lipids in that line compared with the fat line. As previously described (Sibut et al., Reference Sibut, Le Bihan-Duval, Tesseraud, Godet, Bordeau, Cailleau-Audouin, Chartrin, Duclos and Berri2008), lean chickens also displayed lower glycogen stores in the PM muscle, and the situation was similar for SART muscle in the present study. Interestingly, lactate content in the PM muscle was higher in lean than in fat chickens, suggesting a higher use of glycogen to produce energy by the anaerobic pathway. However, there was no line-associated difference in pHu of the breast meat, in contrast to Berri et al. (Reference Berri, Le Bihan-Duval, Baéza, Chartrin, Millet and Bordeau2005) who reported higher pHu in meat of the lean chickens than in fat chickens. This discrepancy between studies could be due to differences in the metabolic status of the birds, which were killed in a post-prandial state in the present study but after 8 h of feed withdrawal in the aforementionned experiment. Despite large difference in body fatness, there was no line-associated difference in tissue lipid contents. These observations are in close-agreement with the lack of differences previously reported for the same lines in intramuscular fat contents in breast and thigh muscles (Ricard et al., Reference Ricard, Leclercq and Touraille1983; Berri et al., Reference Berri, Le Bihan-Duval, Baéza, Chartrin, Millet and Bordeau2005). However, the line-associated differences in FA composition in tissues again argue for different lipid metabolism between lines. Indeed, the higher percentage of MUFA in abdominal fat and of C18:1 proportion in PM and SART muscles of the lean line, together with the lower percentages of C18:2 and n-6 FA in the PM muscle compared with fat chickens, suggest a lower ability of the lean line to synthesize and deposit PUFA and/or a higher oxidation of PUFA in this line. In support of this last hypothesis, the activities of HAD, enzyme implicated in the β-oxidation of FA, and CS, participating to tricarboxylic acid cycle in the mitochondria, were greater in the liver of the lean chickens compared with the fat chickens. In agreement, the hepatic β-oxidation of lipids has been shown to be higher for the lean line than for the fat line in the fed state (Skiba-Cassy et al., Reference Skiba-Cassy, Collin, Chartrin, Médale, Simon, Duclos and Tesseraud2007).
In conclusion, the amount of lipids stored in muscles and fatty tissues of lean or fat chickens did not depend on the dietary energy source. Only the FA composition of these lipids was affected. Moreover, the response to dietary energy source did not depend on the genetic ability for body fatness. Even if, in the present study, we used slow-growing chickens, our data should be applied to fast-growing chickens, more usually used for broiler meat production, and particularly during the finishing period (21 to 35 days of age). However, further evaluations of a variety of unusual feedstuffs with a wide range of nutrient composition are necessary before being able to conclude that broilers would be able to adapt well to high fat and high fiber diets. Actually, in the present study, the AME was lower and lipid digestibility was higher with diet presenting high lipid and high fiber contents compared with diet presenting low lipid content and high starch content.
Acknowledgments
The authors thank the staff of the INRA experimental poultry unit (UE1295 PEAT, Nouzilly, France) for producing and rearing animals and the technicians of the research units for measurements on birds, sample collection and laboratory analyses. This project was supported by the French ANR FatInteger program (ANR-11-BSV7-0004).