Introduction
The sex ratio question has been an area of growing research interest in population dynamics, especially in developing countries with respect to the issue of missing women. In human populations, the sex ratio is usually defined as the number of males per 100 females and varies by country and between different regions of the world. Globally, there were 3,707,206,000 males and 3,642,266,000 females in 2015, yielding a sex ratio of 101.8 males per 100 females (United Nations, 2015). In Africa, the sex ratio was 100.8 for North Africa, and for sub-Saharan Africa it was 100.0 males per 100 females, in 2015 (United Nations, 2015). In Zambia, the sex ratio was 95.4 in 2010 (Central Statistical Office, 2012) and was estimated at 99.7 in 2015 (United Nations, 2015).
Demographically, sex ratios are influenced by the population’s experiences of fertility, mortality and migration. In most populations, more males are born than females. Therefore, the sex ratio at birth is above 100 males per 100 female births. Over the life course, however, males have higher mortality rates at all ages than females do, such that by the age of 60 there are fewer males than females in most populations. Therefore, lower sex ratios of males per 100 females may indicate either higher adult male mortality or under-enumeration of males. Conversely, higher sex ratios of males per 100 females may point to either high female selective abortion or the presence of large numbers of migrant males in the population or under-enumeration of females (Coale, Reference Coale1991; Dyson, Reference Dyson2012; Bongaarts, Reference Bongaarts2013; Frost et al., Reference Frost, Puri and Hinde2013). Sex ratios are informative of a population’s age and sex structure and may reflect inequalities in mortality between males and females, and the effects of migration.
A typical demographic pattern of sex ratios observed in most populations is that of a progressive decline with an increase in age. A departure from this expected pattern beyond the plausible demographic experience of a population may be reflective of deficiencies in the data and require further investigation. Sex ratios are a sensitive indicator of changes in the male/female population composition. This makes them relevant as measures of the quality of age and sex data (Siegel & Swanson, Reference Siegel and Swanson2004).
According to the World Health Organization (WHO, 2015), there should be consistent sex ratios at birth across the human population, with approximately 105–107 male births per 100 female births. However, there are disparities in sex ratios across human populations. The disparity between the number of male and female births was first observed in 1662 by John Graunt (Reference Graunt1662). Since then, many studies have been conducted across countries to estimate sex ratios and determine why they differ from the expected sex ratio pattern (Coale, Reference Coale1991; Mayer, Reference Mayer1999; Klasen & Wink, Reference Klasen and Wink2003; Garenne, Reference Garenne2004; Hesketh & Xing, Reference Hesketh and Xing2006; Guilmoto, Reference Guilmoto2009; Dyson, Reference Dyson2012; Bongaarts, Reference Bongaarts2013; Frost et al., Reference Frost, Puri and Hinde2013).
Changes in sex ratios are affected by fertility, mortality and migration. With respect to mortality, in countries with high mortality, males are more vulnerable and tend to die more than females, which ultimately influences the pattern of sex ratios. Vallin (Reference Vallin, Caselli, Vallin and Wunsch2006) and Spoorenberg (Reference Spoorenberg2016) argued that men usually die in greater numbers than women largely due to exogenous factors. The influence of mortality on sex ratios partially helps to explain their variations across human populations.
In sub-Saharan Africa, studies have found variations in sex ratios, which tend to be below those of developed countries (Garenne, Reference Garenne2002, Reference Garenne2004; Dyson, Reference Dyson2012; Bongaarts, Reference Bongaarts2013; Schacht & Kramer, Reference Schacht and Kramer2016). For instance, Garenne’s (Reference Garenne2002, Reference Garenne2004) studies of sex ratios at birth in eastern and southern Africa found very low sex ratios in Bantu populations, which he attributed to genetic factors. Other studies have found that Black women give birth to more female children than male children (Garenne, Reference Garenne2004, Reference Garenne2008, Reference Garenne2009; Kaba, Reference Kaba2008).
Close examination of the sex ratios in the age group 0–6 years has revealed that socio-cultural practices in some societies affect the survival chances of female children (Boserup, Reference Boserup1970; Coale, Reference Coale1991; Hesketh & Xing, Reference Hesketh and Xing2006; Guilmoto, Reference Guilmoto2009; Dyson, Reference Dyson2012; Bongaarts, Reference Bongaarts2013). Phillips et al. (Reference Phillips, Anderson and Tsebe2003), using South African census data from 1970–1996, found a deficiency of males in the young age group (20–35 years), as evidenced by low sex ratios.
Therefore, examining variations in sex ratios is relevant, not only for data quality purposes, but also in seeking to understand the observed unusual patterns of sex ratios in human populations as influenced by both current and historical changes in fertility, mortality and migration.
In Zambia, an unusual demographic pattern of higher sex ratios above 100 at older ages has been observed from both census and survey data, indicating more males than females at these ages (Central Statistical Office, 2012). Few studies, however, have attempted to examine the pattern of these sex ratios and provide possible explanations for the observed variations. In addition, none has examined the trend and historical pattern of sex ratios for the period 1969 to 2014 by utilizing all the available national census and survey data in Zambia. Therefore, this study sought to determine whether the sex ratio variations observed over the stated period in the population were due to data deficiencies or attributable to other events.
The study contributes to demographic knowledge in understanding sex ratio patterns in sub-Saharan African populations. The study findings are relevant to policymakers and practitioners tasked with the responsibility of improving the quality of data collection systems and providing evidence-based data for socioeconomic development planning.
Methods
Study setting
Zambia is a landlocked sub-Saharan African country that shares its borders with eight countries: Angola, Botswana, Congo DRC, Malawi, Mozambique, Namibia, Tanzania and Zimbabwe. The census projections for 2014 estimated the country’s population to be 15 million, with females constituting 51% and males 49% (Central Statistical Office, 2013b).
Data
To examine sex ratios in Zambia, a wide range of cross-sectional data sources (censuses and surveys) conducted from 1969 to 2014, after Zambia’s independence in 1964, were used. This approach enabled sex ratios to be examined over a long period to establish trends. Census datasets and descriptive/statistical tabulation tables were used for the years 1969, 1974 (sample census), 1980, 1990, 2000 and 2010 (Central Statistical Office, 1973, 1979, 1985, 1995, 2005a, 2012). The datasets were obtained with permission from the Central Statistical Office of Zambia. The Census of Population and Housing is conducted once every 10 years by the Central Statistical Office as per the legal requirements of the laws of Zambia and international obligation under the United Nations. The census, undertaken according to the criteria set by the United Nations, covers the whole country and collects demographic, social and economic information from every individual in households and institutions in the country.
Living Conditions and Monitoring Survey (LCMS) datasets were also used, obtained with the permission of the Central Statistical Office for the years 1996, 1998, 2002/3, 2004 and 2006 (Central Statistical Office, 1997, 1999, 2003, 2005b, 2007). The 2010 and 2015 LCMS datasets were not available for the study. The LCMS is conducted by the Central Statistical Office to monitor the living conditions and social welfare of the population. The LCMS collects information on age, sex, marital status, orphanhood, mortality, migration, general health, child health and nutrition, income, household assets, household amenities and housing conditions, household access to facilities, household expenditure, poverty, economic activities, education and community development issues, among other topics.
The second survey used was the Zambia Demographic and Health Survey (ZDHS). The ZDHS datasets were downloaded with the permission of the Demographic and Health Survey (DHS) programme website for the years 1992, 1996, 2001/2, 2007 and 2013/14 (Gaise et al., Reference Gaise, Cross and Nsemukila1993; Central Statistical Office et al., 1997, 2003; Central Statistical Office et al., 2009, 2014). The ZDHS is part of the global programme of demographic and health surveys conducted every 5 years by the DHS programme. It is a nationwide survey that collects information on demographic (e.g. age, gender, fertility and mortality) and health issues (e.g. HIV/AIDS, nutrition, tuberculosis, sexually transmitted infections and malaria) based on a nationally selected representative sample. Both the LCMS and ZDHS datasets were weighted using the svy Stata command to account for the survey sampling design and to ensure that the samples were representative of the entire population. Stata 14 was utilized to extract and export data and tables from the datasets to Microsoft Excel for overall analysis and charting.
In addition, the study used census analytical reports for Botswana (Statistics Botswana, 2014), Lesotho (Bureau of Statistics, 2009), Malawi (National Statistical Office, 2009), South Africa (Statistics South Africa, 2012, 2015) and Zimbabwe (Zimbabwe National Statistics Agency, 2013) to obtain population age–sex distributions from which the age-specific sex ratios were computed for comparison with the Zambian sex ratios in the population.
Analytical methods
A standard method of computing the sex ratio as males per 100 females was used (Newell, Reference Newell1997; Preston et al., Reference Preston, Heuveline and Guillot2001; Siegel & Swanson, Reference Siegel and Swanson2004):
 $${{{P_m}} \over {{P_f}}} \times 100$$
where Pm is the number of males, and Pf is the number of females. The sex ratio was utilized because it is a principal measure of sex composition in demographic analysis. It is also a more sensitive indicator of changes or differences in sex composition due to its relatively smaller base. The point of balance of the sex ratio is 100. Therefore, a sex ratio above 100 implies an excess of males, and one below 100 indicates an excess of females. Age-specific sex ratios, and sex ratios for urban–rural residence, provinces and for the whole population were computed. Sex ratios computed using census data are more stable and reliable than those derived from survey data because a census is larger in magnitude and collects data across the whole country.
Cohort survival ratios (Newell, Reference Newell1997; Preston et al., Reference Preston, Heuveline and Guillot2001; Siegel & Swanson, Reference Siegel and Swanson2004) were estimated using census data to trace synthetic cohorts and look for irregularities in age reporting. Demographically, it is expected that cohort survival ratios will gradually progressively decline with an increase in age and should not be greater than 1. Any departure from this expected pattern in the absence of any historical events or migration will reflect irregularities in the age–sex data. In Zambia, at national level, migration has generally been negligible, although in the late 1960s and 1970s, during the independence liberation wars in southern Africa, there was an influx of refugees from countries such as Angola, Mozambique, Namibia and Zimbabwe (Central Statistical Office, 2013a) and migrant workers in the mines (Adepoju, Reference Adepoju1998). However, for young adults this might not be the case.
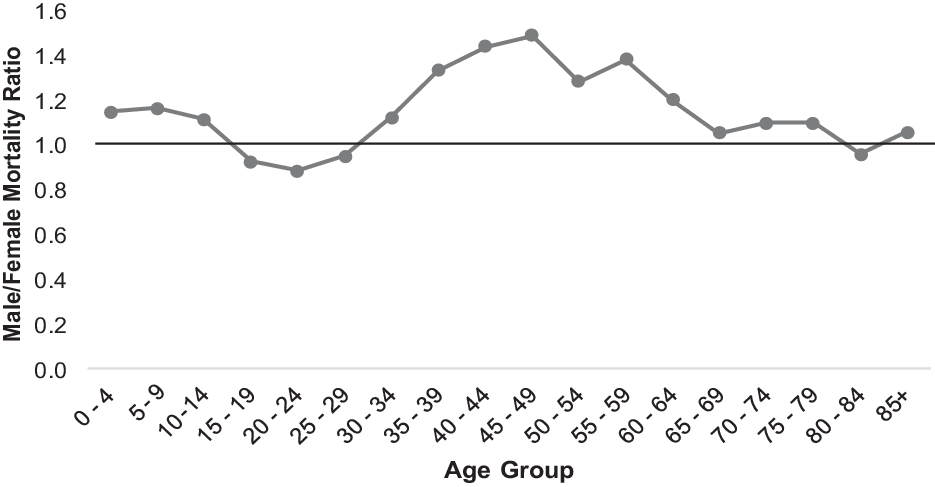
Male mortality relative to female mortality was compared by computing and plotting mortality ratios for the 2010 census, which had the most complete age and sex data on household deaths. Mortality ratios greater than 1 indicate higher male mortality.
The patterns of sex ratios based on the data sources were also examined to determine similarities and variations between census- and survey-derived sex ratios because surveys use censuses as sampling frames.
Results
Levels and trends of sex ratios
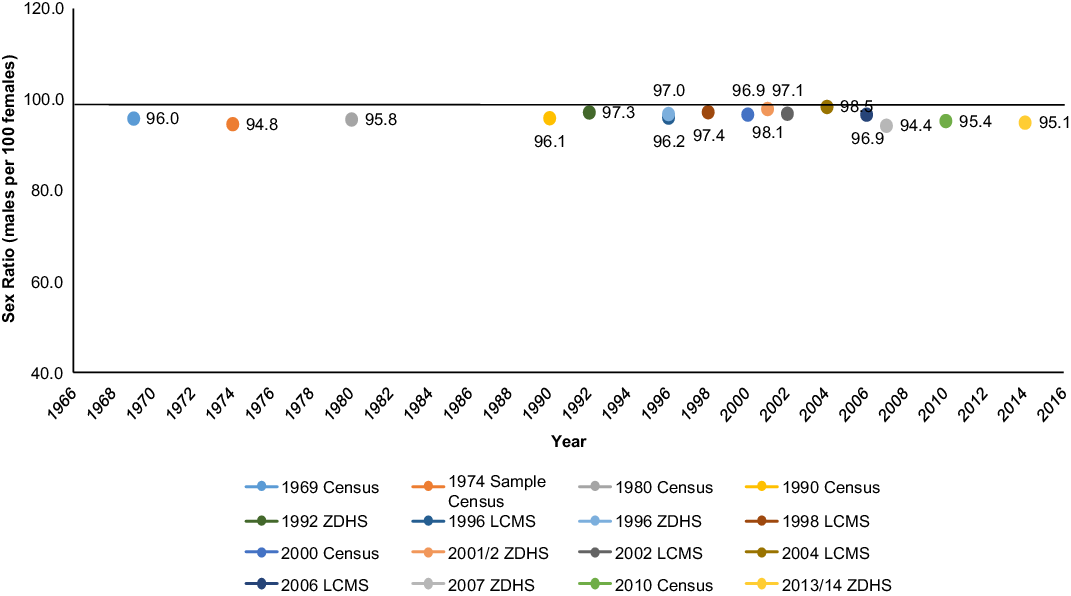
The overall sex ratios derived from the censuses and surveys in Zambia were consistently below 100 for the period 1969–2014 (Fig. 1). In other words, Zambia’s population has been predominantly female. However, the sex ratios varied over the study period, ranging from a low of 94.4 males per 100 females to a high of 98.5 males per 100 females, with an average of 96.4 males per 100 females.
Trend in overall sex ratios, Zambia 1969–2014. Sources: Central Statistical Office (1973, 1995, 2005a, 2012): 1969, 1980, 1990, 2000 and 2010 Censuses of Population and Housing; Gaise et al. (Reference Gaise, Cross and Nsemukila1993); 1992 Zambia Demographic and Health Survey, Central Statistical Office et al. (1997, 2003, 2009, 2014): 1996, 2001/2, 2007 and 2013/2014 Zambia Demographic and Health Surveys; Central Statistical Office (1997, 1999, 2003, 2005b, 2007); 1996, 1998, 2002/3, 2004, and 2006 Living Conditions Monitoring Surveys.

Patterns of age-specific sex ratios
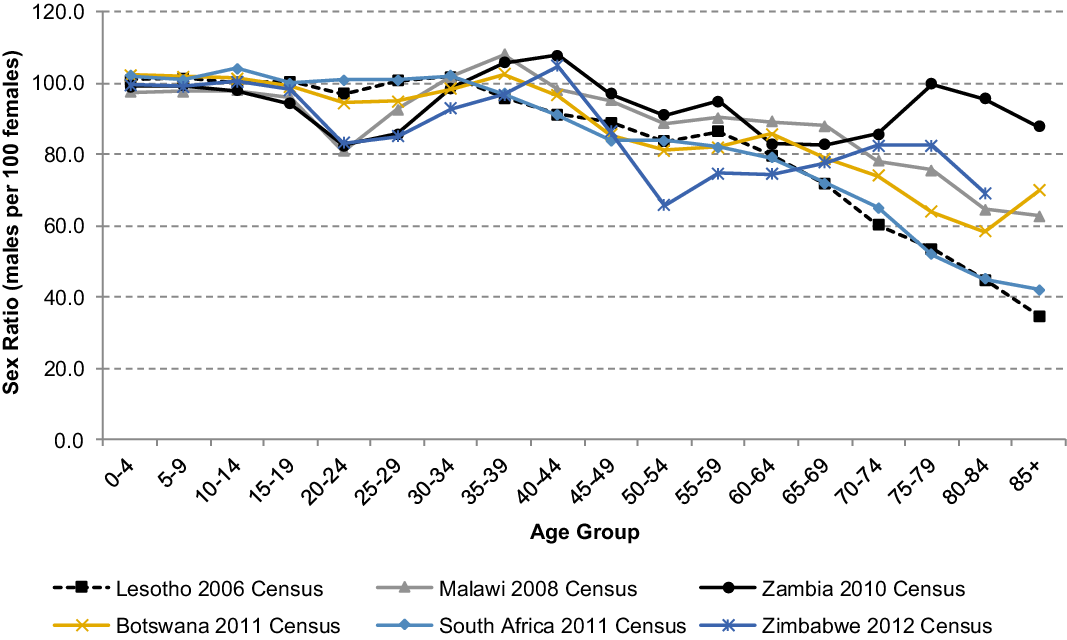
Figure 2 compares the sex ratios of selected Southern African Development Community (SADC) member countries with those of Zambia. It is evident that the sex ratios for Lesotho and South Africa conform to the expected demographic pattern of gradually declining with increasing age. For Zambia, the sex ratios do not conform to the expected pattern after the 60–64 years age group and above. Rather than continue to gradually decline they instead increase sharply for the age group 75–79 years then decrease for age 85 and above, indicating a possible under-enumeration of females at older ages. Moreover, for the 20–34 years age group, there was a significant deficiency of young males in Malawi, Zambia and Zimbabwe.
Comparison of Zambia and selected SADC countries’ census age-specific sex ratios, 2006–2012. Sources: Bureau of Statistics (2009); National Statistical Office (2009); Central Statistical Office (2012); Statistics Botswana (2014); Statistics South Africa (2012, 2015); Zimbabwe National Statistics Agency (2013).

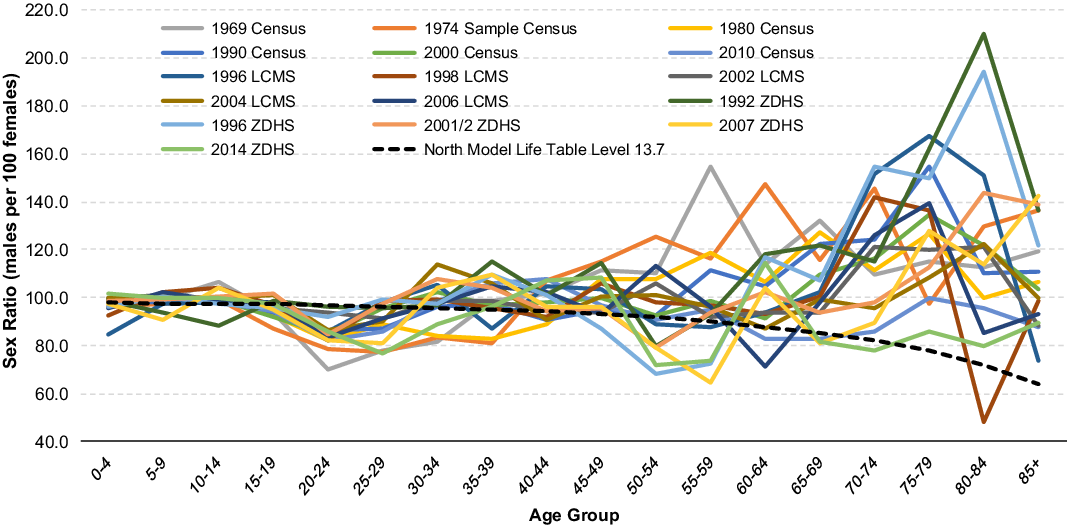
With respect to age-specific sex ratios, it was expected that they would be higher for infant ages because there are more males than females at birth. Sex ratios then progressively decline to very low levels at older ages, when female mortality is much lower than male mortality. Figure 3 shows that not all sex ratios conform to the expected pattern of declining progressively with an increase in age. Coale-Demeny North model life tables were used to illustrate the expected pattern of age-specific sex ratios (Coale & Demeny, Reference Coale and Demeny1966; Coale et al., Reference Coale, Demeny and Vaughan1983). These have been used in previous studies to represent mortality patterns in Zambia, but there is a limitation with these models as they do not account for the HIV epidemic. Irrespective of the type of data source from which the sex ratios were derived – whether census or survey – they all displayed heavy fluctuations, with significant noise in the data across all age groups. The fluctuations were more pronounced at ages 60 years and above. These fluctuations are an indication of the presence of omission errors (under-enumeration) or over-enumeration of either males or females, age misreporting, age exaggeration or in-and-out migration.
Sex ratios by 5-year ages groups, Zambia 1969–2014. Sources: Central Statistical Office (1973, 1995, 2005a, 2012): 1969, 1980, 1990, 2000 and 2010 Censuses of Population and Housing; Gaise et al. (Reference Gaise, Cross and Nsemukila1993); 1992 Zambia Demographic and Health Surveys, Central Statistical Office et al. (1997, 2003, 2009, 2014): 1996, 2001/2, 2007 and 2013/2014 Zambia Demographic and Health Surveys; Central Statistical Office (1997, 1999, 2003, 2005b, 2007); 1996, 1998, 2002/3, 2004, and 2006 Living Conditions Monitoring Surveys.

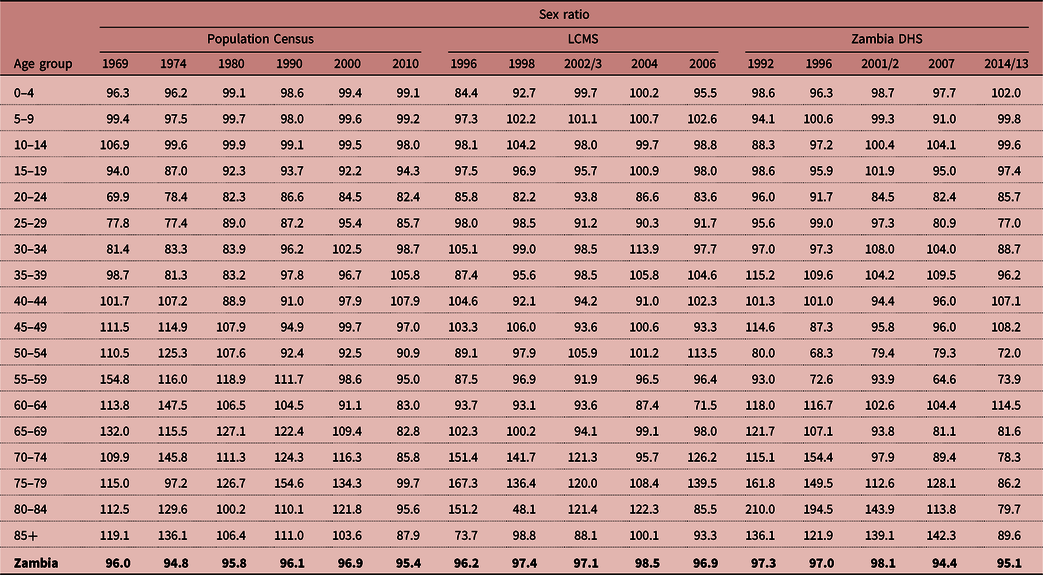
Figure 3 shows that both the censuses and surveys reported sex ratios in the population aged 0–4 that were consistently below 100, except for the 2013/2014 ZDHS, with a sex ratio of 102 males per 100 females (Table 1). There was a deficit of young males in the age group 15–19 years to the age group 30–34 years across all data sources. This was more pronounced in the 20–29 years age group. From the age group 50–54 years up through older ages, there was significant noise in the data and fluctuations in the sex ratios.
Sex ratios by 5-year age group estimated from censuses and surveys, Zambia, 1969–2014

Sources: Central Statistical Office (1973, 1995, 2005a, 2012): 1969, 1980, 1990, 2000 and 2010 Censuses of Population and Housing; Gaise et al. (Reference Gaise, Cross and Nsemukila1993), 1992 Zambia Demographic and Health Survey; Central Statistical Office et al. (1997, 2003, 2009, 2014): 1996, 2001/2, 2007 and 2013/2014 Zambia Demographic and Health Surveys; Central Statistical Office (1997, 1999, 2003, 2005b, 2007); 1996, 1998, 2002/3, 2004, and 2006 Living Conditions Monitoring Survey (LCMS).
However, there appeared to be an excess of males in older ages, particularly after the age group 60–64 years. For the censuses, sex ratios above 100 were observed for the age group 40 years and above in 1969, 45 and above in 1980, 55 years and above in 1990 and 65 years and above in 2000. A systematic pattern of consistently high sex ratios above 100 transitioning every 10 years from one census to the next from the 1969 census to the 2000 census was observed. A similar pattern was mirrored by the ZDHS surveys. The 1992 survey had sex ratios above 100 in the age groups 35–49 years and 60 years and above, whereas the 1996 survey had sex ratios above 100 in the age groups 35–44 years and 60 years and above. The 2001/2 and 2007 surveys had sex ratios above 100 in the age groups 39–59, 60–64 years and 75 years and above. The 2013/14 survey only had sex ratios above 100 in the age groups 0–4, 40–49 and 60–64 years. The LCMS surveys also showed an excess of males but not as systematically as in the censuses and ZDHS. Only at older ages was there a consistent pattern in sex ratios above 100; for the 1996 LCMS, the pattern was in the age group 65–84 years; for the 1998 LCMS, the age group 65–79 years; for the 2002/3 LCMS, the age group 70–84 years; for the 2004 LCMS, the age group 75–84 years; and for the 2006 LCMS, the age group 70–79 years.
Mortality ratios
Male-to-female mortality ratios based on the 2010 census death data were used to validate the effect of mortality on the observed sex ratio patterns. Figure 4 shows the ratio of male mortality to female mortality in 2010; there was a high child mortality of males in the 0–4 years age group and high mortality in the 5–9 and 10–14 years age groups. Female mortality exceeded male mortality between the 15–19 and 25–29 years age groups. The figure also shows high male adult mortality between the 25–29 and 55–59 years age groups. Particularly high adult male mortality was evident between the 35–39 and 55–59 years age groups, with a peak in the 45–49 years age group. The effect of high male mortality in these age groups was reflected in the pattern of the sex ratios. However, under-reporting of household deaths for either sex or certain age groups may be a possible reason for the observed mortality ratios.
Ratio of male to female mortality by age, Zambia 2010. Source: authors’ computations using 2010 Censuses of Population and Housing.

Synthetic cohort survival ratio analysis
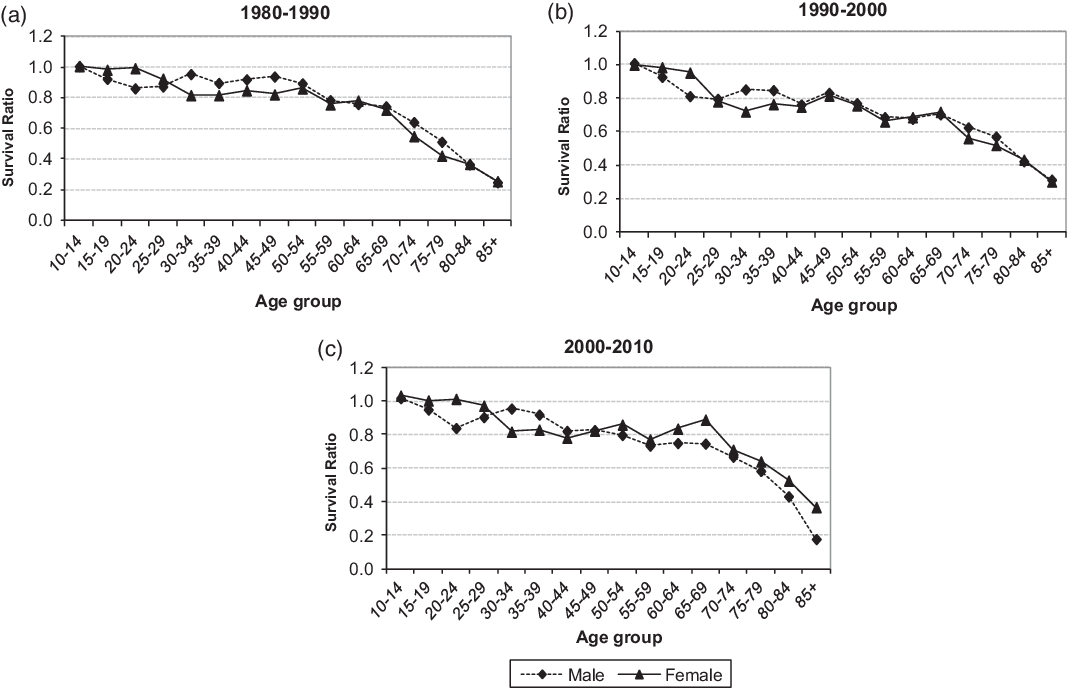
Cohort survival ratios show the probability of individuals surviving from one age group to the next. The survival ratios of synthetic cohorts from censuses are shown in Figure 5. Similar to sex ratios, in the absence of significant migration and adverse events affecting the population, cohort survival ratios were expected to gradually decline continuously with an increase in age up to the older ages. Fluctuations or erratic cohort survival ratios indicate distortions or irregularities in the data that could be due to age misreporting, under-enumeration or over-enumeration of some age groups. Cohort survival ratios would also be expected to be higher for females than for males because mortality favours females. Cohort survival ratios for the period 1980–1990 showed fluctuations for both males and females. Higher survival ratios for males were observed between the 25–29 and 45–49 years age groups. The 1990–2000 and 2000–2010 cohort survival ratios also fluctuated, with higher ratios for males in the 25–39 years age group.

In 1980–1990 and 1990–2000 the cohort survival ratios for males aged 70–79 years were unexpectedly higher, indicating an apparently lower mortality for males than females. This may indicate an under-enumeration of females in the stated age group. In addition, excess male mortality at age 50 years and above was anticipated to be exhibited by the cohort survival ratios due to the impact of the HIV/AIDS epidemic on mortality, but this was not the case for the two stated decades. However, this was observable in the period 2000–2010 as the cohort survival ratios were lower for males than females for age 50 years and above.
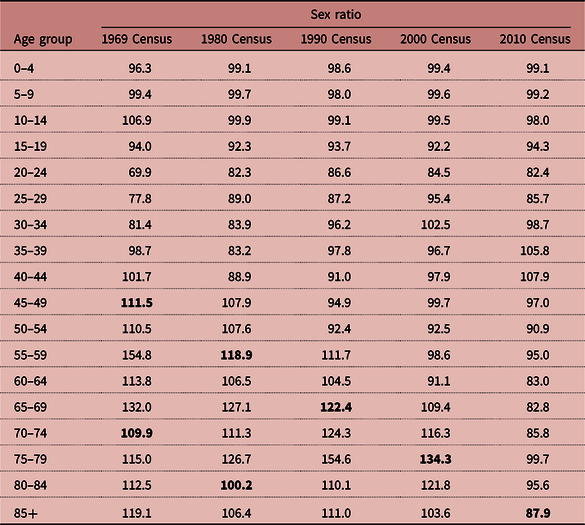
Table 2 shows that the sex ratio for the age group 0–4 years has continued to be less than 100, at 96.3 in 1969 to 99.1 in 2010. Sex ratios for age group 5–9 years have remained consistent across all the censuses, except for the 1990 census. Examining each individual census in Table 2, it is evident that in the 1969 census there were serious age and sex reporting irregularities, as shown by the huge fluctuations in the sex ratios by age group. Males in age group 20–24 years were seriously under-enumerated, as shown by the lowest recorded sex ratio of 69.9 males per 100 females. In age group 55–59 years, females were under-enumerated, as evidenced by the high sex ratio of 154.8. This could also have resulted from age misreporting among women in this age group. From age group 40–44 to 85+, the sex ratios were consistently above 100 for the 1969 census. This pattern continued in 1980 but commencing from age group 45–49 to 85+. Sex ratios for the 1980 census also fluctuated by age group, reflecting irregularities. For the 1990 census, sex ratios that are above 100 started from the age group 55–59 to 85+. The highest sex ratio was 154.6 for the age group 75–79, an indication of over-enumeration of males. In the 2000 census, sex ratios above 100 began from age group 65–69 to 85+. Fluctuations in sex ratios were also evident in the 2000 census. Age group 20–24 showed an under-enumeration of males while there was an over-enumeration of males in the age group 30–34. The 2010 census also under-enumerated young adult males in the age group 20–24 and over-enumerated males in age groups 35–39 and 40–44. Irregularities were also evident in the 2010 census data, as shown by the fluctuating sex ratios.
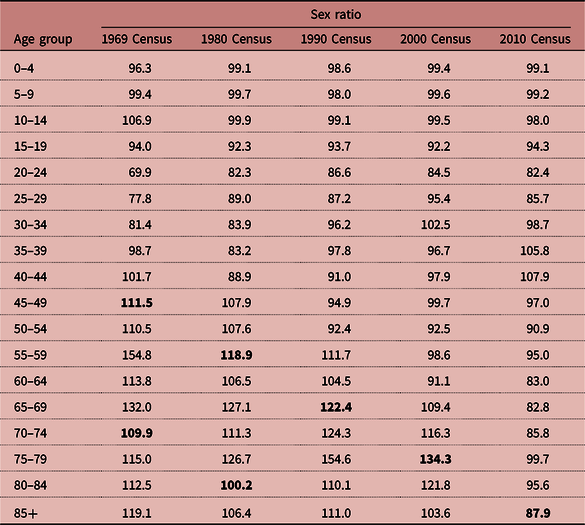
A pattern of sex ratios that were above 100 – more males than females – emerged when synthetic cohorts of those in the age group 45–49 years and above were followed, and in 1980 when they were in the age group of 55–59 years and above; in 1990, 10 years later, the sex ratios remained dominated by men (Table 2). In 2000, when they were in the age group 65–69 years and above, there were still more males than females. However, when the synthetic cohorts were in the age group 75–79 years and above in 2010, the sex ratios decreased to below 100, meaning there were more females in the older ages than males. A close follow-up of these synthetic cohorts from the 1969 census to the 2010 census showed that there appeared to be an unusual demographic pattern of sex ratios, either due to under-enumeration of females or age misreporting of both males and females in 1969, that continued until the 2010 census, when the sex ratios declined below 100.
Discussion
The objective of the study was to examine the trends and patterns of sex ratios and their implications in Zambia. Using a wide range of available data sources – that is, censuses and surveys – the study has presented an extensive demographic analysis of sex ratios from 1969 to 2014 in the country. Clear evidence of extremely high sex ratios above 100 at ages 40 years and above from the 1969 census up to the 2000 census, which were also mirrored by the surveys, was found. An irregular pattern of sex ratios that did not conform to the expected norm in the demographic literature was found, which is an indication of omissions or undercounting of women and differential age misreporting or differential undercount between men and women in data collection systems in Zambia.
Throughout the analysis of the various types of data sources (censuses and surveys), the study has shown that there was an undercount of mobile young adult males in the 20–34 years age group. Zambia should, therefore, find a means of reducing the undercount of this particular age group by improving the data collection systems. This finding is consistent with previous studies that found low sex ratios among younger working ages (20 to 35 years) in most populations of the world (Phillips et al., Reference Phillips, Anderson and Tsebe2003; Smallwood & De Broe, Reference Smallwood and De Broe2009; Dyson, Reference Dyson2012). The most common reason that has been advanced to explain this phenomenon is that young men and women are geographically mobile in search of employment opportunities and are mostly missed in census enumerations because they are habitually absent from their dwelling places, resulting in the under-enumeration of this particular age group. Other studies have opined that young men are more likely to be under-enumerated in a census than are their counterpart younger females because they are more mobile and maintain weak contact with their families (Phillips et al., Reference Phillips, Anderson and Tsebe2003; Dyson, Reference Dyson2012). Young females are less mobile and tend to be at home with their families more, so the under-enumeration of young males results in low sex ratios.
A persistent and consistent trend of overall below-100 sex ratios from 1969 to 2014 was found, reinforcing the female dominance of the population in Zambia. This finding confirms what previous studies have found – that sex ratios in southern Africa are low and below 100 (Sen, Reference Sen1992; Garenne, Reference Garenne2004, Reference Garenne2008, Reference Garenne2009). Consistent with previous studies, sex ratios below 100 in the 0–4 years age group were found, which could be attributed to under-enumeration of boys in this age group or differential age misreporting of children by both censuses and surveys. Garenne (Reference Garenne2004), however, argued that the Bantu African women of southern Africa give birth to more female children than male children resulting in a low sex ratio at birth. He further argued that data errors are not the only reason why sex ratios are below 100 in the 0–4 years age group in southern Africa; in comparison, West African sex ratios in this same age group are above 100. Other studies conducted in the US and Nigeria found that Black women give birth to more female children than White women do (Kaba, Reference Kaba2008; Branum et al., Reference Branum, Parker and Schoendorf2009). Thus, sex ratios at birth for Black populations might not always be above 100, as in White populations.
All the censuses and surveys displayed a similar pattern of sex ratios that did not conform to the expected demographic pattern. It appears that misreporting errors plaguing the censuses also affect the surveys. A comparison of Zambia’s pattern of sex ratios with those of SADC member countries clearly shows that the pattern of sex ratios deviates from those of Lesotho and South Africa. The explanation is that the data are plagued with distortions attributed to age misreporting, undercounting or over-enumeration.
The study found that the pattern of cohort survival ratios corroborated that of sex ratios. Furthermore, systematic synthetic cohorts that can be traced from the 1969 census to the 2000 census with sex ratios that are above 100 were observed; however, these cohorts were phased out in the 2010 census. After Zambia’s independence in 1964, the 1969 census was the most complete and comprehensive enumeration, covering all races and parts of the country; previous censuses only enumerated the White population. It is possible that, due to low levels of education in the said cohorts (40 years and above), the ages reported during the census were ‘guesstimates’ and the census continued reporting these ‘guesstimate’ ages in each subsequent census up to 2010. Due to mortality, which favours females, up until 2010 these sex ratios changed to be female-predominant. The other possible explanation is that there was age shifting by both males and females; males could have overstated their ages, whereas females could have understated their ages. Males have a tendency to report older ages so that they are considered older, whereas females report younger ages to appear young. However, other scholars have provided an alternative explanation – that the population might have experienced heavy mortality of females at some point (Garenne, Reference Garenne2004, Reference Garenne2009).
Extremely high male mortality was observed between the ages of 35 and 59 years, with a peak in the age group 45–49 years, as indicated in the male/female mortality ratios, and which was also reflected in the sex ratios. The finding corroborates that of the 2013/2014 ZDHS, which found higher male mortality than female mortality in the 40–44 and 45–49 years age groups, with the peak being the 45–49 years age group. HIV prevalence rates were also highest in this age group (Central Statistical Office et al., 2014; Cook et al., Reference Cook, Hayden, Weiss and Jones2014; Banda et al., Reference Banda, Fylkesnes and Sandøy2015). Previous studies have shown that HIV/AIDS-related deaths are an important factor affecting not only the age composition, but also the sex ratios of deaths – specifically, adult sex ratios in the affected age groups (Reniers et al., Reference Reniers, Masquelier, Gerland, Rogers and Crimmins2011; Masquelier et al., Reference Masquelier, Eaton, Gerland, Pelletier and Mutai2017). In southern Africa, more women than men are HIV positive, and the most affected age groups in terms of AIDS mortality are 30–34 years for women and 40–44 years for men.
The availability and quality of demographic data require improvement in Zambia. There is a need to further minimize content and coverage errors during data collection when conducting a census or survey. The use of Computer-Assisted Personal Interviewing (CAPI) technology would help in improving the quality of age and sex data collected in censuses and surveys. Equally important is the quality of training of the enumerators as well as the quality control measures put in place when collecting the data. Furthermore, development assistance for strategic information for Sustainable Development Goals and civil registration and vital statistics systems is one of the avenues that could help improve the availability and quality of demographic data in Zambia.
The study contributes to demographic knowledge and the literature on sex ratios by, first, providing explanations of why the pattern of sex ratios in Zambia does not conform to the expected demographic pattern; this discrepancy is primarily because of inherent data deficiencies attributable to age misreporting and under-enumerations. Second, it found a systematic pattern of high sex ratios above 100 in the form of cohorts that can be traced to the 1969 census, that can be transitioned to the 2000 census and that returned to lower, below-100 sex ratios in the 2010 census. The study limitation is that it used cross-sectional data; therefore, causality cannot be inferred based on these data.
In conclusion, the study has shown that Zambia’s sex ratios are predominantly female: that is, below 100. The study has provided explanations for why Zambia’s sex ratios do not conform to the expected demographic pattern. This discrepancy is primarily due to inherent data deficiencies attributed to age misreporting and under-enumeration. However, on a positive note, the 2010 census suggests the possibility that in the future, the sex ratios might conform to the expected pattern, because there is improvement in data quality. The study found a consistent undercount of the young adult males in the age group of 20–34 years in all censuses and surveys from 1969 to 2014. A systematic pattern of high male/female sex ratios above 100 was found that is traceable from the 1969 census to the 2000 census and returned to low sex ratios in the 2010 census. The study found differential mortality by sex, high female mortality in age group 20–29 years and extremely high male adult mortality in the age group 35–59 years that might be attributable to HIV/AIDS in 2010. Women are more at risk of contracting HIV at younger ages due to low literacy levels compared with men; high gender-based violence also makes it difficult for them to negotiate for safer sex; and also, a higher probability of younger women having elderly men as sexual partners who may already be infected with HIV. It is notable also that prior to the AIDS epidemic, the pattern of mortality was probably very different and shaped the sex ratios by age up to about 1990.
The study shows that there are problems in the collection and reporting of demographic data by censuses and surveys in Zambia. There is need, therefore, for strategies and interventions to improve the quality of data collection systems if the populations that are usually prone to under-enumeration are to be adequately planned for in terms of their socioeconomic needs.
Acknowledgments
The authors are grateful to the Central Statistical Office in Zambia and the Demographic and Health Survey Program for allowing access to the datasets.
Funding
This research received no specific grant from any funding agency, commercial entity or not-for-profit organization.
Conflicts of Interest
The authors have no conflicts of interest to declare.
Ethical Approval
The authors assert that all procedures contributing to this work comply with ethical standards of the relevant national and institutional committees on human experimentation.