





1 Introduction
Diffusive processes leading to bubble formation are present in many different situations, such as gas-driven volcanic eruptions (Liu & Zhang Reference Liu and Zhang2000), bubble growth in porous media (Li & Yortsos Reference Li and Yortsos1995) affecting, among others, oil production (Akin & Kovscek Reference Akin and Kovscek2002), bubbles emerging in carbonated beverages (Bisperink & Prins Reference Bisperink and Prins1994; Liger-Belair, Voisin & Jeandet Reference Liger-Belair, Voisin and Jeandet2005; Uzel, Chappell & Payne Reference Uzel, Chappell and Payne2006) such as beer (Lee, McKechnie & Devereux Reference Lee, McKechnie and Devereux2011) and the recently discovered nanobubbles (Lohse & Zhang Reference Lohse and Zhang2015). Several different physical processes affect bubble nucleation and growth in all these situations: diffusion, history effects (Peñas-López et al. Reference Peñas-López, Parrales, Rodríguez-Rodríguez and van der Meer2016, Reference Peñas-López, Moreno Soto, Parrales, van der Meer, Lohse and Rodríguez-Rodríguez2017; Chu & Prosperetti Reference Chu and Prosperetti2016), electrolysis (Verhaart, de Jonge & van Stralen Reference Verhaart, de Jonge and van Stralen1979; Sillen et al. Reference Sillen, Barendrecht, Janssen and van Stralen1982), catalysis (Somorjai & Li Reference Somorjai and Li2010), ultrasound (Stricker et al. Reference Stricker, Dollet, Fernández Rivas and Lohse2013) and others. In view of these and many other occurrences, the study of bubble diffusive growth has been actively pursued for a long time, starting with the seminal works by Epstein & Plesset (Reference Epstein and Plesset1950), Scriven (Reference Scriven1959) and others. More recently, due to new developments in experimental techniques (see e.g. Enríquez et al. Reference Enríquez, Sun, Lohse, Prosperetti and van der Meer2014) and new applications, such as energy generation by chemical reactions (Oehmichen, Datsevich & Jess Reference Oehmichen, Datsevich and Jess2010), the topic has been the object of renewed attention.
In most previous studies, the long-term effects due to the gas depletion of the volume surrounding a bubble nucleation site have not been studied in detail. Although this depletion has limited effects on electrolytic bubble growth (Verhaart et al. Reference Verhaart, de Jonge and van Stralen1979; Sillen et al. Reference Sillen, Barendrecht, Janssen and van Stralen1982), where gas is continuously generated, it has very marked consequences in the situation in which the overall initial dissolved gas concentration in the liquid is fixed. In this article, we qualitatively and quantitatively deal with gas depletion effects when successive bubbles quasi-statically grow by diffusion on a silicon chip. We follow the growth of several tens of bubbles from the same nucleation site. Due to the small mass diffusivity of gases in liquids, this process is very slow and each bubble takes many minutes to grow to its final radius before detaching due to buoyancy. We will however find that also convective effects, which less surprisingly appear in strongly supersaturated gas–liquid solutions (Kuchmaand, Gor & Kuni Reference Kuchmaand, Gor and Kuni2009; Kuni, Kuchma & Adjemyan Reference Kuni, Kuchma and Adjemyan2009), also play a very subtle but dominant role towards the end of the bubble growth for a weak supersaturation level.
From a modelling point of view, the pure diffusion-driven growth of a spherical gas bubble in an infinite supersaturated liquid is a well-known problem whose dynamical equation has the following form (Epstein & Plesset Reference Epstein and Plesset1950):
 $$\begin{eqnarray}\frac{\text{d}R}{\text{d}t}=D\frac{c_{s}}{\unicode[STIX]{x1D70C}_{g}}\left(\frac{1}{R}+\frac{1}{(\unicode[STIX]{x03C0}Dt)^{1/2}}\right)\unicode[STIX]{x1D701},\end{eqnarray}$$
where
 $D$
is the diffusion coefficient,
 $c_{s}$
is the dissolved gas concentration by mass at the bubble surface,
 $\unicode[STIX]{x1D70C}_{g}$
is the gas density in the bubble and
 $\unicode[STIX]{x1D701}$
is the supersaturation level, defined as
 $$\begin{eqnarray}\unicode[STIX]{x1D701}=\frac{c_{0}-c_{s}}{c_{s}},\end{eqnarray}$$
with
 $c_{0}$
being the ambient dissolved gas concentration in the liquid. This equation can be readily solved by defining two dimensionless variables, namely
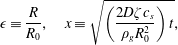 $$\begin{eqnarray}\unicode[STIX]{x1D716}\equiv \frac{R}{R_{0}},\quad x\equiv \sqrt{\left(\frac{2D\unicode[STIX]{x1D701}c_{s}}{\unicode[STIX]{x1D70C}_{g}R_{0}^{2}}\right)t},\end{eqnarray}$$
where
 $R_{0}$
is a reference radius which Epstein & Plesset (Reference Epstein and Plesset1950) identify with the initial bubble radius. The simplified solution can be written as
 $$\begin{eqnarray}\unicode[STIX]{x1D716}\approx (\unicode[STIX]{x1D6FE}+(1+\unicode[STIX]{x1D6FE}^{2})^{1/2})x\equiv Sx,\end{eqnarray}$$
where
 $\unicode[STIX]{x1D6FE}=\sqrt{\unicode[STIX]{x1D701}c_{s}/2\unicode[STIX]{x03C0}\unicode[STIX]{x1D70C}_{g}}$
. As mentioned before, this solution is valid for a bubble growing in an unbounded domain, or in other words, an infinite bulk. The dynamical equation (1.1) needs to be modified when the bubble grows on a solid surface, which changes the boundary conditions to be applied to the solution of the diffusion equation (Stricker et al.
Reference Stricker, Dollet, Fernández Rivas and Lohse2013). Enríquez et al. (Reference Enríquez, Sun, Lohse, Prosperetti and van der Meer2014) approximated the effect of the solid surface by introducing the concept of an effective area through which gas diffuses into the bubble. In their experiment, the bubble grew out of a pit of radius
 $R_{p}$
on the solid surface. They set
 $R_{0}=R_{p}$
in (1.3) and found:
 $$\begin{eqnarray}\unicode[STIX]{x1D716}\approx (\unicode[STIX]{x1D6FE}+({\textstyle \frac{1}{2}}+\unicode[STIX]{x1D6FE}^{2})^{1/2})x\equiv S^{\ast }x.\end{eqnarray}$$
Since the parameter
 $S^{\ast }$
is evidently smaller than
 $S$
, the bubble is predicted to grow on a solid surface at a smaller rate in comparison to a bubble in an unbounded liquid.
2 Experimental set-up
To grow bubbles in a controlled way, we use the set-up documented in Enríquez et al. (Reference Enríquez, Hummelink, Bruggert, Lohse, Prosperetti, van der Meer and Sun2013). The system mainly consists of two containers which are used, one to prepare the gas–liquid solution, and the other to perform the experiments. Pressure and temperature are controlled throughout the whole experiment. The bubbles grow out of a pit etched on a silicon chip, which ensures a growth on a designated spot. The pit is coated with black silicon, an extremely hydrophobic material.
Our procedure starts with the preparation of a saturated solution of carbon dioxide and ultra-pure degassed water at a certain pressure and temperature. The concentration
 $c$
of
 $\text{CO}_{2}$
in the solution depends on temperature and pressure, according to Henry’s law (originally documented in Henry (Reference Henry1803), see also e.g. Landau & Lifshitz (Reference Landau and Lifshitz1980)):
 $$\begin{eqnarray}c(T,P)=k_{H}(T)P,\end{eqnarray}$$
where
 $k_{H}$
is a decreasing function of temperature and
 $P$
is the pressure. This relation shows that, after reaching thermodynamic equilibrium, a solution can become supersaturated either by increasing the temperature or decreasing the pressure. Experimentally, the easier option is the latter one, which we adopt in this study. After preparing a saturated solution in the high pressure tank, we transfer it to the other container, in which the chip has been previously introduced and all other gases have been removed by flushing with
 $\text{CO}_{2}$
. The diameter of the experimental vessel (12 cm) is much larger than any bubble radius at detachment (
 ${\sim}300~\unicode[STIX]{x03BC}\text{m}$
), therefore any wall effect can be neglected. After lowering the pressure in the latter, according to (2.1), the liquid becomes supersaturated and bubbles start to grow on the desired spot. We record the succession of bubbles through a lateral window on the walls of the experimental tank, see figure 1.
(a) Schematic of the experimental set-up. The gas–liquid solution is introduced into the tank through the valve V1. By lowering the pressure by means of the controller, the solution becomes supersaturated and bubbles grow on the designed location on the chip. The images are recorded through the lateral glass window. (b) Bubble cycle: nucleation, growth and detachment. The sequence corresponds to the first bubble growing on the substrate after the pressure decrease. It can be appreciated that the bubble gains an almost perfect spherical shape from the very early stages after nucleation. The last snapshot in the sequence corresponds to the moment prior to detachment.

In the performed experiments, the temperature was measured to be
 $20.7\,^{\circ }\text{C}$
for all the cases. We created the saturated condition at a pressure of 914 kPa (9.14 bars). Under this condition, the water contains around
 $15.5~\text{kg}~\text{m}^{-3}$
of dissolved
 $\text{CO}_{2}$
. Decreasing its value to 810 kPa (8.01 bars), we obtain a gas excess of approximately
 $2~\text{kg}~\text{m}^{-3}$
, which needs to be released in the form of bubbles. Thus, we achieve a supersaturation level
 $\unicode[STIX]{x1D701}=0.14$
which is small enough to assume a quasi-static diffusion-driven evolution (see e.g. Enríquez et al.
Reference Enríquez, Sun, Lohse, Prosperetti and van der Meer2014). For most of the bubble growth time, we can therefore neglect convective effects, except for the middle–late stages of the bubble growth, in which natural convection becomes important (see below). Accordingly, advective effects caused by concentration difference are also neglected. The diffusivity has a value of
 $D=1.78\times 10^{-9}~\text{m}^{2}~\text{s}^{-1}$
at saturation (Frank, Kuipers & van Swaaij Reference Frank, Kuipers and van Swaaij1996; Cussler Reference Cussler2009; Lu et al.
Reference Lu, Guo, Chou, Burruss and Li2013), whereas the surface tension is
 $\unicode[STIX]{x1D70E}=0.059~\text{N}~\text{m}^{-1}$
(Lubetkin & Akhtar (Reference Lubetkin and Akhtar1996), lower than the value for pure water due to the high pressure level and the large amount of dissolved gas, as can be found in Eötvös (Reference Eötvös1886)), the mixture density is
 $\unicode[STIX]{x1D70C}_{m}=1016.7~\text{kg}~\text{m}^{-3}$
(Hebach, Oberhof & Dahmen Reference Hebach, Oberhof and Dahmen2004; International Association for the Properties of Water and Steam 2014) and the gas density is
 $\unicode[STIX]{x1D70C}_{g}=14.53~\text{kg}~\text{m}^{-3}$
(Pierantozzi Reference Pierantozzi2007). These parameters are necessary for computing the dimensionless values
 $\unicode[STIX]{x1D716}$
,
 $x$
and
 $\unicode[STIX]{x1D6FE}$
, and the value of the bubble detachment radius (defined in the next section). Under these conditions, the temperature change due to cooling by evaporation has been calculated to be of the order of
 $\unicode[STIX]{x0394}T\approx 1~\unicode[STIX]{x03BC}\text{K}$
. Therefore, this effect can be disregarded throughout the whole experiment.
3 Analysis of experiments
The radius of successive bubbles as function of time (solid line). The vertical portions represent the detachment of each bubble, followed by the nucleation of the subsequent one. Dots indicate the detachment radius. The dotted line at the top is the radius given by Fritz’s formula (3.1). The dashed line shows the corrected value considering the effective pinch-off radius, see figure 3(a) and equation (3.2). The detachment frequency progressively decreases, as later bubbles grow more slowly due to the depletion effect studied in this paper.
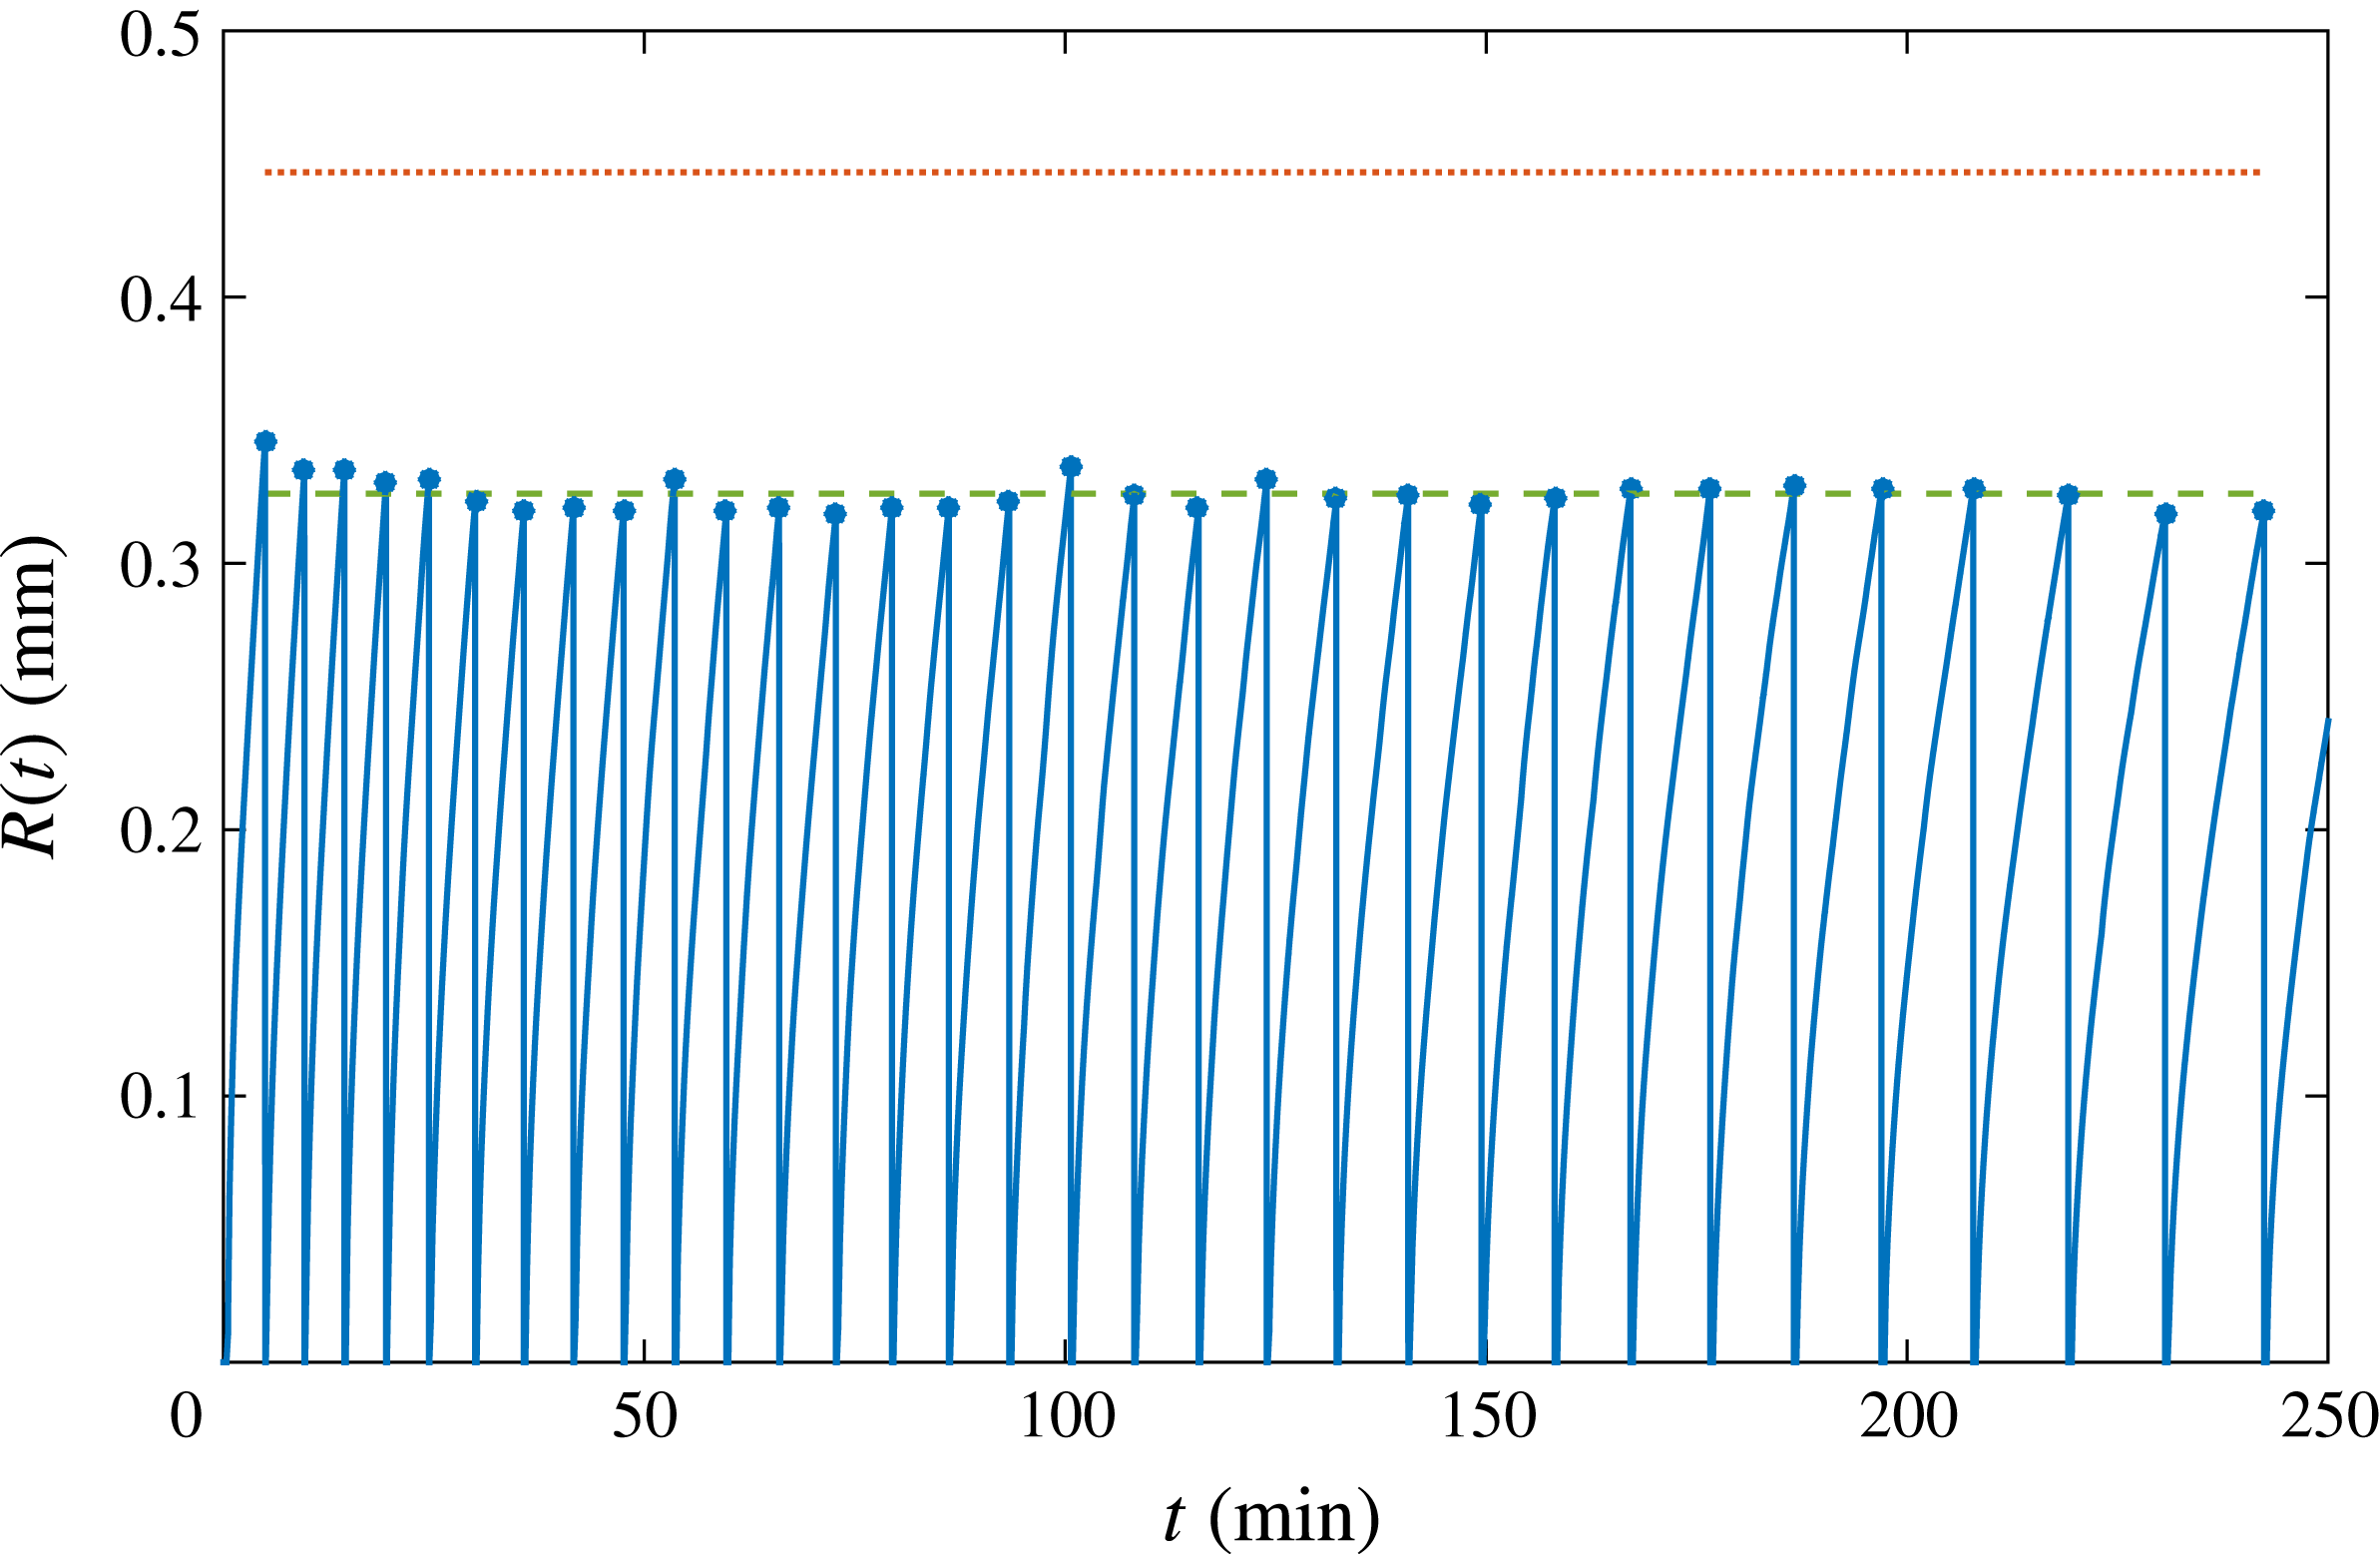
We analyse a long succession of bubbles nucleating, growing and detaching from the same pit over many hours, as depicted in figure 2, focusing on the differences between the first and latest bubbles. It can be clearly detected that, as time goes by and many bubbles have been growing and detaching, the growth rate decreases significantly. In addition, figure 2 represents the bubble detachment radius over time. The maximum value of the detachment radius is given by Fritz’s formula, which is derived by balancing the buoyancy force for a perfect sphere,
 $F_{b}=(4/3)\unicode[STIX]{x03C0}R^{3}(\unicode[STIX]{x1D70C}_{m}-\unicode[STIX]{x1D70C}_{g})g$
, with the capillary force for a bubble attached to the pit of radius
 $R_{p}=10~\unicode[STIX]{x03BC}\text{m}$
at the point where the buoyancy exceeds the maximum force that surface tension can exert,
 $F_{c}=2\unicode[STIX]{x03C0}\unicode[STIX]{x1D70E}R_{p}$
(Fritz Reference Fritz1935; Og̃uz & Prosperetti Reference Og̃uz and Prosperetti1993):
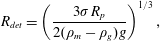 $$\begin{eqnarray}R_{det}=\left(\frac{3\unicode[STIX]{x1D70E}R_{p}}{2(\unicode[STIX]{x1D70C}_{m}-\unicode[STIX]{x1D70C}_{g})g}\right)^{1/3},\end{eqnarray}$$
where
 $g$
is the gravity acceleration. In our case, bubbles are attached to the inside of the pit, forming a neck between the trapped gas and the actual bubble growing outside, see figure 3. The neck radius is effectively smaller than the pit radius. We can thus correct (3.1), accounting for the smaller neck radius, i.e. the effective pit radius
 $R_{eff}$
,
 $F_{c}=2\unicode[STIX]{x03C0}R_{eff}\unicode[STIX]{x1D70E}$
. In that case, the following expression for the detachment radius is obtained:
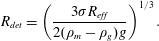 $$\begin{eqnarray}R_{det}=\left(\frac{3\unicode[STIX]{x1D70E}R_{eff}}{2(\unicode[STIX]{x1D70C}_{m}-\unicode[STIX]{x1D70C}_{g})g}\right)^{1/3}.\end{eqnarray}$$
From figure 3(b), the neck radius can be measured to be
 $4~\unicode[STIX]{x03BC}\text{m}$
, evidently smaller than the nominal pit radius. The correction accounting for this effective smaller radius is represented in figure 2 by the dashed line, presenting excellent agreement. From the same figure, it can be appreciated that the detachment radius barely changes in the succession. Therefore, we conclude that depletion does not affect the equilibrium of forces which determine the detachment radius, but it does play a role in the detachment time and the way bubbles grow.
(a) Sketch of a bubble attached to the hydrophobic pit (not to scale). The bubble detaches from a neck smaller than the pit radius. The detached gas volume is estimated as that of a perfect sphere. The error by assuming perfect sphericity and by neglecting the gas contained in the pit has been calculated to be smaller than 0.3 %. (b) Detail of the bubble just before detachment. The circle indicates the opening of the pit, which is larger than the stem from which the bubble detaches (curved lines). (c) Scanning electron microscopy (SEM) image of the hydrophobic pit. The black silicon coating the bottom of the pit provides the preferential spot for bubble nucleation and growth.

To study the effect of successively growing bubbles, we need to understand how gas diffuses through the concentration boundary layer formed around the bubble while it grows. The thickness of the diffusion layer increases according to
 $\unicode[STIX]{x1D6FF}\sim \sqrt{\unicode[STIX]{x03C0}Dt}$
. However, once a bubble detaches, part of this layer, together with the absorbed gas, is taken away by the bubble, also breaking the approximately spherical symmetry of the diffusion layer as the bubble escapes rapidly from the chip. To study how gas depletion will affect future bubbles, we need to analyse the growth rates after successive bubbles have been growing, see figures 4(a) and (b). The oscillations in the latter figure are due to the numerical differentiation of the data in the former one.
In addition, since the bubbles in our experiment have typical detachment radius
 $R_{det}\approx 0.3~\text{mm}$
, their (terminal) rise velocity in water is of the order of
 $U_{r}\sim 5~\text{cm}~\text{s}^{-1}$
. This terminal velocity can be regarded as an upper limit to our case scenario. This leads to a Reynolds number
 $Re\sim 15$
, and consequently both viscous and inertial effects may be important. Bubbles then rise to the free surface, which is typically
 ${\sim}5~\text{cm}$
above the substrate, in approximately one second. Assuming dominance of the Stokeslet term and a characteristic length corresponding to the bubble radius at detachment (due to the presence of the chip, the distance to the closest boundary is the appropriate length scale), the magnitude of the velocity near the chip during the rise of the bubble will be set by
 $u(t)\sim UR_{det}/(R_{det}+U_{r}t)$
, where
 $U$
is a characteristic bubble velocity at the chip surface. So the velocity will decay approximately as
 $R_{det}/t$
during most of this rising process. Any possibly present residual inertial fluid motion near the substrate will damp out due to the presence of the chip. The time in which this happens is set by the speed at which the chip momentum boundary layer grows (approximately
 $\unicode[STIX]{x1D6FF}_{m}\sim \sqrt{\unicode[STIX]{x1D708}t}\sim R_{det}$
), such that this time can be estimated as
 $t\sim R_{det}^{2}/\unicode[STIX]{x1D708}$
, where
 $\unicode[STIX]{x1D708}=9.58\times 10^{-7}~\text{m}^{2}~\text{s}^{-1}$
is the kinematic viscosity of water (Frank et al.
Reference Frank, Kuipers and van Swaaij1996; Bataller et al.
Reference Bataller, Miqueu, Plantier, Daridon, Jaber, Abbasi, Saghir and Bou-Ali2009). This time is calculated to be of the order of tenths of a second. One could argue that one should multiply this time with a rather large number because in most of the momentum boundary layer the velocity would be closer to that in the bulk rather than that at the substrate, but it will still be of the order of seconds at most. Therefore, both rising and damping time are very small compared with the bubble growth time (several minutes) and even to the time it takes for a bubble to renucleate after the previous one has detached, which in our experiments is typically of the order of ten seconds or longer. This implies that every new bubble starts to grow in liquid that is essentially quiescent and convective flows remaining from the rise of the previous bubble play no significant role.
(a) Evolution of the bubble radius normalised by the pit radius
 $R_{p}$
as a function of the dimensionless parameter
 $x\propto \sqrt{t}$
defined in (1.3) for several bubbles from the sequence in figure 2. The line marked Epstein & Plesset (Reference Epstein and Plesset1950) represents the simplified expression in (1.4) and the line marked Enríquez et al. (Reference Enríquez, Sun, Lohse, Prosperetti and van der Meer2014) its modification (1.5) correcting for the presence of the chip. (b) Dimensionless growth rate
 $(1/S^{\ast })(\text{d}/\text{d}x)(R/R_{p})$
versus dimensionless time
 $x$
for the same bubbles plotted in (a). The line marked Epstein & Plesset (Reference Epstein and Plesset1950) (with asymptote
 $S/S^{\ast }$
) shows the exact solution given by these authors; the Enríquez et al. (Reference Enríquez, Sun, Lohse, Prosperetti and van der Meer2014) line accounting for the presence of the chip asymptotes to 1.
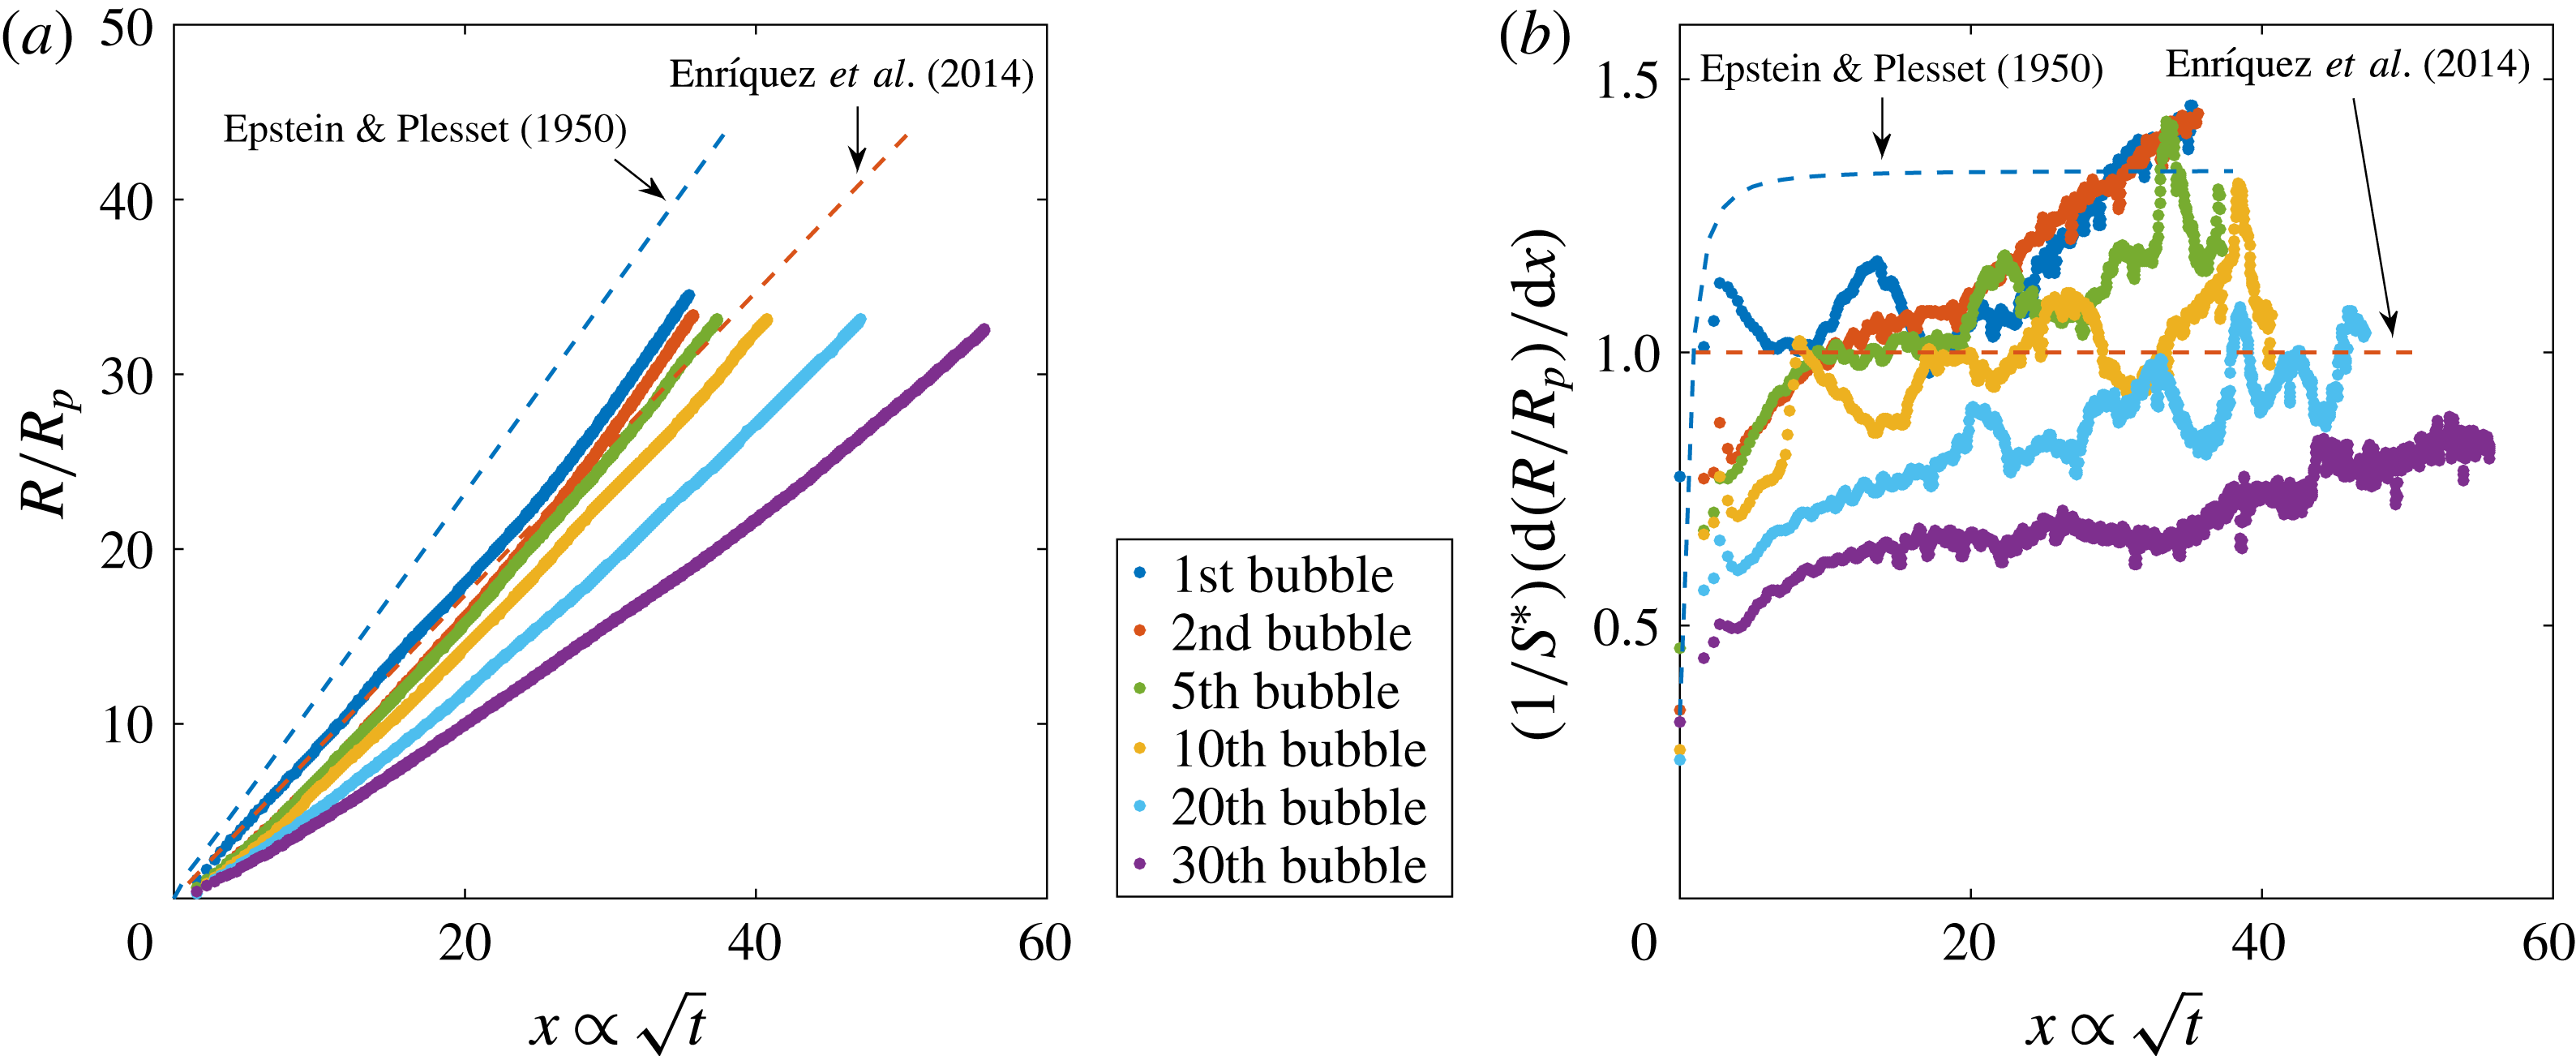
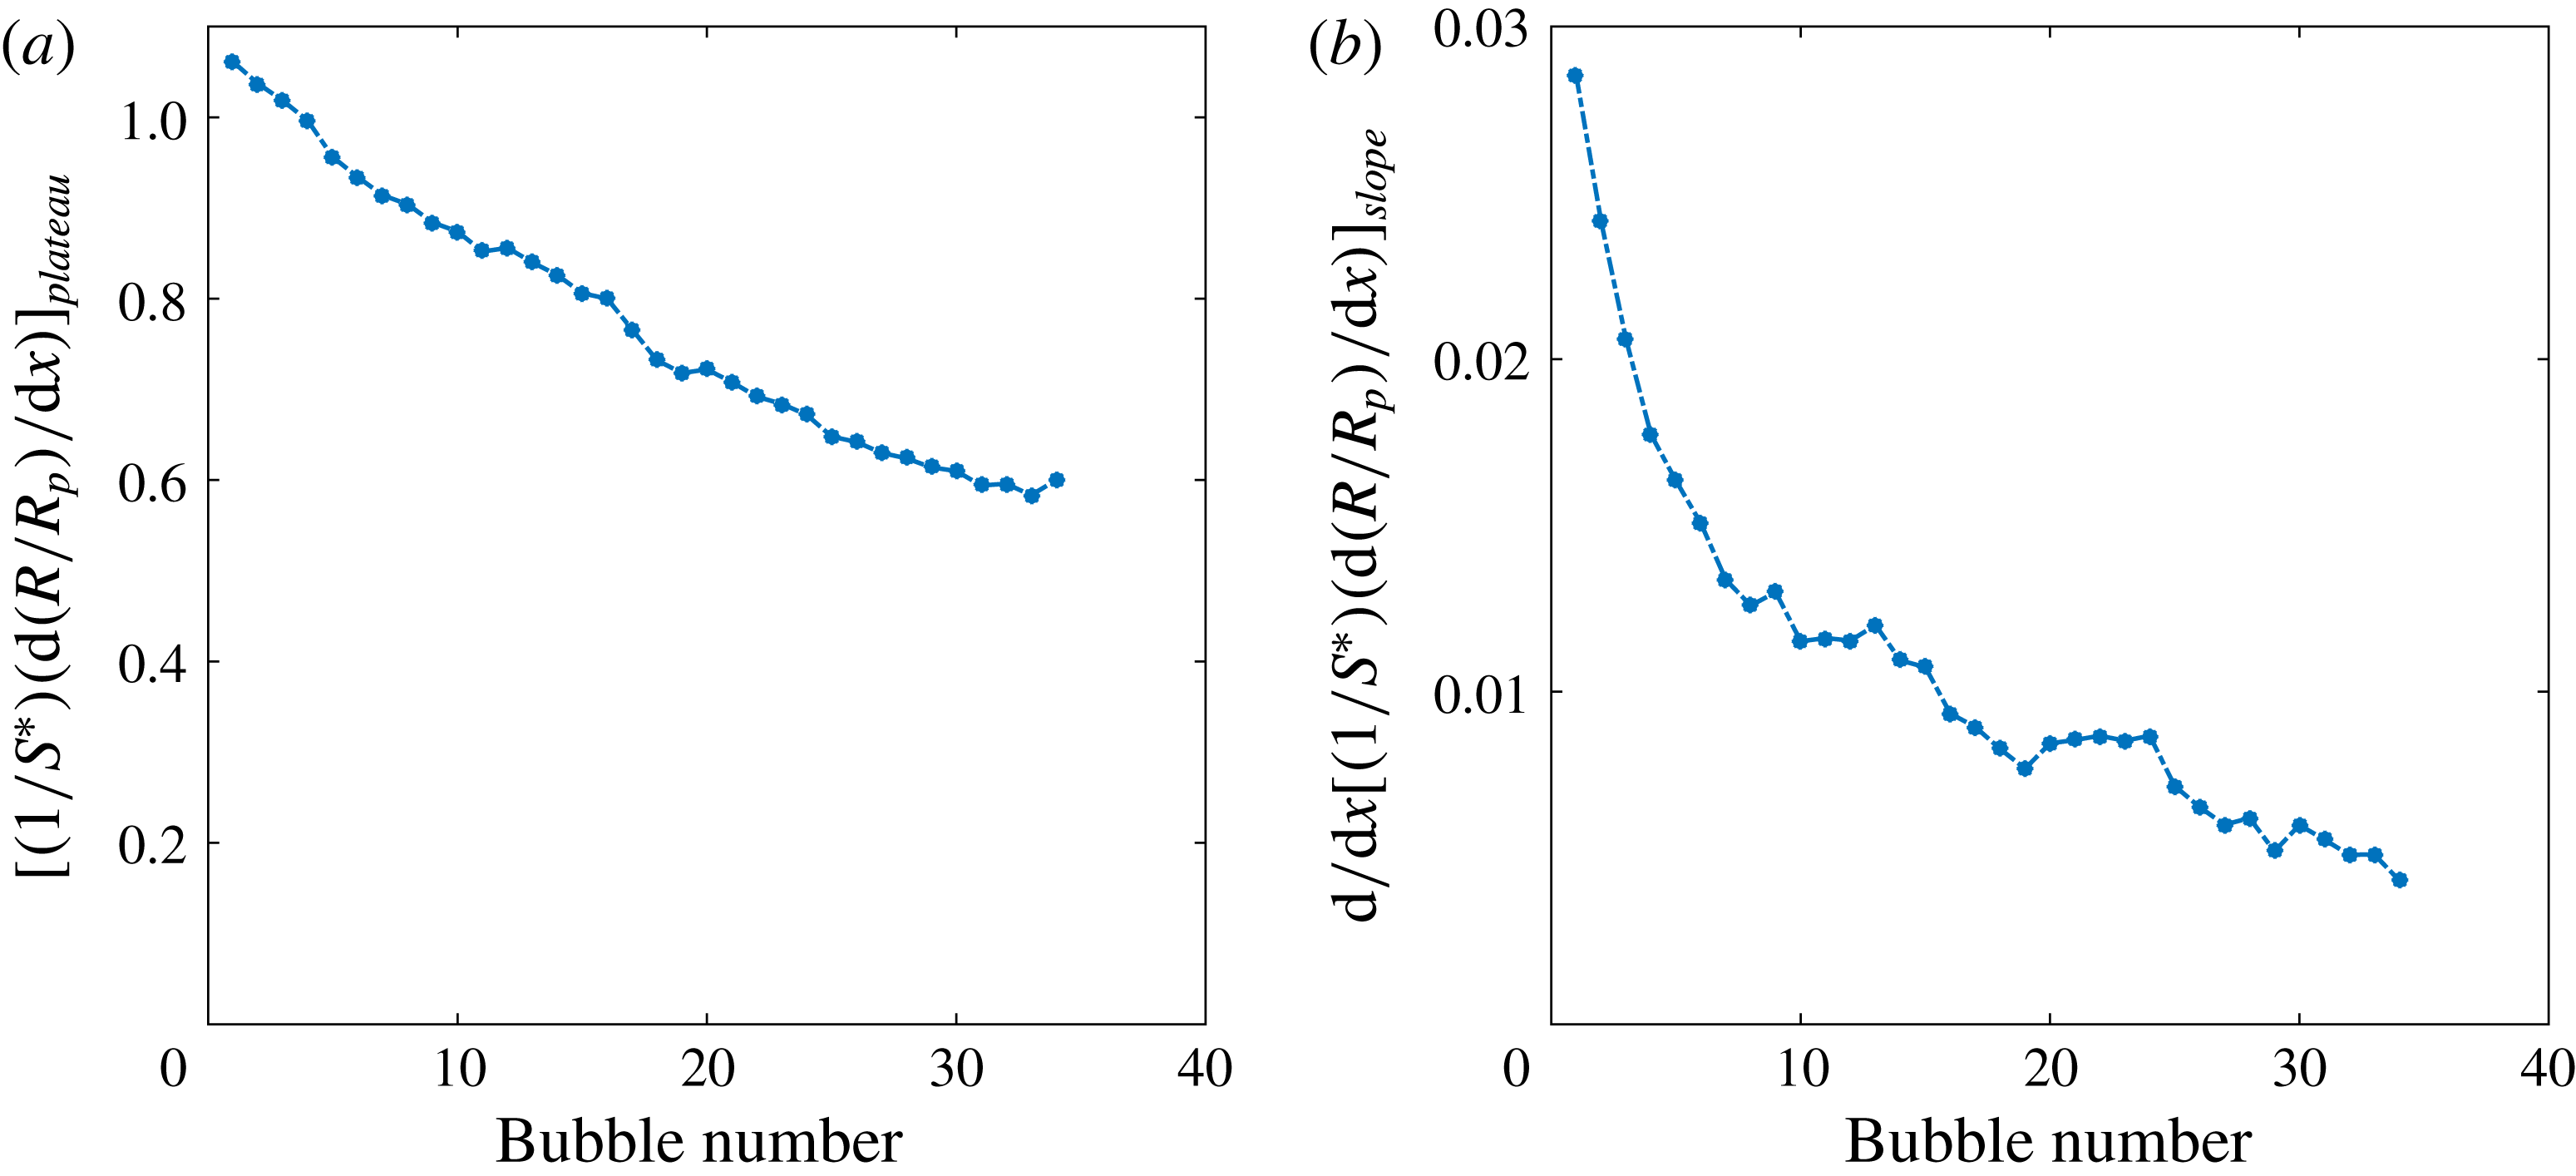
The initial bubbles follow the tendency of the simplified Epstein–Plesset solution (1.4) corrected for the presence of the chip, equation (1.5). From the middle stages of the bubble growth until its detachment, there is a final faster volume increase which results from the onset of density-driven convection, as found in Enríquez et al. (Reference Enríquez, Sun, Lohse, Prosperetti and van der Meer2014). As subsequent bubbles grow and detach, the experimental data no longer approach the theoretically predicted behaviour. This is the first indication of depletion, which appears in figure 4(a) from the fifth bubble on. In figure 4(b), there are two main events occurring for later bubbles in the sequence: the plateau indicating the diffusive regime reaches a decreasingly lower value than the predicted one and the upward slope starting at
 $x\approx 20$
(which is attributed to the onset of convection) becomes more and more horizontal, i.e. the change from diffusion to convection at these late stages becomes less pronounced. To quantify these effects, we plot in figure 5(a) the value of the saturation plateau for each bubble in the sequence, whereas in figure 5(b) we represent the slope values corresponding to the convective regime in the final stages of the growth. To generate these values, we use the last 30 data points of each bubble to fit the slope and the previous ones to generate the plateau (ignoring the first 10 points). We repeated the process varying the number of points between 25 and 35, finding very similar results.
(a) Saturation plateau in the intermediate stage of bubble growth (
 $5\leqslant x\leqslant 20$
in figure 4
b) and (b) convective slope gradient in the final stages of the growth (
 $20\leqslant x$
, see text). The decreasing tendency in (a) suggest that diffusive growth suffers from gas depletion caused by the growth of earlier bubbles. The decrease in (b) shows that the convective contribution to mass transfer progressively decreases for the same reason.
For further analysis, it is convenient to introduce two dimensionless numbers, namely the Sherwood and Rayleigh numbers. The Sherwood number is the dimensionless mass transfer rate into the bubble,
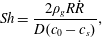 $$\begin{eqnarray}Sh=\frac{2\unicode[STIX]{x1D70C}_{g}R{\dot{R}}}{D(c_{0}-c_{s})},\end{eqnarray}$$
where
 ${\dot{R}}$
is the growth rate. The Rayleigh number represents the ratio of buoyancy to viscous forces and diffusive effects:
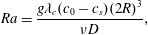 $$\begin{eqnarray}Ra=\frac{g\unicode[STIX]{x1D706}_{c}(c_{0}-c_{s})(2R)^{3}}{\unicode[STIX]{x1D708}D},\end{eqnarray}$$
where
 $\unicode[STIX]{x1D706}_{c}$
is the concentration expansion coefficient, defined by
 $$\begin{eqnarray}\unicode[STIX]{x1D706}_{c}=\frac{1}{\unicode[STIX]{x1D70C}}\left(\frac{\unicode[STIX]{x2202}\unicode[STIX]{x1D70C}}{\unicode[STIX]{x2202}c}\right)_{P,T}\approx \frac{1}{\unicode[STIX]{x1D70C}_{m,0}}\frac{\unicode[STIX]{x1D70C}_{m,s}-\unicode[STIX]{x1D70C}_{m,0}}{c_{s}-c_{0}},\end{eqnarray}$$
where subindices
 $0$
and
 $s$
refer to the states at saturated and supersaturated conditions, respectively. For our specific case,
 $\unicode[STIX]{x1D706}_{c}$
has a value of
 $6.5\times 10^{-4}~\text{m}^{3}~\text{kg}^{-1}$
. Often,
 $\unicode[STIX]{x1D706}_{c}$
is approximated by
 $\unicode[STIX]{x1D706}_{c}=(M_{g}/\unicode[STIX]{x1D70C}_{l})-\overline{V}_{g}$
(Bataller et al.
Reference Bataller, Miqueu, Plantier, Daridon, Jaber, Abbasi, Saghir and Bou-Ali2009), where
 $M_{g}$
is the molecular mass of the gas,
 $\unicode[STIX]{x1D70C}_{l}$
is the liquid density and
 $\overline{V}_{g}$
is the partial volume of the gas in the mixture. However, this partial volume cannot be measured with the desired precision by the means we have access to; therefore, we have used the original definition as in (3.5).
In case of steady-state density-driven convection around a sphere in an infinite medium,
 $Sh$
depends on
 $Ra$
as (see e.g. Clift, Grace & Weber Reference Clift, Grace and Weber1978; Bejan Reference Bejan1993):
 $$\begin{eqnarray}Sh=2+KRa^{1/4},\end{eqnarray}$$
where 2 is the Sherwood number corresponding to pure diffusion (which occurs when
 $Ra\ll 1$
) and
 $K$
is a fitting constant which is found to be 0.569 according to Rahman (Reference Rahman2013) and 0.535 as reported by Bergman et al. (Reference Bergman, Incropera, DeWitt and Lavine2011). As documented in Enríquez et al. (Reference Enríquez, Sun, Lohse, Prosperetti and van der Meer2014), plotting the experimental results for
 $Sh$
versus
 $Ra$
, the change from diffusion to convection can be detected, since during the early stages of growth (
 $Ra<10$
), we experimentally find that
 $Sh$
remains approximately constant irrespectively of the value of
 $Ra$
, whereas above
 $Ra\approx 10^{2}$
, the experimental curves start increasing proportionally to
 $Ra^{1/4}$
as in (3.6). Note that the relation (3.6) also holds for the case of a dissolving droplet with lower density as that of the surrounding solvent, as documented in Dietrich et al. (Reference Dietrich, Wildeman, Visser, Hofhuis, Kooij, Zandvliet and Lohse2016).
Rewriting
 $Sh$
and
 $Ra$
with the dimensionless parameters defined in (1.3), we obtain the following expressions:
 $$\begin{eqnarray}\displaystyle & \displaystyle Sh=2\frac{\unicode[STIX]{x1D716}}{x}\frac{\text{d}\unicode[STIX]{x1D716}}{\text{d}x}, & \displaystyle\end{eqnarray}$$
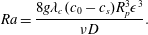 $$\begin{eqnarray}\displaystyle & \displaystyle Ra=\frac{8g\unicode[STIX]{x1D706}_{c}(c_{0}-c_{s})R_{p}^{3}\unicode[STIX]{x1D716}^{3}}{\unicode[STIX]{x1D708}D}. & \displaystyle\end{eqnarray}$$
(a) The data of figure 4 replotted in the form of Sherwood number
 $Sh$
versus Rayleigh number
 $Ra$
; the continuous curve represents (3.6). (b) Sherwood number
 $\widetilde{Sh}$
versus Rayleigh number
 $\widetilde{Ra}$
compensated for the local depletion of the solution as explained in the text.
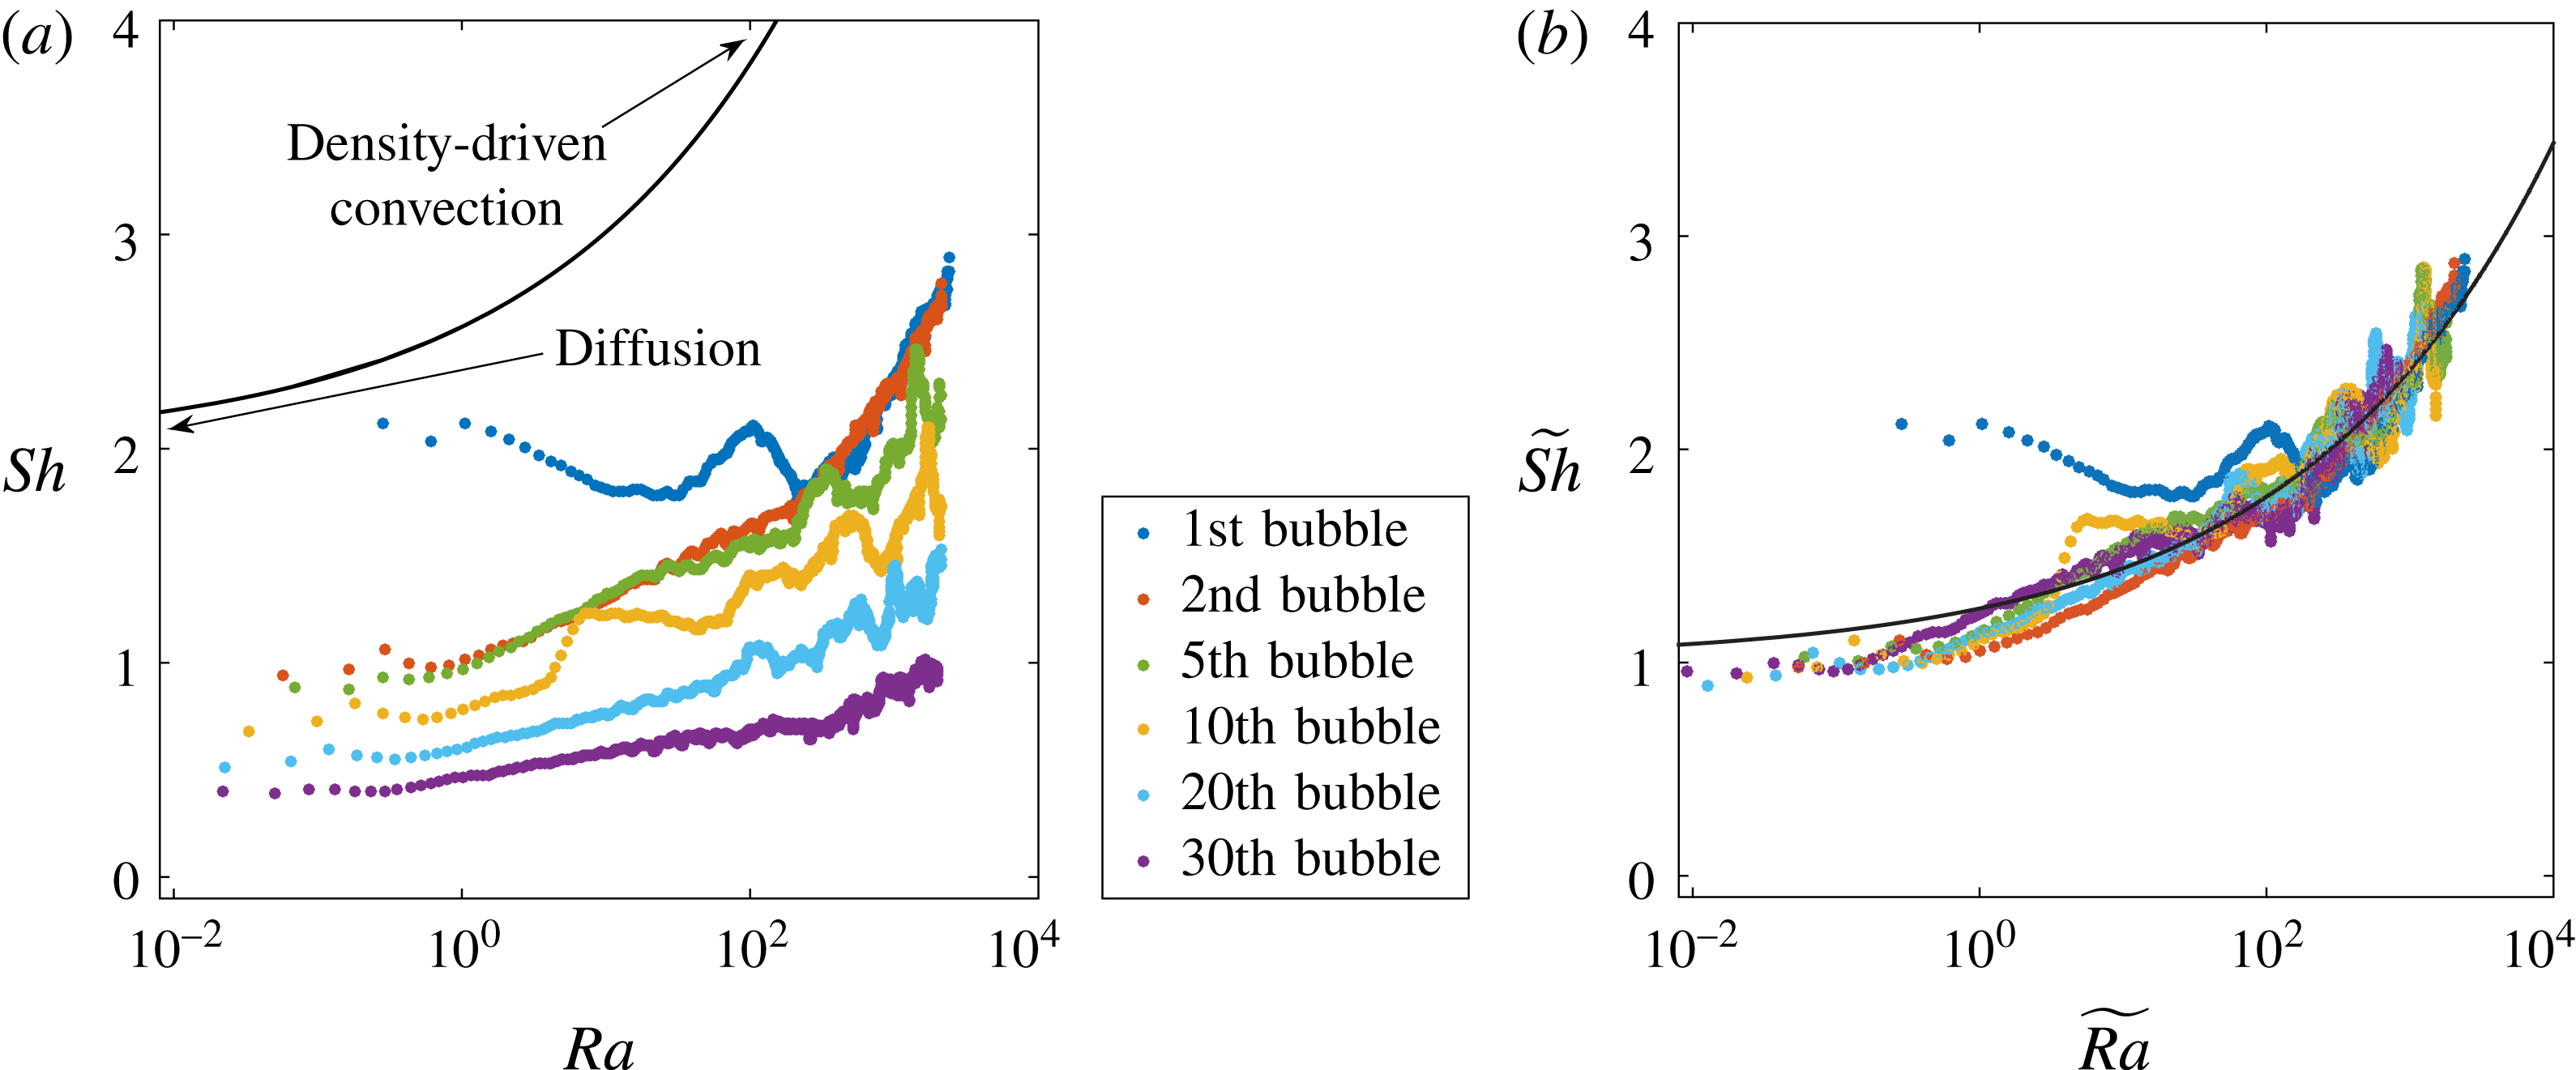
The experimental results for these quantities are plotted in figure 6(a). For subsequent bubbles, the evolution differs from the first bubble, which grows in an homogeneous, non-perturbed environment: the horizontal portion of the curves, corresponding to purely diffusive behaviour, gradually decreases below the value
 $Sh=2$
, indicating depletion of the concentration field around the bubble.
4 Simplified model of gas depletion effects
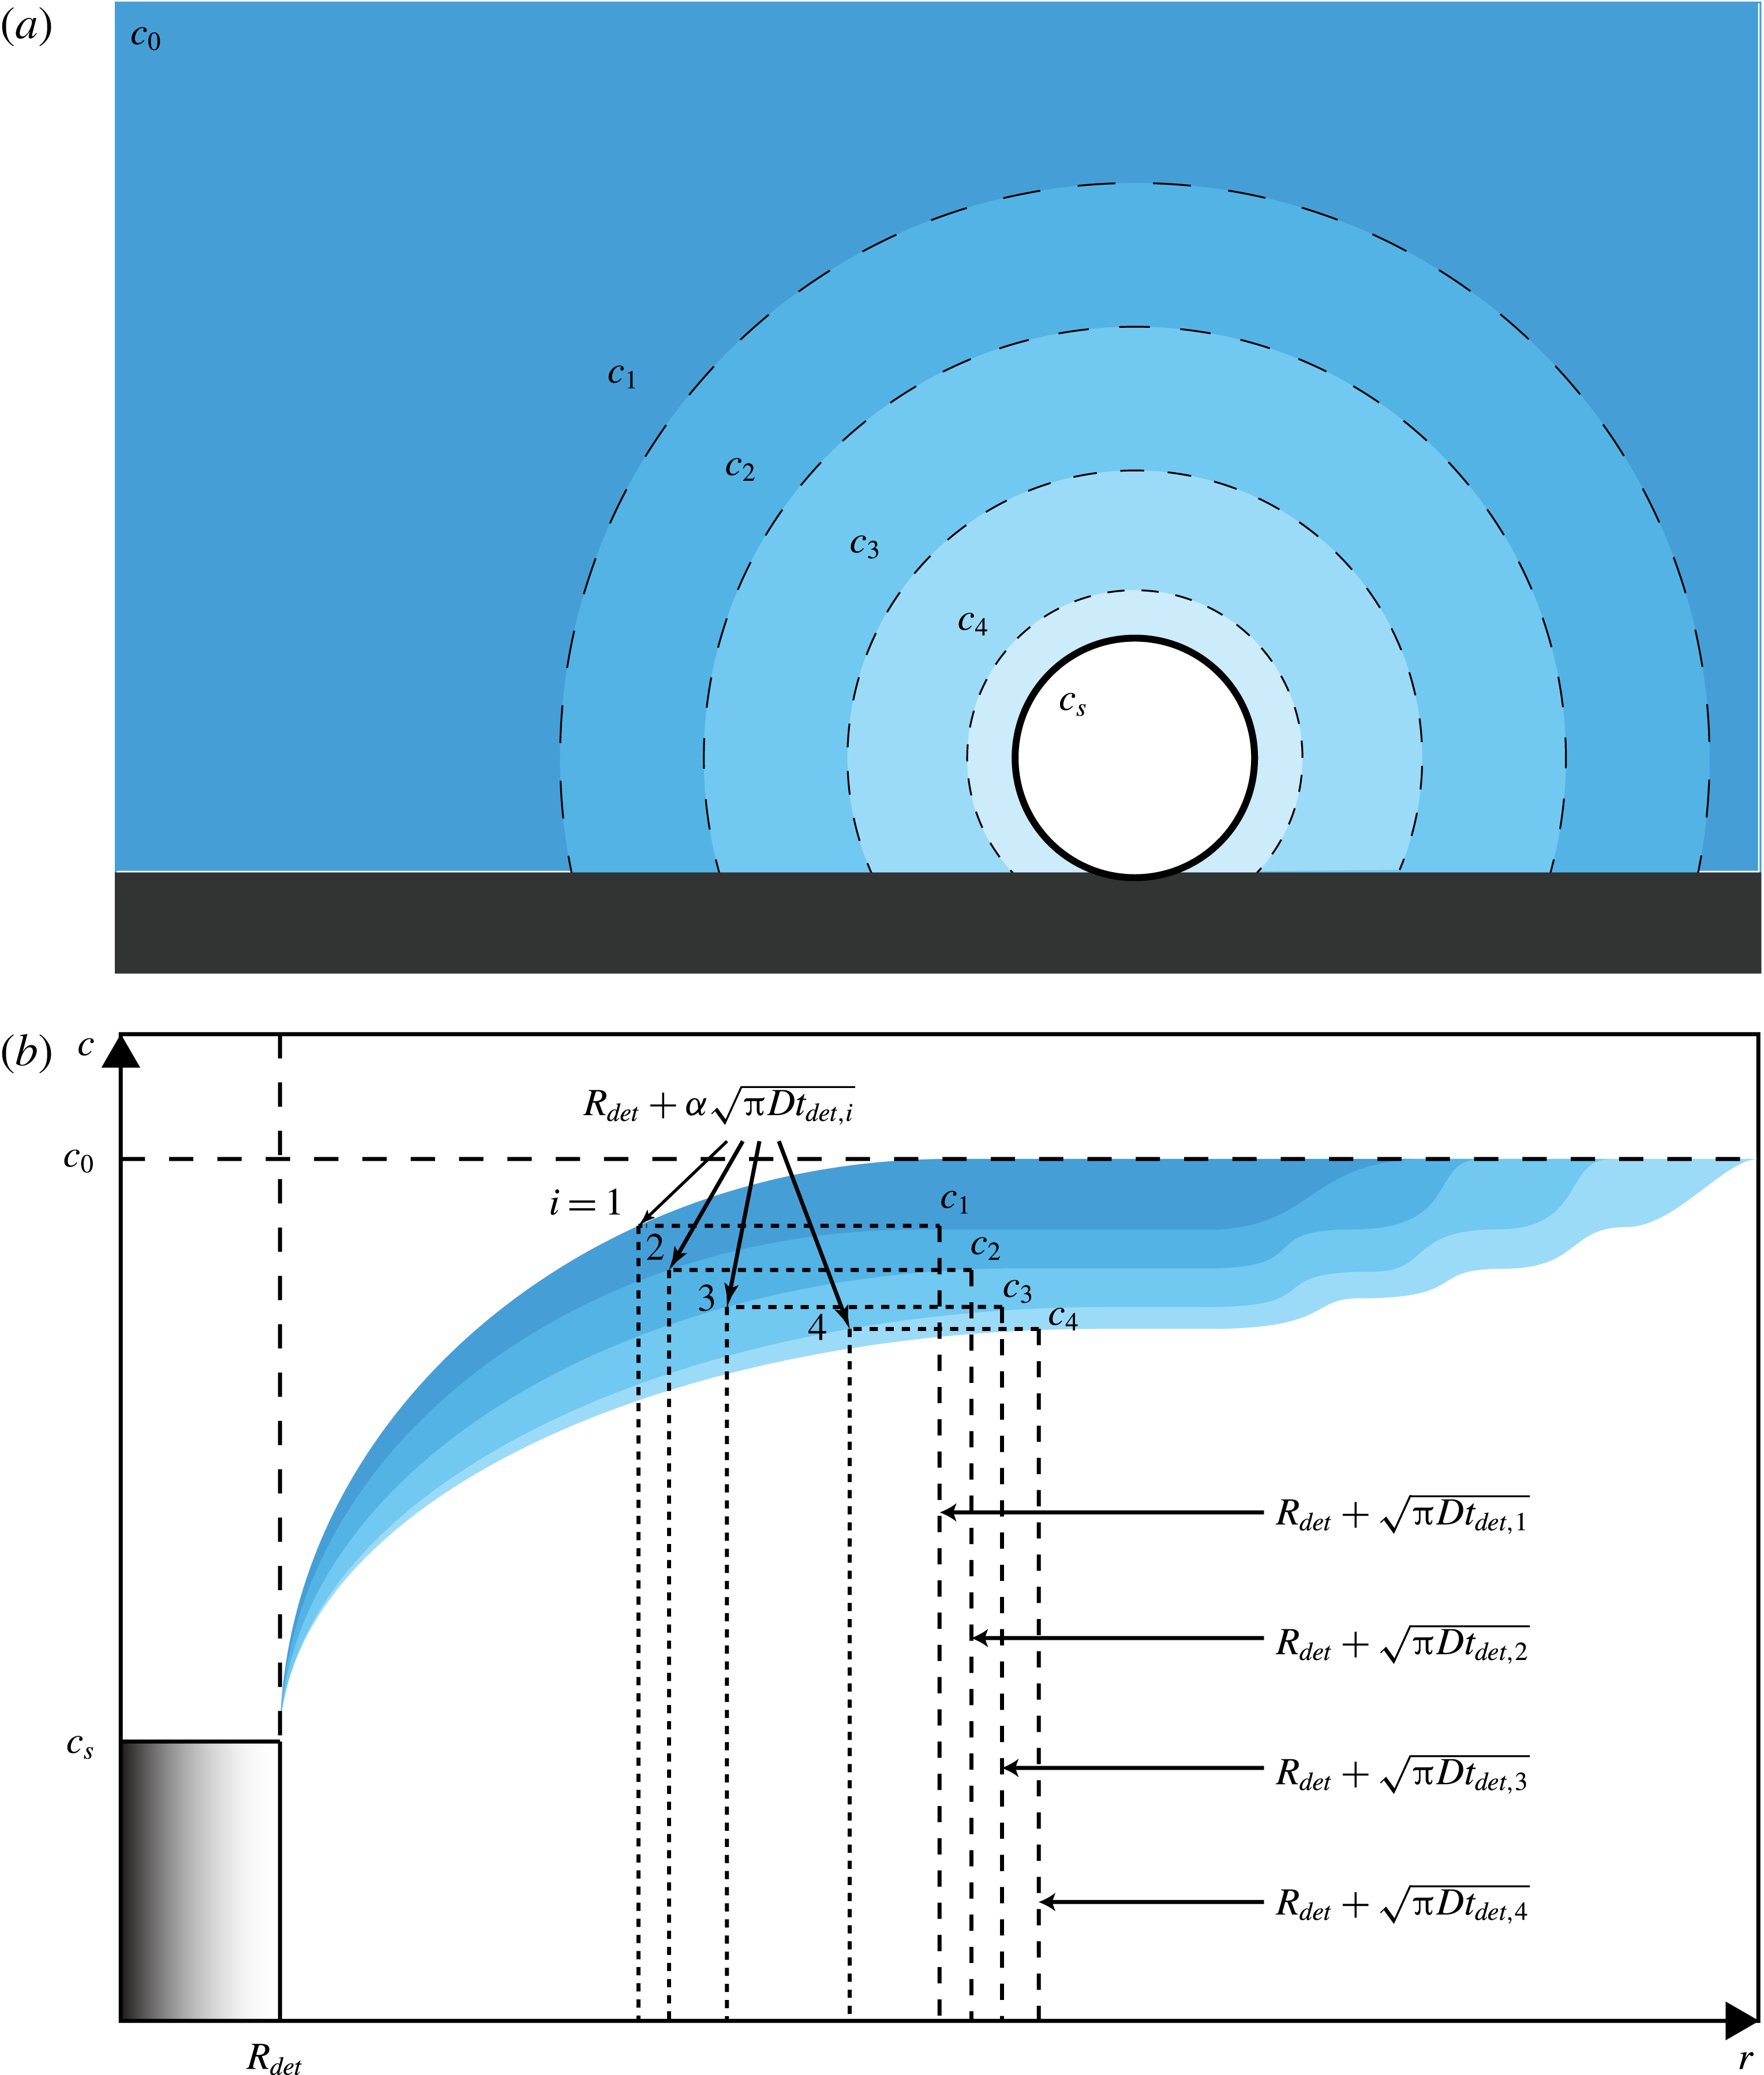
(a) Schematic of the gas-depleted volume around a growing bubble after the growth and detachment of several previous ones. The bubble depicted is surrounded by a depleted solution with a concentration
 $c_{n}$
smaller than the initial one
 $c_{0}$
, which still prevails at further distances. Because of the convective contribution to mass transfer, which is faster than can be replenished by diffusion, each bubble leaves behind a depleted volume of liquid as it detaches. This effect is expressed in the image by a less intense colour around the bubble. (b) The upper boundary of each colour band depicts the gas concentration for pure diffusion. The lower boundary is the gas concentration as modified by the effect of convection. The area bounded by the two lines thus illustrates the gas depletion caused by convection. The dashed lines on the right are the edge of the diffusion layer generated by each bubble (not to scale). The vertical dotted lines show the effective extent of the volume from which each bubble receives gas;
 $\unicode[STIX]{x1D6FC}$
is a fitting parameter introduced in (4.5).
To model the depletion occurring around the
 $n$
-th bubble, let us assume that it grows in a locally depleted region where the concentration
 $c_{n}$
is smaller than the concentration
 $c_{0}$
in the bulk far away from the nucleation site (see figure 7). We now define a depletion number,
 $$\begin{eqnarray}\unicode[STIX]{x1D6F6}_{n}=\frac{c_{n}-c_{s}}{c_{0}-c_{s}}.\end{eqnarray}$$
For the first bubble, of course,
 $c_{1}=c_{0}$
and therefore,
 $\unicode[STIX]{x1D6F6}_{1}=1$
. We can define the local Sherwood and Rayleigh numbers,
 $\widetilde{Sh}_{n}$
and
 $\widetilde{Ra}_{n}$
:
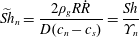 $$\begin{eqnarray}\displaystyle & \displaystyle \widetilde{Sh}_{n}=\frac{2\unicode[STIX]{x1D70C}_{g}R{\dot{R}}}{D(c_{n}-c_{s})}=\frac{Sh}{\unicode[STIX]{x1D6F6}_{n}} & \displaystyle\end{eqnarray}$$
 $$\begin{eqnarray}\displaystyle & \displaystyle \widetilde{Ra}_{n}=\frac{g\unicode[STIX]{x1D706}_{c}(c_{n}-c_{s})(2R)^{3}}{\unicode[STIX]{x1D708}D}=\unicode[STIX]{x1D6F6}_{n}Ra, & \displaystyle\end{eqnarray}$$
A test of this simple conceptual model can be carried out by trying to collapse all the data of figure 6(a) referring to the first bubble using
 $\unicode[STIX]{x1D6F6}_{n}$
as a fitting parameter.
 $\unicode[STIX]{x1D6F6}_{n}$
is thus adapted to achieve a universal curve
 $\widetilde{Sh}_{n}(\widetilde{Ra}_{n})$
. The results for this curve are shown in figure 6(b). The various values of
 $\unicode[STIX]{x1D6F6}_{n}$
turn out to decrease for successive bubbles, i.e. the gas concentration surrounding the bubble is reduced from cycle to cycle, see figure 8(a). Equation (3.6) can be similarly adjusted to fit the experimental data rewriting it in terms of
 $\widetilde{Sh}_{n}$
and
 $\widetilde{Ra}_{n}$
.
By the definition (4.2b
) and the results in figure 6(b), we find that the maximum local Rayleigh number
 $\widetilde{Ra}_{n}$
attained before detachment decreases for successive bubbles, which is an indicator that convection diminishes, which agrees with the decrease of mass transfer as subsequent bubbles keep growing and detaching, together with the diminishing slope represented in figure 5(b).
Before providing a theoretical estimate of the depletion number
 $\unicode[STIX]{x1D6F6}_{n}$
, we now first discuss the origin of the depletion effect in a more qualitatively manner. If the bubble could be modelled as a time-independent mass sink and if diffusion alone were to be considered, a steady state would be rapidly reached in which the mass transfer towards the bubble will be exactly equilibrated by the gas diffusion from the bulk to the bubble surroundings. The concentration in a purely diffusive problem decays proportionally to
 $1/r$
(as seen in many text books, such as Bejan (Reference Bejan1993)), where
 $r$
refers to the radial distance measured from the point sink; thus, the gradient of concentration proportionally changes to
 $1/r^{2}$
, which is constant at every defined
 $r$
and independent of time. Therefore, if diffusion alone is set, then depletion does not occur, since the gradient of concentration will be exactly the same for all times, i.e. there would be an exact balance between the gas removed by the bubble and the gas diffusing from the bulk liquid. When, however, natural convection starts to occur, the mass flow into the bubble is enhanced and therefore, more gas will be locally transported into the bubble than is supplied by the steady state diffusion profile, leading to a local depletion in the region that surrounds the bubble. This depletion occurs at least as long as the convective transfer is not strong enough to transport gas-depleted liquid outside the immediate surroundings of the bubble.
Additionally, there are two other effects that need to be taken into account. The first is that a bubble growing in a homogeneously supersaturated liquid according to the diffusive Epstein–Plesset law, equation (1.5), is never in a steady state. It can be easily verified from the approximate law
 $R(t)\propto \sqrt{t}$
that the mass flow rate into the bubble is not constant but proportional to
 $\sqrt{t}$
as well. Moreover, it can be shown that also the diffusive boundary layer grows as
 $\sqrt{t}$
. If one would consider a series of bubbles diffusively growing from the same spot and if each bubble would detach as soon as it reaches its detachment radius, equation (3.2), then after a couple of bubbles a diffusive steady state would be reached similar to the one discussed in the previous paragraph, and natural convection would be needed to create a sustained depletion effect as was observed in our experiments. Therefore, we conclude that more gas is absorbed by each bubble than would be supplied by diffusion alone: this excess gas is supplied by convection. As a result, each subsequent bubble grows in a new environment in which the local concentration is lower than for the previous one, with a correspondingly lower growth rate. The second additional effect is that there is a flow connected to the detachment of the bubble. As each bubble rises, it advects a volume of liquid of the order of half the bubble volume away from the region where the bubble grows. As a result of the need to refill the space that is left by the rising bubble and the liquid advected with it, the liquid in the bubble growth region will get mixed with liquid that is less gas depleted, coming from somewhat farther away. From the Stokeslet term, we can estimate the typical distance
 $d_{f}$
travelled by a fluid particle during this event by integrating the velocity near the chip
 $u(t)$
over the rising time, which gives
 $d_{f}\sim \log (t_{r}/t_{0})$
, where
 $t_{0}=R_{det}/U_{r}\approx 0.3\times 10^{-3}/5\times 10^{-2}=15$
ms and the rising time
 $t_{r}\approx 1$
s. So
 $d_{f}\approx 2R_{det}\approx 0.6~\text{mm}$
. This implies that the fluid that is mixed during the detachment event typically comes from within the diffusive boundary layer around the bubble.
Of course, all the above contributions to the depletion effect are difficult to model. For a quantitative estimate of the successive values of the depletion number
 $\unicode[STIX]{x1D6F6}_{n}$
, we therefore assume that, at the start of the growth of the
 $n$
-th bubble, the concentration of dissolved gas in the surrounding liquid is smaller than if the preceding bubble had grown by pure diffusion. A quantitative measure of this effect can be based on the before-mentioned solution of the diffusion equation in the presence of a point sink (derived in appendix A):
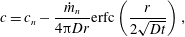 $$\begin{eqnarray}c=c_{n}-\frac{{\dot{m}}_{n}}{4\unicode[STIX]{x03C0}Dr}\text{erfc}\left(\frac{r}{2\sqrt{Dt}}\right),\end{eqnarray}$$
where
 $\text{erfc}$
is the complementary error function and
 ${\dot{m}}_{n}$
is the average mass loss rate value approximated from the gas content of the detached bubble as
 $$\begin{eqnarray}{\dot{m}}_{n}=\frac{4\unicode[STIX]{x03C0}\unicode[STIX]{x1D70C}_{g}R_{det}^{3}}{3t_{det,n}},\end{eqnarray}$$
with
 $t_{det,n}$
the experimentally measured detachment time of the
 $n$
-th bubble and
 $R_{det}$
the detachment radius, common for all the bubbles. This defined mass loss rate is larger than the one which would be found in the case of pure diffusion. The solution (4.3) only describes the concentration field up to a distance of the order of
 $\sqrt{\unicode[STIX]{x03C0}Dt_{det,n}}$
from the bubble. As a justification for the use of the point sink approximation, we may note that the ratio
 $\sqrt{\unicode[STIX]{x03C0}Dt_{det,n}}/R_{det}$
increases from approximately 4 for the first few bubbles to nearly 30 for the later ones: the depletion eats deeply into the gas reservoir. Further out, the concentration tends to the bulk value
 $c_{0}$
, see figure 7(b). We now identify the concentration
 $c$
as given by (4.3) with
 $r=R_{det}+\unicode[STIX]{x1D6FC}\sqrt{\unicode[STIX]{x03C0}Dt_{det,n}}$
(with
 $\unicode[STIX]{x1D6FC}$
a fitting parameter which characterises the distance within the diffusive boundary layer in which the depleted concentration for the subsequent bubble in the succession will be defined) as
 $c_{n+1}$
, the ambient concentration in which the next bubble will grow. With this identification, we find:
 $$\begin{eqnarray}\unicode[STIX]{x1D6F6}_{n+1}=\unicode[STIX]{x1D6F6}_{n}-\frac{{\dot{m}}_{n}}{4\unicode[STIX]{x03C0}D(c_{0}-c_{s})(R_{det}+\unicode[STIX]{x1D6FC}\sqrt{\unicode[STIX]{x03C0}Dt_{det,n}})}\text{erfc}\left(\frac{R_{det}+\unicode[STIX]{x1D6FC}\sqrt{\unicode[STIX]{x03C0}Dt_{det,n}}}{2\sqrt{D(t_{det,n}-t_{det,n-1})}}\right).\end{eqnarray}$$
(a) The depletion number
 $\unicode[STIX]{x1D6F6}_{n}$
, defined in (4.1) for successive bubbles. The decrease of this number from 1 gives an indication of the progressive depletion of the solution surrounding each bubble. The dots are the experimental points and the line is the theoretical prediction according to (4.5), which is linearised in time in order to join the calculated discrete points. (b) The detachment time of successive bubbles: comparison between experiments (dots) and the approximate prediction of (4.6) (line).

This equation is solved by an iterative process in which the depletion number depends on the corresponding depletion number of the previous bubble growing in succession. We compare both the experimental data and the predicted theoretical behaviour, with best fitting constant
 $\unicode[STIX]{x1D6FC}=0.72$
, in figure 8(a). This value of
 $\unicode[STIX]{x1D6FC}$
is reasonable as one would expect
 $c$
to tend to
 $c_{n}$
at the edge of the diffusion layer corresponding to the
 $n$
-th bubble, for which
 $\unicode[STIX]{x1D6FC}\sim 1$
. The agreement of this somewhat crude model is gratifying. As an explanation of this somewhat surprising result, it may be noted that, in spite of its foundation on pure diffusion, the effect of convection is implicitly included in the use of the experimentally determined value of
 ${\dot{m}}_{n}$
, as given by (4.4). Thus, (4.3) represents the equivalent concentration field that would produce the mass rate
 ${\dot{m}}_{n}$
if diffusion were the only process in play. The so-defined model does not directly face the onset of convection and mixing, but accounts for their effect in an indirect way.
The detachment time for successive bubbles can be estimated using the depletion number and combining equations (1.5) and (3.2), yielding
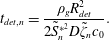 $$\begin{eqnarray}t_{det,n}=\frac{\unicode[STIX]{x1D70C}_{g}R_{det}^{2}}{2\tilde{S}_{n}^{\ast ^{2}}D\tilde{\unicode[STIX]{x1D701}}_{n}c_{0}}.\end{eqnarray}$$
This detachment time only considers diffusion-driven processes, as it is derived from a pure diffusion equation. The change due to the depletion of the bubble surroundings needs to be accounted for in the parameters
 $\tilde{\unicode[STIX]{x1D701}}_{n}$
and
 $\tilde{S}_{n}^{\ast }$
, namely
 $$\begin{eqnarray}\tilde{\unicode[STIX]{x1D701}}_{n}=\unicode[STIX]{x1D701}\unicode[STIX]{x1D6F6}_{n},\quad \tilde{S}_{n}^{\ast }=\sqrt{\frac{\tilde{\unicode[STIX]{x1D701}}_{n}c_{0}}{2\unicode[STIX]{x03C0}\unicode[STIX]{x1D70C}_{g}}}+\left(\frac{1}{2}+\frac{\tilde{\unicode[STIX]{x1D701}}_{n}c_{0}}{2\unicode[STIX]{x03C0}\unicode[STIX]{x1D70C}_{g}}\right)^{1/2}.\end{eqnarray}$$
The results for the corrected detachment time accounting for depletion effects are presented in figure 8(b), where they are seen to be compatible with the data, displaying qualitative agreement between experiments and theory. It is good to note that the comparatively large difference between model and experiment in figure 8(b) originates from the fact that (4.6) is based on pure diffusion and does not at all account for the enhanced growth caused by the onset of natural convection during the bubble growth. Nevertheless, the estimation (4.6) gives a good approximation for the increase in detachment time as bubbles keep growing in succession.
5 Conclusions
The origin of depletion effects in the successive diffusive growth of gas bubbles from the same nucleation site has been experimentally studied. A simplify theory has been described which is able to account for the basic features of the data. The depletion effect is caused by the contribution of natural convection to the bubble growth beyond the purely diffusive process. Thus, depletion occurs because diffusion is unable to replace the extra gas supplied by convection and removed by the detaching bubbles. The progressively increasing depletion reduces the mass transfer towards the bubbles and, therefore, their growth rate. The radius-versus-time curves of successive bubbles are different from each other, but can be collapsed through the introduction of a dimensionless depletion number
 $\unicode[STIX]{x1D6F6}_{n}$
, which can quantitatively account for the decrease of the local gas concentration around the bubble due to depletion. As a result, every bubble evolution curve can be adjusted to a universal evolution curve which accounts for diffusion when the Rayleigh number
 $Ra$
is small and changes afterwards to density-driven convection as
 $Ra$
becomes larger and larger. A first estimation of the detachment time can be also calculated from this depletion number, qualitatively accounting for the increase in the time bubbles take to grow and detach. Because of the depletion effect, the analytical solution given by Epstein & Plesset (Reference Epstein and Plesset1950) and adapted by Enríquez et al. (Reference Enríquez, Sun, Lohse, Prosperetti and van der Meer2014) is found to be valid only for the growth of the first few bubbles.
Acknowledgements
This work was supported by the Netherlands Centre for Multiscale Catalytic Energy Conversion (MCEC), an NWO Gravitation programme funded by the Ministry of Education, Culture and Science of the government of the Netherlands. We also thank M. Shirota, O. R. Enríquez and G.-W. Bruggert for the countless hours of discussion and generous help.
Appendix A. Solution for the point sink diffusion-driven mass transfer equation
For the derivation of (4.3), we start from the diffusive mass transfer equation in spherical coordinates, assuming that each bubble
 $n$
grows in an infinite domain in which the starting concentration corresponds to the depleted concentration
 $c_{n}$
left after the previous bubble growth:
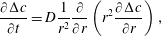 $$\begin{eqnarray}\frac{\unicode[STIX]{x2202}\unicode[STIX]{x0394}c}{\unicode[STIX]{x2202}t}=D\frac{1}{r^{2}}\frac{\unicode[STIX]{x2202}}{\unicode[STIX]{x2202}r}\left(r^{2}\frac{\unicode[STIX]{x2202}\unicode[STIX]{x0394}c}{\unicode[STIX]{x2202}r}\right),\end{eqnarray}$$
where
 $\unicode[STIX]{x0394}c=c-c_{n}$
is the concentration change with respect to a starting concentration level
 $c_{n}$
. Since the mass transfer partial differential equation (PDE) (A 1) depends on two variables, one of them being involved in a second partial derivative, three boundary conditions are needed to complete the final solution. As opposed to the Epstein & Plesset (Reference Epstein and Plesset1950) solution, equation (1.4), in which the conditions were given close to the bubble limit, we take a farther approach, namely, bubbles will be considered as a gas sink, studying the evolution of the surroundings of that point, which is extracting gas from the environment. Therefore, the boundary conditions can be written as
 $$\begin{eqnarray}\displaystyle & \displaystyle \unicode[STIX]{x0394}c(r,t=0)=0, & \displaystyle\end{eqnarray}$$
 $$\begin{eqnarray}\displaystyle & \displaystyle \unicode[STIX]{x0394}c(r\rightarrow \infty ,t)=0, & \displaystyle\end{eqnarray}$$
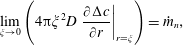 $$\begin{eqnarray}\displaystyle & \displaystyle \lim _{\unicode[STIX]{x1D709}\rightarrow 0}\left(4\unicode[STIX]{x03C0}\unicode[STIX]{x1D709}^{2}D\left.\frac{\unicode[STIX]{x2202}\unicode[STIX]{x0394}c}{\unicode[STIX]{x2202}r}\right|_{r=\unicode[STIX]{x1D709}}\right)={\dot{m}}_{n}, & \displaystyle\end{eqnarray}$$
 ${\dot{m}}_{n}$
is the mass loss rate. To solve the partial differential equation (A 1) with the boundary conditions (A 2a–c
), we assume self-similarity and non-dimensionalise in the usual way,
 $$\begin{eqnarray}\displaystyle & \displaystyle \unicode[STIX]{x0394}\tilde{c}=D\frac{r\unicode[STIX]{x0394}c}{{\dot{m}}_{n}}, & \displaystyle\end{eqnarray}$$
 $$\begin{eqnarray}\displaystyle & \displaystyle \tilde{r}=\frac{r}{\sqrt{Dt}}. & \displaystyle\end{eqnarray}$$
 $$\begin{eqnarray}-\frac{1}{2}\tilde{r}\frac{\text{d}\unicode[STIX]{x0394}\tilde{c}}{\text{d}\tilde{r}}=\frac{\text{d}^{2}\unicode[STIX]{x0394}\tilde{c}}{\text{d}\tilde{r}^{2}}.\end{eqnarray}$$
The three boundary conditions (A 2a–c ) for the PDE can be transformed into two for the similarity ordinary differential equation (ODE) (A 4), namely
 $$\begin{eqnarray}\displaystyle & \displaystyle \unicode[STIX]{x0394}\tilde{c}(\tilde{r}\rightarrow 0)=0, & \displaystyle\end{eqnarray}$$
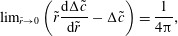 $$\begin{eqnarray}\displaystyle & \displaystyle \text{lim}_{\tilde{r}\rightarrow 0}\left(\tilde{r}\frac{\text{d}\unicode[STIX]{x0394}\tilde{c}}{\text{d}\tilde{r}}-\unicode[STIX]{x0394}\tilde{c}\right)=\frac{1}{4\unicode[STIX]{x03C0}}, & \displaystyle\end{eqnarray}$$
 $$\begin{eqnarray}\unicode[STIX]{x0394}\tilde{c}=-\text{erfc}(\tilde{r}/2)/(4\unicode[STIX]{x03C0}),\end{eqnarray}$$
or in dimensional variables
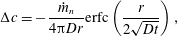 $$\begin{eqnarray}\unicode[STIX]{x0394}c=-\frac{{\dot{m}}_{n}}{4\unicode[STIX]{x03C0}Dr}\text{erfc}\left(\frac{r}{2\sqrt{Dt}}\right),\end{eqnarray}$$
which is equivalent to (4.3).


 Open access

