

Introduction
There is renewed research attention on the connection between CEOs and firm performance (e.g., Hambrick & Quigley, Reference Hambrick and Quigley2013; Mackey, Reference Mackey2008), and recent studies suggest the impact of CEOs on firm performance is substantial and is increasing over time (e.g., Quigley & Hambrick, Reference Quigley and Hambrick2014). Less research attention, however, is given to the proportion of variance in firm performance attributable to the CEO relative to other members of the top management team (TMT). Conceptually, it seems reasonable to expect that CEOs carry outsized influence over firm performance relative to other members of TMTs (Peterson, Smith, Martorana, & Owens, Reference Peterson, Smith, Martorana and Owens2003). Skillful CEOs' strategic choice can optimally allocate resources and establish a firm direction (Dean & Sharfman, Reference Dean and Sharfman1996); CEOs can draw attention and resources to the organization through their celebrity status (Sinha, Inkson, & Barker, Reference Sinha, Inkson and Barker2012); and they can exercise more influence over organizational performance because of their place in the organizational hierarchy (Finkelstein, Reference Finkelstein1992).
On the other hand, it is not uncommon for management literature to treat all members of the TMT as equal contributors to firm performance (e.g., Barrick, Bradley, Kristof-Brown, & Colbert, Reference Barrick, Bradley, Kristof-Brown and Colbert2007; Cannella, Park, & Lee, Reference Cannella, Park and Lee2008; Walters, Kroll, & Wright, Reference Walters, Kroll and Wright2010; Tien, Chen, & Chuang, Reference Tien, Chen and Chuang2013). Moreover, the upper echelons theory is based on the efforts of the entire team rather than the effect from any single individual (Carpenter, Geletkanycz, & Sanders, Reference Carpenter, Geletkanycz and Sanders2004; Hambrick, Reference Hambrick2007). This perspective treats CEOs, at least empirically, as equal members of the TMT (Ling, Simsek, Lubatkin, & Veiga, Reference Ling, Simsek, Lubatkin and Veiga2008). These inconsistent theoretical premises lead our research questions. First, we ask how much firm performance is explained by the CEO and by other TMT members. Second, we ask whether subgroups of other TMT members explain different amounts of organizational performance over the course of CEOs' tenure.
We address these questions through the theoretical perspective of upper echelons theory (Hambrick & Mason, Reference Hambrick and Mason1984, Hambrick, Reference Hambrick2007), and managerial power theory (Finkelstein, Reference Finkelstein1992). Upper echelons theory argues that the entire top management team affects firm performance, and managerial power theory posits that power is distributed unevenly within the top management team. Neither extreme position – that the CEO is just another member of the TMT nor that the CEO's contribution dramatically overshadows contributions of other TMT members – seems to reflect the reality of CEO and TMT contributions accurately. Our empirical analysis answers these research questions by disentangling the effect of the CEO from the effect of other TMT members on the variation in firm performance. While jointly estimating CEO and other TMT member effects on firm performance is a relatively straightforward task, we also investigate the indirect influence CEOs have on firm performance. Boards of directors hire CEOs with explicit strategic intent and CEOs know they have been hired to make strategic choices. To shift the firm paradigm, CEOs must rely on the top management team. Since CEOs have chief responsibility for hiring other TMT managers, they can exert influence over firm performance indirectly through their choice in strategic human resource management (Collins & Clark, Reference Collins and Clark2003). Lastly, CEO tenure heterogeneity could result in a different relation between the CEO and other TMT members. A newly hired CEO may struggle against organizational inertia, whereas CEOs with many years of tenure might be less inclined to change strategic vision. Consequently, we investigate whether CEO tenure heterogeneity affects the variation in firm performance for CEOs, continuing managers and managers appointed by the CEO.
Our research offers several contributions to the literature. First, strategy research has investigated what TMT characteristics are reflected in firm performance (Haleblian & Finkelstein, Reference Haleblian and Finkelstein1993; Keck, Reference Keck1997; Carpenter, Reference Carpenter2002). Domingues-CC and Barroso-Castro (Reference Domingues-CC and Barroso-Castro2017, Table 1) summarize much of this research. Research has not yet investigated the contributions of other TMT members based on whether the CEO hired the team member. Ling et al. (Reference Ling, Simsek, Lubatkin and Veiga2008) point out that one of the unique responsibilities of the CEO is the selection of the rest of the TMT. At least to our knowledge, we are the only study to investigate the relation between CEO hiring decisions and the variation in firm performance for CEO hired and continuing managers (new TMT members and continuing TMT members). Second, we build on research that investigates the power dynamic between the CEO and the other TMT members. This line of research is developed by Henderson and Fredrickson (Reference Henderson and Fredrickson2001); Patel and Cooper (Reference Patel and Cooper2014); Ridge, Aime, and White (Reference Ridge, Aime and White2015); Smith, Houghton, Hood, and Ryman (Reference Smith, Houghton, Hood and Ryman2006), and others. Many of these studies have investigated the upper management power dynamic, but few have investigated firm performance, (e.g., Henderson & Fredrickson, Reference Henderson and Fredrickson2001; Smith et al., Reference Smith, Houghton, Hood and Ryman2006) and none have estimated the amount of variation in firm performance explained by the CEO and TMT. Third, we also build on research focused on tenure heterogeneity by Hambrick, Humphrey, and Gupta (Reference Hambrick, Humphrey and Gupta2015), Carpenter (Reference Carpenter2002), and Henderson, Miller, and Hambrick (Reference Henderson, Miller and Hambrick2006). Specifically, we examine how CEO tenure affects CEO and manager influence on the variation in firm performance for both continuing managers and new managers. As far as we know, we are the first study to investigate this. Lastly, we use a large sample of firms with many different industry classifications and jointly estimate the effects of CEOs and other TMT members on firm performance. Prior literature, in contrast, has focused on limited industries (Smith et al., Reference Smith, Houghton, Hood and Ryman2006; Haleblian & Finkelstein, Reference Haleblian and Finkelstein1993).
In the sections that follow, we describe the literature and specify hypotheses. We then describe our sample and methodology. Finally, we outline our results and discuss the implications of our findings for current practice and future research.
Background and Hypotheses
CEO and other TMT members
There is a large literature, going back to Lieberson and O'Connor (Reference Lieberson and O'Connor1972), which examines the effects of CEOs on firm performance (see Hambrick & Quigley, Reference Hambrick and Quigley2013, Table 1, for a good summary of much of this literature, as well as Fitza, Reference Fitza2014; Quigley & Graffin, Reference Quigley and Graffin2017; and Quigley & Hambrick, Reference Quigley and Hambrick2014). The common factor in all of these studies is that they examine only the effect of the CEO on firm performance and exclude other members of the top management team. The key argument underlying this position is that the CEO controls the composition and actions of members of the TMT to the extent that other executives have a relatively little independent effect on performance. In contrast, the second line of literature treats all members of the TMT as equal contributors to firm performance (e.g., Barrick et al., Reference Barrick, Bradley, Kristof-Brown and Colbert2007; Barsade, Ward, Turner, & Sonnenfeld, Reference Barsade, Ward, Turner and Sonnenfeld2000; Cannella, Park, & Lee, Reference Cannella, Park and Lee2008; Finkelstein & Hambrick, Reference Finkelstein and Hambrick1990; Keck, Reference Keck1997; Smith, Smith, Olian, Sims, O'Bannon, & Scully, Reference Smith, Smith, Olian, Sims, O'Bannon and Scully1994; Walters, Kroll, & Wright, Reference Walters, Kroll and Wright2010). These lines of research are the extremes on a continuum. The third line of work investigates CEO and manager influence between these extremes but has focused on the power dynamic between CEOs and the remaining team members (e.g., Patel & Cooper, Reference Patel and Cooper2014; Ridge, Aime, & White, Reference Ridge, Aime and White2015). While many of these studies have investigated the upper management power dynamic, few have investigated firm performance, (e.g., Henderson & Fredrickson, Reference Henderson and Fredrickson2001; Smith et al., Reference Smith, Houghton, Hood and Ryman2006), and none have estimated how much variation in firm performance is explained by the CEO and TMT independently. Our research investigates how much of the variation in firm performance is explained by the CEO and the TMT, and this leads us to our first hypothesis:
Null Hypothesis 1
The effect of the non-CEO members of the TMT on firm performance is zero.
This hypothesis takes the extreme view that power is concentrated in the hands of a CEO. The alternative to this hypothesis is that CEOs engage in actions that allow the non-CEO members of the TMT to affect firm performance. The effect could range anywhere from non-CEOs having a small effect to having a larger effect on firm performance than that of the CEO. We do not predict an outcome on the continuum, but instead, let the data speak for itself.
New and continuing TMT members
Prior literature has suggested that an important responsibility of the CEO is who he or she selects for the management team (Ling et al., Reference Ling, Simsek, Lubatkin and Veiga2008). Even with a sitting CEO, there is turnover in the TMT (Barron, Chulkov, & Waddell, Reference Barron, Chulkov and Waddell2011; Ridge, Hill, & Aime, Reference Ridge, Hill and Aime2017), which leads to opportunities to appoint new members to the TMT. Moreover, when there is a change in the CEO, this person has opportunities to appoint new members to the TMT (Barron, Chulkov, & Waddell, Reference Barron, Chulkov and Waddell2011; Kesner & Dalton, Reference Kesner and Dalton1994). Newly appointed CEOs have clear ideas about what they are expected to accomplish (Henderson, Miller, & Hambrick, Reference Henderson, Miller and Hambrick2006). However, organizational inertia limits the rate of organizational change (Hannan & Freeman, Reference Hannan and Freeman1984). To overcome inertia, CEOs can replace TMT members with managers that fit with the CEOs paradigm (Hambrick & Fukutomi, Reference Hambrick and Fukutomi1991; Siggelkow, Reference Siggelkow2002). Consequently, the CEO may have a different amount of interdependence with new and continuing members of the TMT, which leads to our second hypothesis:
Null Hypothesis 2
The degree to which the other TMT members affect firm performance does not depend upon whether they are new members or continuing members of the team.
The alternative hypothesis is that the amount of influence the other TMT members have on firm performance does depend on whether the CEO hires them.
CEO tenure
In addition to investigating whether new or continuing other TMT members differentially influence the variation in firm performance, we also examine the effects of tenure heterogeneity on the variation in firm performance for the CEO and other TMT members. Theory suggests that newly hired CEOs gradually implement a strategic focus that meshes the firm to the environment and strategic issues (Henderson, Miller, & Hambrick, Reference Henderson, Miller and Hambrick2006). Hence, it might take time to align the organizational activities with the CEO's strategic view, given the organizational environment. Consequently, in a shorter-tenure CEO environment, existing TMT members might have more influence over the variation in firm performance than newly appointed TMT members. On the other hand, given the difficulty in changing organizational inertia, newly hired CEOs could attempt to change firm paradigms quickly by hiring managers to shake up the firm. In this case, managers appointed by shorter-tenure CEOs might have more influence over firm performance.
The literature argues that managers that serve together over time improve TMT cohesion (Carpenter, Reference Carpenter2002) and one would expect longer-tenure CEOs to have developed a management team over time and that these newly hired managers could have obtained a large amount of influence compared to remaining team members. Consequently, managers selected by a longer-tenured CEO could have more influence on firm performance than continuing managers not appointed by the CEO. To disentangle the effect of CEO tenure on the influence of TMT members, we divide our sample into shorter-tenure and longer-tenure CEO categories, which leads to our third hypothesis:
Null Hypothesis 3
CEO tenure length will not affect the influence on firm performance for the CEO, new managers, and continuing managers.
The alternative to this hypothesis is that tenure length will affect the influence of the CEO, new managers, or continuing managers.
To summarize, Null Hypothesis 1 is about the direct effects of the CEO and other TMT members on firm performance. Null Hypothesis 2 explores whether new or continuing managers employ greater influence over firm performance. Null Hypothesis 3 further investigates the effect tenure heterogeneity has on the influence over the performance of the CEOs, new managers, and continuing managers.
Data and Methodology
Data
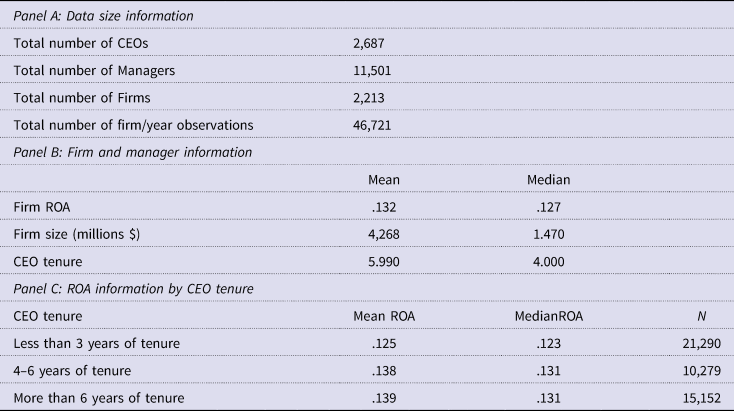
We use the Compustat Executive Compensation (ExecuComp) database, which reports data for the highest paid managers, including CEOs and other top managers, of many S&P large-, mid-, and small-cap companies, about 1,500 firms per year; all companies trade on US markets. We use data from 2004 through 2017. Our dataset excludes financial firms (SIC codes 6,000–6,999) and utility firms (SIC codes 4,000–4,999). We combine the ExecuComp data on manager characteristics with data on firms' financial characteristics from Compustat. We eliminate observations for which ROA or the firm's sales are missing. We use the program SAS and Excel for data manipulation and organization and the program STATA for data analysis. There are 2,687 CEOs and 11,501 non-CEO managers who work at 2,213 firms in our sample. Our sample includes 46,721 manager-years. A manager-year is the observation of one manager for 1 year and is commonly used when working with panel data. For instance, observing three managers over 10 years would be 30 manager-years of data. Sample summary statistics are reported in Panel A of Table 1.
Descriptive statistics

Top management team
An individual is included in the top management team if the person is listed in ExecComp. ExecuComp reports information on the highest paid executives; some firms include information on additional executives. An individual is the CEO if ExecuComp designates them as holding the title for the greatest part of the year. The mean size of the TMT is 3.26 members, and the median size is 3.0 members. The TMT ranges from 1 to 18 members.
The definition of the TMT is dictated by the availability of the data in the ExecuComp and is common in studies that rely on financial statement data. For example, Carpenter, Pollock, and Leary (Reference Carpenter, Pollock and Leary2003); Carpenter, Sanders, and Gregersen (Reference Carpenter, Sanders and Gregersen2001) and Bertrand and Schoar (Reference Bertrand and Schoar2003) define the TMT as the top five highest paid executives, including the CEO, listed in the financial statements. Barron, Chulkov, and Waddell (Reference Barron, Chulkov and Waddell2011) use the four highest-paid executives. Other studies using publically available data report similar mean TMT sizes (Haleblian & Finkelstein, Reference Haleblian and Finkelstein1993, mean TMT size 3.39; Wiersema & Bantel, Reference Wiersema and Bantel1992, mean TMT size 4.3). Surveys of top managers yield similar mean TMT sizes (Amason, Reference Amason1996, 3.45; Amason & Mooney, Reference Amason and Mooney1999, 4.9; Iaquinto & Fredrickson, Reference Iaquinto and Fredrickson1997, 4.2). Carpenter, Geletkanycz and Sanders (Reference Carpenter, Geletkanycz and Sanders2004, Table 1) summarize studies published between 1996 and 2003. These studies, which utilize a wide variety of definition of the TMT and a wide variety of data sources, report mean TMT sizes ranging from 3.4 to 13.2; with an average across studies of 6.48. Hambrick, Humphrey, and Gupta (Reference Hambrick, Humphrey and Gupta2015) using a different data source and definition report a mean TMT size of 8.58. In general, our definition of the TMT and the size of the TMT is on the low end, but consistent with existing studies.
New and continuing TMT members
To test Null Hypothesis 2, we need to distinguish between managers appointed by the CEO and continuing members of the TMT that were appointed by a previous CEO. A new manager is defined as a manager whose first year of tenure begins during the CEO's tenure. A continuing manager is defined as a manager hired by a prior CEO and whose tenure, therefore, begins before the first year of the CEO's tenure. For each year, we determine whether a manager is a new manager or a continuing manager. If a CEO and manager are both in ExecuComp in 2003, the first year of our sample, we do not know whether the CEO hired the manager. To disentangle this issue, we collect information on CEOs and managers starting in 1994, 9 years before our sample begins. Then, over the 9 years, we classify whether the manager is hired by the CEO. Incorporating this information allows us to more correctly classify managers as either new managers or continuing managers in 2003. Our only dilemma is when the non-CEO manager and CEO both work for a firm before 1994 and continue their tenures through 2003. In this case, we cannot tell if the manager is a new manager or a continuing manager. We classify these managers as new managers when it is possible they should be classified as continuing managers. We find that 1.8% (210/11,501) of managers worked for the firm before 1994, and these managers are classified as new managers. This classification will bias downward the amount of total variance explained by the new managers. Consequently, the amount of total variance explained by new managers is likely slightly higher than reported in the results. However, since the variance explained by CEO-hired managers is significantly different than that of continuing managers, any misclassification of CEO-hired managers does not materially affect the results.
CEO tenure
To test Null Hypothesis 3, we divide the sample into three categories based on the length of CEO tenure. The short-tenure CEO category consists of newly hired CEOs with 1–3 years of tenure. The medium-tenure CEO category is made up of CEOs with 4–6 years of tenure. The long-tenure category is made up of CEOs with more than 6 years of tenure. The data primarily drive the choice of these ranges. Panel B of Table 1 shows that the average tenure of a CEO in our sample is 5.99 years, and just over one-half of the CEOs leave their position in the first 4 years of tenure. Consequently, we remove the middle tenure length category (4–6 years of tenure) from our analysis and focus on the shorter- and longer-tenure CEO categories. Panel C of Table 1 shows the mean and median ROAs for each sub-group. ROA ranges from 12.5% for the short-tenure CEO category to 13.9% for the long-tenure CEO category. The number of observations is large for the two categories, ranging from 21,290 for the short-tenure category to 15,152 for the long-tenure category.
Firm performance
We use return on assets (ROA) as the measure of firm performance. We measure ROA as the ratio of earnings before interest, taxes, and depreciation (EBITDA) to book value of assets (BVA). Both EBITDA and BVA have been adjusted to constant 2010 dollars. The mean and median values of ROA 13.2% and 12.7% respectively, as reported in Panel B of Table 1. We also report the book value of total assets. The mean firm size is $4,268 million and the median firm size is $1.470 million. The difference between mean and median size results from several larger firms in the ExecuComp database.
Empirical model
The objective of our analysis is to estimate the percent of the total variance explained by the CEO and by the rest of the managerial team. We use the model:
 $$y_{ijt} = {\rm \alpha} + {\rm \beta} _i + {\rm \gamma} _i + {\rm \varepsilon} _{ijt}$$
where y ijt is ROA for manager i in firm j in year t, βi is the effect of the CEO on performance, γi is the effect on the non-CEO manager on performance and εijt is the error term. We estimate the model by simultaneous ANOVA. The model is estimated by industry to control for industry effects.
Results
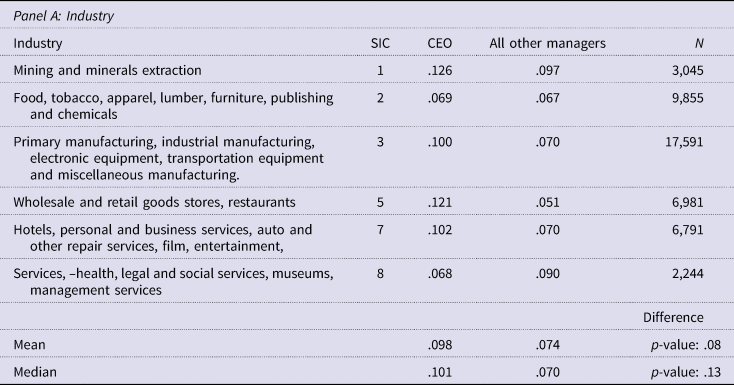
Table 2 reports the variance decompositions for the CEO and manager effects by industry. We focus on the results in Panel A to test Null Hypothesis 1. There is substantial variation in the CEO effects, with the largest (mining and minerals, SIC group 1) nearly twice the smallest (food, tobacco, apparel, etc., and Services, SIC groups 2 and 8). There is less variation in the manager effects across industries. The CEO effects are larger than the manager effects for mining, heavy manufacturing, food and tobacco, wholesale and retail, and hotels and business services (SIC groups 1, 2, 3, 5 and 7) and smaller for other services (SIC group 8). The mean (median) CEO effect is .098 (.101) and the mean (median) manager effect is .074 (.070). The difference in the mean effect for non-CEO managers is statistically significant (p-value = .08), but the median is not (p-value = .13). This provides some evidence, but not conclusive evidence, for the rejection of Null Hypothesis 1.
CEO and manager effects. Table measures the amount of variation in ROA explained by CEOs, new managers hired by the CEO and continuing managers. ROA is measured as earnings before interest, taxes, and depreciation (EBITDA) divided by book assets

These results suggest that the power distribution between the CEO and other TMT members does not result in complete dominance by the CEO, nor does it result in an equal distribution of power between the CEO and the rest of the TMT. Instead, these results show that other TMT managers have an effect on firm performance but that their effect is not as strong as the influence CEOs have over performance, a result that is not consistent with Null Hypothesis 1. The relative effects of the CEO and other TMT members on firm performance range from other TMT members having more of an effect (SIC 8) to CEOs having over two times as much influence on firm performance (SIC 5). All industries, except SIC 8, show the CEO as having a greater effect on firm performance than non-CEO managers. Our empirical results are consistent with an intermediate distribution of power within the TMT and are consistent with research on the distribution of power within TMTs (e.g., Patel & Cooper, Reference Patel and Cooper2014; Ridge, Aime, & White, Reference Ridge, Aime and White2015; Smith et al., Reference Smith, Houghton, Hood and Ryman2006). The results suggest that while non-CEO managers are important, there is evidence that the CEO has a greater effect on firm performance and is more important than other individual TMT members.
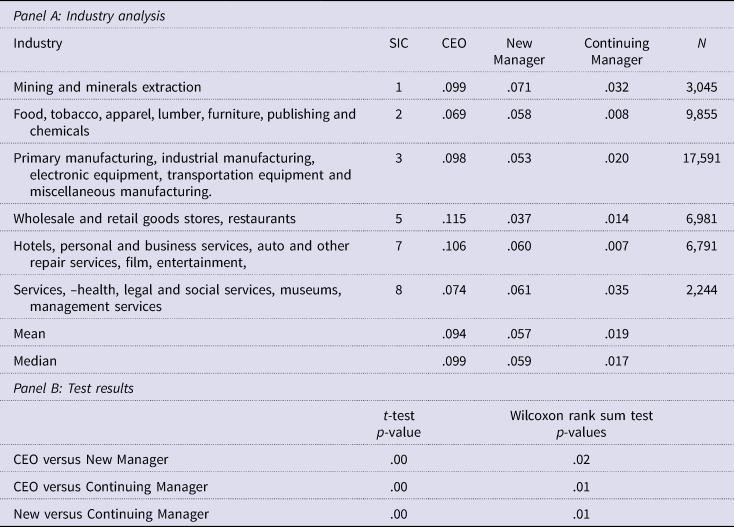
Table 3 gives results for testing Null Hypothesis 2. Null Hypothesis 2 distinguishes between managers appointed by the CEO and managers that are continuing members of the TMT. Table 3, Panel A, reports variance decompositions of firm performance by the industry for CEOs and for new and continuing managers. The CEO effects are all approximately the same size as those reported in Table 2. The CEO effects are larger than the new manager effects for all industries. The mean (median) CEO effect is .094 (.099), while the mean (median) new manager effect is .057 (.059). The new manager effects are, in turn, larger than the continuing manager effects (mean .019, median .017). The differences in the means and medians are all statistically significant; p-values are reported in Panel B. Thus, the results in Table 3 are not consistent with Null Hypothesis 2. The difference between new managers' and continuing managers' impact on firm performance is, at least to our knowledge, a new result. Also, observe that, for each industry, the variance decomposition for new and continuing managers in Table 3 sum to approximately the value of the variance decomposition for all managers combined in Table 2. This implies that most of the effect of managers on firm performance is due to the managers appointed by the CEO. This highlights the importance of the CEO, not just in his/her role as a corporate leader because of hierarchy, but in his/her role in adding talent to the TMT.
CEO and manager effects: New and continuing managers. Table measures the amount of variation in ROA explained by CEOs, new managers, and continuing managers. ROA is measured as earnings before interest, taxes, and depreciation (EBITDA) divided by book assets

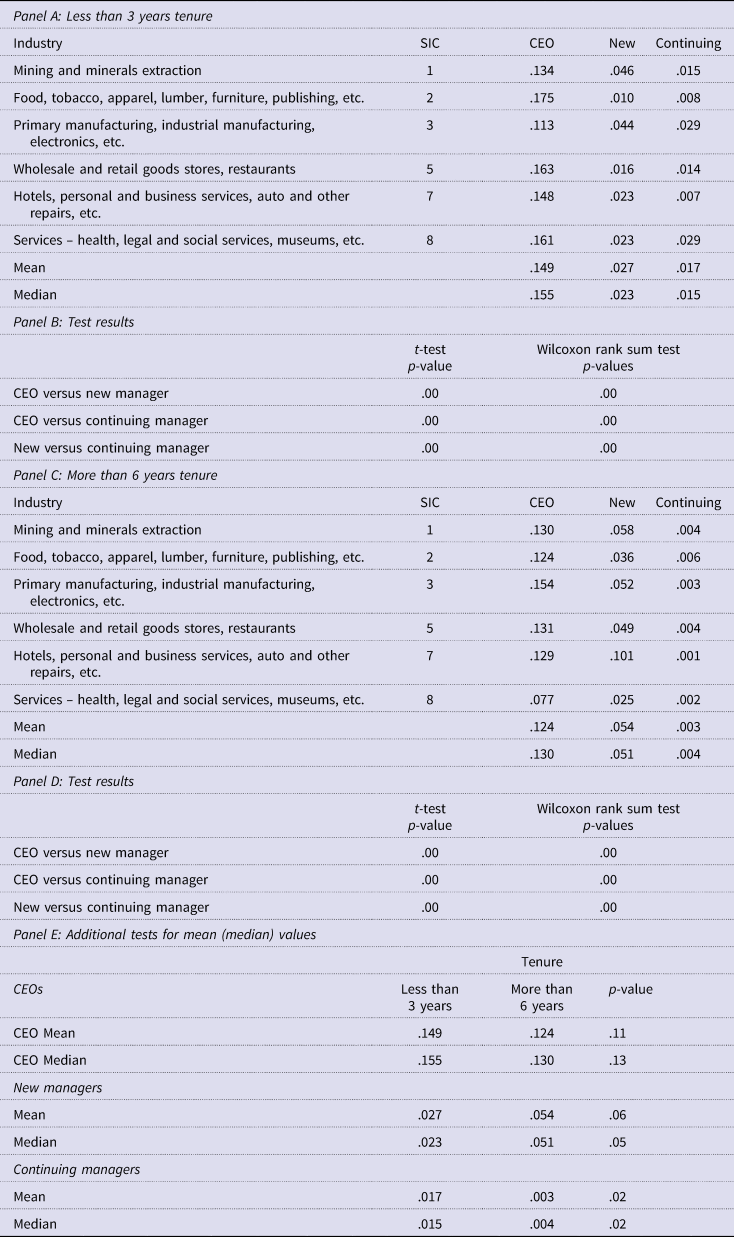
Table 4 provides results for Null Hypothesis 3. Panels A and B focus on short-tenure CEOs and Panel C and D focus on long-tenure CEOs. Panel E uses the same mean and median information as Panels A and B, but the information is grouped differently so that additional tests can be performed to investigate Null Hypothesis 3.
CEO and manager effects: With CEO tenure. Table measures the amount of variation in ROA explained by CEOs, non-CEO managers hired by the CEO and continuing managers, that is those not hired by the CEO. ROA is measured as earnings before interest, taxes, and depreciation (EBITDA) divided by book assets

In Panel A of Table 4, we provide the variance decomposition for CEOs with 3 years or less of tenure. In every industry classification, the CEO has more influence over firm performance than new managers. The point estimates also suggest that in every industry except SIC 8, the new managers have more influence over performance than continuing managers. The mean value for the CEO is .149 (median .155). New managers have a mean value of .027 (median .023), and continuing managers have a mean value of .017 (median .015). The test results in Panel B are significant for CEOs compared to new and continuing managers, with a mean p-value of .00 (median .00). These results suggest that new managers hired during the CEO's early years of tenure have a greater influence on firm performance than continuing managers. These results provide evidence that, on average, CEOs bring in new managerial talent to change firm performance by shaking up the management team and it leads to an immediate change.
The results of the variance decomposition for CEOs with tenure of more than 6 years are provided in Panel C. Again, in every industry classification, the CEO has more influence than new managers, and new managers have more influence than continuing managers. The mean value for the CEO is .124 (median .130), and for new managers, it is .054 (median .051), and for continuing managers, it is .003 (median .004). The test results in Panel D, comparing the differences in mean and median for each of the groups, are all statistically significant. New managers have more influence over firm performance than continuing managers; indeed, the effect of continuing managers on firm performance is quite small. These results suggest that new managers have more influence over firm performance than continuing managers for long-tenured CEOs. We use Panel E to investigate the influence over firm performance for managers of short- and long-tenure CEOs more completely and to test Null Hypothesis 3.
Panel E regroups the information in Panels A and B by manager type and then by CEO tenure length. The results show that the CEO influence over firm performance changes from a mean of .149 (median .155) for CEOs with 3 years or less of tenure to a mean of .124 (median .128) for CEOs with more than 6 years of tenure. The test results are not significant, suggesting no difference in CEO influence over firm performance as CEO tenure increases. However, it appears CEOs increase their influence through their hiring decisions. For new managers, the mean estimate increases from .027 (median .023) for 3 years or less of CEO tenure to a mean of .054 (median .051) for CEOs with more than 6 years of tenure. The test results show a statistically significant difference in the means (p-value = .06) and medians (p-value = .05). This provides evidence that while CEO-hired managers have influence over firm performance when hired, they continue to gain more influence through time.
For continuing managers, the mean estimate decreases from .017 (median .015) to .003 (median .004), and the test results are significant at the 5% level. This result provides evidence that continuing managers lose influence over firm performance through time. These results, taken together, suggest that CEO direct power does not change over time, but indirectly, CEOs might have more influence over firm performance through their choice of other top management team members.
We conclude that CEO-hired managers increase their influence over firm performance as CEO tenure increases. Continuing managers see their influence over firm performance reduced as CEO tenure increases. CEO-hired managers have influence immediately after they are hired and continue to increase their influence through time. In sum, continuing managers lose influence over time even when while CEO-hired managers increase their influence. While CEOs direct influence over firm performance over time does not change, we find evidence that CEO indirect influence, through the hiring process, increases over time.
Discussion
In this paper, we examine the relative contributions of CEOs and the other top management team members of the TMT on firm performance. We find that the effect of CEOs on firm performance, while significant, is smaller than what recent estimates (Hambrick & Quigley, Reference Hambrick and Quigley2013; Mackey, Reference Mackey2008) suggest. Furthermore, while other TMT member effects are smaller than CEO effects, these effects do make a substantial contribution to firm performance. We find that managers selected by the CEO explain a greater amount of variance in firm performance than managers not hired by the chief executive. We also find that the chief executive's tenure does not directly affect CEO influence over firm performance, but does indirectly affect the CEO's influence over firm performance. This indirect CEO influence results from the TMT members' influence increasing with the tenure of the CEO who hired them. Our results are consistent with versions of upper echelons theory that recognize that the CEO exerts greater influence over firm performance than other TMT members, although that influence is far from exclusive.
These results, taken together, illustrate both the direct and indirect influence of CEOs on firm performance. Ling et al. (Reference Ling, Simsek, Lubatkin and Veiga2008) point out that one of the unique responsibilities of the CEO is the selection of the rest of the TMT and CEOs have a critical role to play in the strategic management of executive-level human resources (Collins & Clark, Reference Collins and Clark2003). Although the popular press often exalts the critical role of CEOs in the strategic hiring and deployment of a firm's human resources (e.g., Isaacson, Reference Isaacson2011), very few researchers have directly investigated how leaders shape HRM systems (Jackson, Schuler, & Jiang, Reference Jackson, Schuler and Jiang2014). Furthermore, if the contributions of non-CEO TMT members have been overlooked or underestimated, there are implications for boards of directors, who may wish to take a greater role in evaluating the hiring philosophies of newly appointed CEOs.
We also contribute to the literature by investigating the influence of CEOs and TMT members, both hired by the CEO and not, over time. Our findings suggest a nuance that can only be revealed by examining outcomes over time. That is, while CEO hires shake up the firm to instigate immediate results, they also garner power over time. In turn, it appears to take time for continuing managers to lose influence and to have less of an effect on firm performance. We hope that our approach will inspire additional research to investigate precisely the full extent to which CEOs influence the contributions of other TMT members and firm performance overall.
As with any research, there are weaknesses and limitations of our study. Our analysis covers the broad range of US industries and reveals cross-industry variation in the effect of CEOs and other managers on firm performance. Further analysis is needed to understand the cross-industry pattern. If the ability to affect firm performance reflects the distribution of power within the top management team, the ability to affect firm performance, then our results have implications for how the distribution of power evolves over time. While our study shows the effect of new TMT members is greater for long-tenure CEOs than for short-tenure CEOs, our data do not allow us to explore the specific means through which chief executives influence other TMT members. We leave it to further research to investigate the degree to which this result is from increased individual influence, improved team cohesion and increased numbers of CEO-hired managers over time.
Author ORCIDs
Jeff Brookman, 0000-0001-9160-0973
Acknowledgements
We have benefited from helpful comments and suggestions from two anonymous referees. All errors are our responsibility.