I. INTRODUCTION
Self-assembling and self-organizing techniques are now well-established routes to manufacture nanoscale materials in one or more dimensions. In the context of making metallic nanostructures, the spontaneous dewetting of thin films under thermal treatment has been widely investigated.Reference Herminghaus, Jacobs, Mecke, Bischof, Fery, Ibn-Elhaj and Schlagowski1–Reference Favazza, Trice, Gangopadhyay, Garcia, Sureshkumar and Kalyanaraman6 Among the possible heating sources, nanosecond (ns) laser pulses have proved to be important because of their ability to rapidly raise the metal temperature to beyond its melting point and also being able to capture intermediate stages of dewetting due to high quenching rates (∼1010 K/s for ns pulses). As a result, several important fundamental principles of dewetting, first seen in polymeric systems,Reference Sharma and Khanna7–Reference Vrij and Overbeek10 have been observed and confirmed in metallic systems. For example, in single layer metal films of nanometer thickness, dewetting of metal films via the classical spinodal instability has been quantitatively verified by a number of investigations. In spinodal dewetting, an initially smooth film is destabilized because attractive intermolecular forces, such as the Hamaker forces, overcome the stabilizing effect of surface tension.Reference Vrij11 In such systems, the ambient/film/substrate free energy behavior is reminiscent of that in immiscible binary systems with spinodal behavior, i.e., the free energy curvature has negative values over a range of concentration, and in this region, the microstructure can spontaneously evolve into segregated regions with well-defined length scales. There is ample evidence for metal films that over a thickness range in which the free energy curvature is negative, dewetting proceeds spontaneously with a characteristic length scale and analogous to spinodal phase segregation; this behavior is now referred to as spinodal dewetting. In the classical spinodal dewetting theory, the length scale λ, as defined by the size or spacing between morphological features, is predicted to scale with film thickness h as λ ∝ h 2, and this has been verified for a number of metal films.Reference Herminghaus, Jacobs, Mecke, Bischof, Fery, Ibn-Elhaj and Schlagowski1, Reference Krishna, Favazza, Gangopadhyay and Kalyanaraman12–Reference Trice, Thomas, Favazza, Sureshkumar and Kalyanaraman14
The earliest detailed study of pulsed laser dewetting of Au films was reported by Bischof et al.Reference Bischof, Scherer, Herminghaus and Leiderer15 on films of ≥25 nm. Since then there have been several experimental and theoretical investigations of pulsed laser dewetting in other metal systems that included films of a few nanometer thickness.Reference Favazza, Trice, Gangopadhyay, Garcia, Sureshkumar and Kalyanaraman6,Reference Favazza, Kalyanaraman and Sureshkumar16,Reference Henley, Carey and Silva17 Those studies have revealed new and useful features of dewetting, such as a distinct difference in the early stage morphology for thin versus thick films, the deviation from spinodal dewetting behavior due to novel nanoscale thermocapillary effects under the laser melting, and the nonequilibrium materials behaviors that can result due to the rapid heating and cooling under the laser pulses.Reference Krishna, Sachan, Strader, Favazza, Khenner and Kalyanaraman13,Reference Trice, Thomas, Favazza, Sureshkumar and Kalyanaraman14,Reference Krishna, Strader, Gangopadhyay and Kalyanaraman18–Reference Favazza, Kalyanaraman and Sureshkumar20 In addition, sophisticated modeling and computational tools that incorporate the complex mass transport under the highly transient nature of heating have also evolved and now are capable of capturing the dewetting process in a fully three-dimensional (3D) manner.Reference Wu, Fowlkes, Rack, Diez and Kondic5,Reference Khenner, Yadavali and Kalyanaraman21–Reference Khenner, Yadavali and Kalyanaraman23 In this study, we revisit the behavior of Au dewetting in the thickness regime ≤25 nm and specifically between 3 and 16 nm, to establish whether the classical spinodal dewetting behavior for Au is manifested in this region of thickness as well as whether the transition in the dewetting morphology is present. We also evaluated the strength of thermocapillary effects in Au dewetting under the ns pulses by theoretical modeling and found them to be much weaker than the dispersion forces, as confirmed in the experiment. Comparison of Au with other metals, including Ag and Co, showed that much smaller dewetting nanostructures occur in Au likely due to its much larger effective Hamaker coefficient. Computations of nonlinear dynamics were utilized to study the morphology evolution in the course of dewetting in 3D for a 5-nm thick Au film. This study showed that bicontinuous structures occur during early stages of dewetting, and these break up to form nanoparticles, consistent with experiments.
This study of Au dewetting has implications to nanomanufacturing of Au nanostructures in reliable but robust ways for use in a variety of applications. Specifically, controlling size and spacing of Au nanoparticles on a substrate has implications for catalysis of nanowire growth,Reference Wu, Shi and Chopra24,Reference Takagi, Homma, Hibino, Suzuki and Kobayashi25 and in chemical sensing by plasmonic optical effects,Reference Daniel and Astruc26–Reference Ankamwar, Chaudhary and Sastry31 including surface enhanced Raman scattering (SERS)Reference Wei, Kim, Sadtler and Tripp29,Reference Hering, Cialla, Ackermann, Dörfer, Möller, Schneidewind, Mattheis, Fritzsche, Rösch and Popp32,Reference Suzuki, Niidome, Kuwahara, Terasaki, Inoue and Yamada33 and surface plasmon resonance (SPR) techniques.Reference Taton, Mirkin and Letsinger34,Reference Elghanian, Storho, Mucic, Letsinger and Mirkin35 In addition, such investigations providing correlations between experiments and computer models that attempt to capture the complex physics of mass and energy transport under highly transient conditions can lay the foundations for future computer-driven nanomanufacturing scenarios.
II. EXPERIMENTAL DETAILS
Au films with thickness from ∼3 to 16 nm were deposited in high vacuum (∼1 × 10⁻⁸ Torr) by electron beam deposition at room temperature onto commercially obtained, optical quality, SiO2/Si wafers consisting of 400-nm thick thermally grown oxide layer on polished Si(100) wafers.Reference Favazza, Kalyanaraman and Sureshkumar16 The wafers were cleaned in methanol, acetone, and DI water. The deposition rate used here was typically ∼1.5 nm/min as confirmed by atomic force microscopic (AFM) step height measurements. Energy dispersive x-ray spectrometry (EDS) was used to measure the Au counts of the deposited films in a scanning electron microscope (SEM). The EDS counts were converted into an equivalent thickness value by using calibration based on step-height measurements of the film thickness. Surface roughness of the deposited films were measured by AFM and established an upper limit of 0.5 ± 0.2 nm for the average root mean square (RMS) roughness over the entire thickness range. Deposited films were irradiated by a varying number of pulses n (∼10 to 10,500) from a 266 nm ultraviolet laser having a pulse width τp of 9 ns. Irradiation was performed at normal incidence by an unfocused laser beam of area 1 × 1 mm2 at a repetition rate of 50 Hz. The dewetting morphology was investigated as a function of film thickness h and the number of pulses n, which typically ranged between 10 and 10,500 pulses, for irradiation at laser energies at or just above the melt threshold of the films. For each thickness the melt threshold was determined by a visible roughening of the metal film surface, as detected under high-resolution SEM within the longest time scale of the experiment (i.e., after 10,500 laser pulses).Reference Krishna, Sachan, Strader, Favazza, Khenner and Kalyanaraman13,Reference Trice, Thomas, Favazza, Sureshkumar and Kalyanaraman14 The range of E used for the thickness regime investigated here was 40 ≤ E ≤ 100 mJ/cm2. For this irradiation condition, the heating and cooling rate of the metal film was of the order of 1010 K/s with a total heating and cooling time per pulse of ∼100 ns, which was much smaller than the spacing between pulses, which is 20 ms. Consequently, it has been quantitatively shown earlier by Favazza et al.Reference Favazza, Kalyanaraman and Sureshkumar20 that negligible contribution to the morphology evolution is expected from processes in the solid state. Hence, any morphology change occurring is primarily during the liquid phase following each pulse. It was confirmed by EDS measurements that the laser irradiation did not result in substantial evaporation of the Au, even after the longest irradiation experiments of 10,500 pulses. To better understand the transient thermal behavior and magnitude of thermal gradients in Au films, thermal modeling for Au films was computed using COMSOLReference Shirato, Strader, Kumar, Vincent, Zhang, Karakoti, Nacchimuthu, Cho, Seal and Kalyanaraman36 using an optical thermal model as mentioned in Ref. Reference Shirato, Strader, Kumar, Vincent, Zhang, Karakoti, Nacchimuthu, Cho, Seal and Kalyanaraman36. This modeling included the use of temperature dependent material parameters and all phase changes.
III. RESULTS AND DISCUSSION
A. Spinodal dewetting in Au films
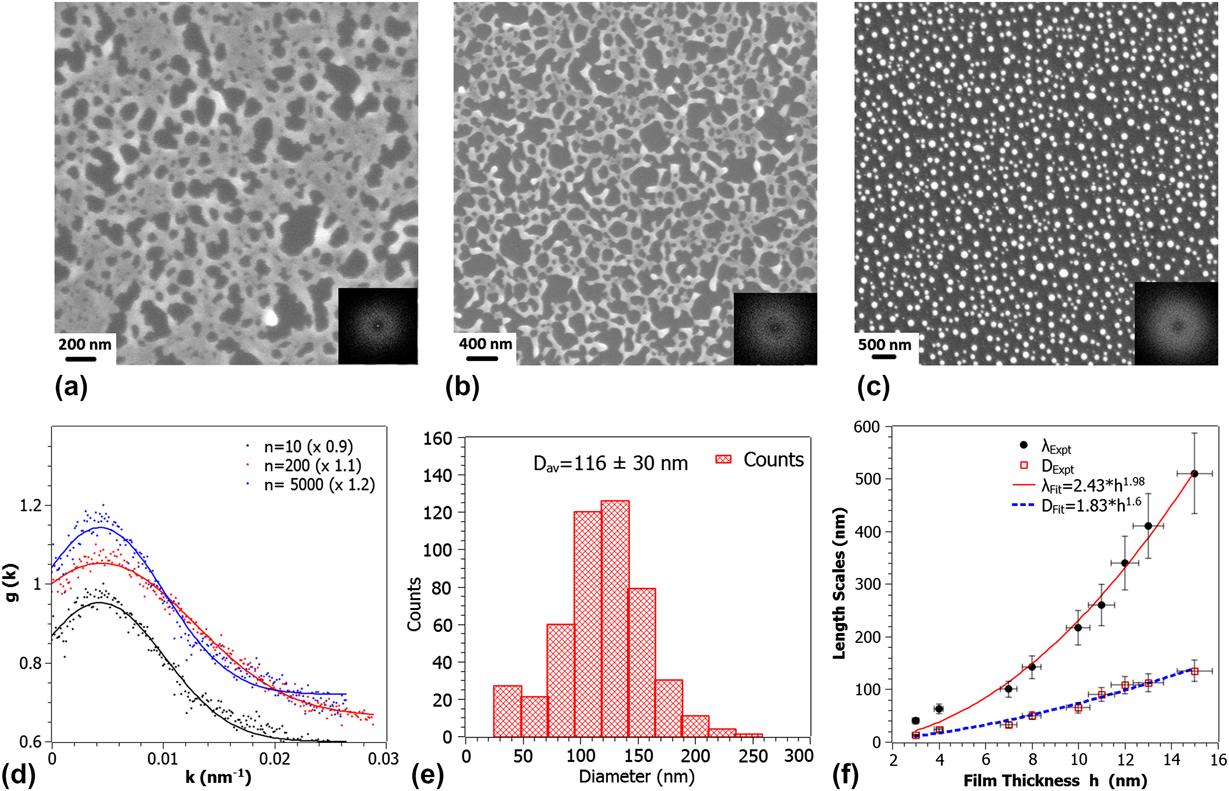
Figures 1(a)–1(c) show the dewetting morphology observed following irradiation of 12 nm Au films at an energy density E = 70 mJ/cm2 for increasing number of laser pulses n. After a few pulses, n = 10, the dewetting morphology is characterized by holes as shown in Fig. 1(a). As n is increased the metal/substrate contact lines recede to the edge of the holes resulting in a network of coalescing polygon features and continued irradiation results in the formation of nanoparticles primarily at the junctions of the polygons.Reference Favazza, Kalyanaraman and Sureshkumar16 Quantitative information about the spatial characteristics of these morphologies was obtained by evaluating the fast Fourier transform (FFT) of the SEM image contrast, which is related to the dewetting film’s height variations. The resulting FFT information of the contrast correlation is shown in the inset of each figure, and the important information here is the annular form for each of the films. This annular FFT is indicative of a narrow band of characteristic length scales L for the height variations on the surface. This is an important observation given that the dewetting morphology can progress via any of the three pathways: homogeneous nucleation, heterogeneous nucleation, or spinodal dewetting.Reference de Gennes, Brochard-Wyart and Quere37 In the case of homogeneous nucleation, the features are randomly distributed, both spatially and in time, and no characteristic length scale should appear in this type of dewetting.Reference Stange and Evans38 Heterogeneous nucleation can occur due to defects, impurities, or other experimentally imposed heterogeneities. In this type of dewetting, a characteristic length scale could appear at the early stages of dewetting only in the presence of available ordered nucleation sites. However, we have not observed spatially ordered heterogeneities on the substrate surface, as well as on the as-deposited films, prior to irradiation.
(a–c) SEM images of progression of dewetting in 12-nm thick film with increasing number of laser pulses n (10, 200, and 10,500). (d) Plot of the RDF for each stage of dewetting with Gaussian peak fitting. The peak position in the RDF was used to estimate the characteristic length scales. (e) Size distribution and average diameter of nanoparticles from the SEM image of (c). (f) Analysis of the various length scales in the final robust nanoparticle state as a function of film thickness. The fits show the exponent in good agreement predictions from linear thin film hydrodynamic theory.

The characteristic length scale associated with spinodal dewetting is established at the very early stages of film deformation.Reference Herminghaus, Jacobs, Mecke, Bischof, Fery, Ibn-Elhaj and Schlagowski1 The early stage undulations, which occur prior to the appearance of large height variations in the film, are extremely difficult to capture experimentally. However, the subsequent morphology, which is a result of ripening of the initial undulations, forms as dewetting progresses and has length scales directly related to the initial length scale. Therefore, as shown by many authors, the final nanoparticle length scale can be used as a measure of the thickness-dependent behavior.Reference Reiter9,Reference Favazza, Kalyanaraman and Sureshkumar16 Here, the length scales were measured at different stages of the dewetting process as a function of film thickness. In Figs. 1(a)–1(c), the progression of the morphology is shown for the 12 nm film as a function of laser pulses between 10 and 10,500 shots. Figure 1(d) is the radial distribution function (RDF) for each measured stage of the 12 nm film. From the position of the peaks in such RDF measurements, obtained directly from the FFT’s, it was possible to generate the characteristic length scale present in the pattern at each stage. The initial rapid increase in the characteristic length scale corresponds to the increase in the average size of the initial nanomorphologies, either bicontinuous structures or holes, while the decrease corresponds to break-up of these nanomorphologies into nanoparticles, with long time value representing the characteristic length scale of the film. The final size distribution of the nanoparticles was established to be monomodal as shown in Fig. 1(e).
To confirm quantitatively if this was indeed the classical spinodal dewetting, we investigated the experimental variation of the nearest neighbor inter-particle spacing λ as a function of the film thickness h. From thin film hydrodynamic theory of spinodal dewetting, it is known that λ should vary with film thickness h as λ =  ${\sqrt {{\textstyle{{{\rm{16\pi }}^{\rm{3}} {\rm{\gamma }}} \over {A}}}} h^{\rm{2}} }$, where γ is the film-vacuum interface energy and A is the Hamaker coefficient characterizing the strength of the intermolecular dispersion forces.Reference Vrij11,Reference Favazza, Kalyanaraman and Sureshkumar16 In Fig. 1(f) (closed symbols), the experimentally determined variation of length scales λ and average particle diameter D is plotted with film thickness. A power law fit to the variation in λ yields λ = 2.43h 1.98, which is in excellent agreement with the theory predicted trend [Fig. 1(f)–solid line]. The variation in D of the nanoparticles as a function of film thickness h is shown in Fig. 1(f) (open symbols). A power law fit to our experimental data gives D = 1.6h 5/3, which is in good agreement with the theory prediction based on volume conservation arguments.Reference Reiter9,Reference Trice, Thomas, Favazza, Sureshkumar and Kalyanaraman14 Hence, these experimental studies in the 3–16 nm thickness range confirmed that Au dewets by the classical spinodal dewetting mechanism.
B. Experimentally determined Hamaker coefficient
Surface forces between two bodies in close proximity plays an important role in thin film sciences. Dispersion forces such as the van der Waals force, which arises from the interaction of oscillating dipoles, has a role in controlling many aspects of the behavior of materials. It controls or influences macroscopic phenomena such as surface tension, wetting behavior, and adhesion. The van der Waals interaction can be quantified through the Hamaker constant A, which is a material property.Reference Israelachvili39,Reference Argento and French40 IsraelachviliReference Israelachvili39 has provided a description of the different methods available to obtain the Hamaker constant for different materials and configurations, including multilayer structures, such as the one involved in thin film dewetting scenarios. In fact, spinodal dewetting offers a potential route to estimate the effective Hamaker constant A eff. Since the characteristic length scale for spinodal dewetting is known to vary as λ =  $\sqrt {{\textstyle{{{\rm{16\pi }}^{\rm{3}} {\rm{\gamma }}} \over {A}}}} h^{\rm{2}}$, the power law fit to experimentally observed spacing for metal films yields the form λ = Bh 2,Reference Trice, Thomas, Favazza, Sureshkumar and Kalyanaraman14 with height expressed in nanometers, where “B” is the preexponential factor expressed in nm−1. From the experimentally established preexponent factor of B, the Hamaker coefficient for metals can be estimated upon using the known value of γ.Reference Lu and Jiang41 Previous works have extracted the effective A values for other metals in a similar manner, including for Ag, Co, Cu, and Fe, and these are tabulated in Table I and compared to the theoretical predictions taken from Ref. Reference Israelachvili39.
Effective Hamaker coefficients A eff of various metals estimated from h 2 behavior of experimentally measured dewetting length scales. Theoretical values obtained from Ref. Reference Israelachvili39 are also shown. For iron, the A value was estimated from length scales versus film thickness data reported in Ref. Reference Krishna, Favazza, Gangopadhyay and Kalyanaraman12. The experimentally determined transition thickness and range of correlation lengths are also shown.

Materials values of Au used in thermal simulation, with the thermal values for substrate taken from.Reference Khenner, Yadavali and Kalyanaraman21,Reference Shirato, Strader, Kumar, Vincent, Zhang, Karakoti, Nacchimuthu, Cho, Seal and Kalyanaraman36

C. Transition thickness
In spinodal dewetting of thin metal or polymer films, the final nanoparticle stage occurs through the morphology sequence Film → Intermediate stage → Nanoparticles. The intermediate stage morphology can be either of bicontinuous type or hole-like. More interestingly, it has been observed in metal and polymer filmsReference Sharma and Khanna7,Reference Seemann, Herminghaus and Jacobs8,Reference Krishna, Sachan, Strader, Favazza, Khenner and Kalyanaraman13,Reference Yadavali, Krishna and Kalyanaraman42 that below a specific thickness, the observed intermediate stage morphology is bicontinuous while above it, it is hole-like, and this thickness value is termed as the transition thickness h T. Theoretically, h T for a single layer film is strongly correlated to the minima of the free energy curvature, which, in turn, is the second derivate of the thickness-dependent free energy of the film/substrate system.Reference Sharma and Khanna7,Reference Krishna, Sachan, Strader, Favazza, Khenner and Kalyanaraman13,Reference Yadavali, Krishna and Kalyanaraman42 The free energy G and its curvature for a single layer film on a substrate are given byReference Krishna, Sachan, Strader, Favazza, Khenner and Kalyanaraman13,Reference Yadavali, Krishna and Kalyanaraman42 :
 $$\Delta G = {A \over {{\rm{2}}h^{\rm{2}} }} - {{Ah_{\rm{c}}^6 } \over {{\rm{24}}h^{\rm{8}} }} + S^p {\rm{exp(}} - {h \over l}{\rm{)}}\quad,$$
 $${{\partial ^{\rm{2}} {\rm{\Delta }}G} \over {\partial h^{\rm{2}} }} = {{{\rm{3}}A} \over {h^{\rm{4}} }} - {{{\rm{3}}Ah_{\rm{c}}^6 } \over h^{{\rm{10}}} }} + {{S^p } \over {l^{\rm{2}} }}{\rm{exp(}} - {h \over l}{\rm{)}}\quad,$$
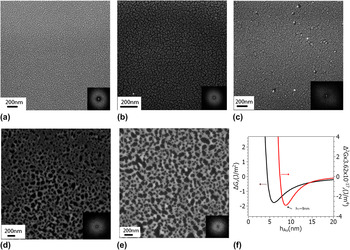
where A is the Hamaker coefficient of the vacuum/metal–metal/substrate interface, l is the correlation length, S p is the spreading coefficient, and h c is defined as  ${\textstyle{A \over {h_{\rm{c}}^{\rm{2}} }}}\,{\textstyle{{{\rm{3}}^{{\rm{4}}/{\rm{3}}} } \over {\rm{8}}}} = - {\rm{2\gamma sin}}^{\rm{2}} {\rm{(\theta /2)}}$, where γ is the surface energy of film-vacuum interface and θ is the equilibrium contact angle of the film on the substrate. From Eqs. 1 and 2, in principle, one could predict the transition thickness h T if all the material parameters are known. However, one of the largest uncertainties exists in the value of the correlation length l, which can vary between 0.1 and 1 nm and to which h T is very sensitive. Therefore, experimental measurements of h T can also aid in better estimating the value of the correlation length l. In the case of our Au measurements, we determined the location of the transition thickness by evaluating the early stage morphology as a function of h, as shown in Figs. 2(a)–2(e). From this measurement, it was clear that the transition from the bicontinuous morphology to a hole-like state occurred for film thickness between 8.5 and 10 nm. Next, we utilized Eqs. 1 and 2 with the experimentally determined A eff from Table I and found that the possible range of the correlation length was 0.2–0.3 nm in order for the h T to be in the interval from 8.5 to 10 nm. In Fig. 2(f), we have plotted the free energy ΔG(h) and its curvature ΔG(h)″ for A eff and a correlation length of 0.2 nm, which yields the transition thickness of 9 nm. The values of other constants used are as shown in Table I.Reference Krishna, Sachan, Strader, Favazza, Khenner and Kalyanaraman13
(a)–(e) SEM images of the early stage dewetting morphologies following irradiation by 10 laser pulses. The film thickness from (a) to (e) corresponds to 3, 4.5, 8.5, 10, 16 nm, respectively. Also shown in the inset of each figure is the FFT of the contrast correlations of the SEM images. The annular spectrum indicates that a well-defined length scale characterizes each pattern. (f) Plot of the free energy curvature versus film thickness using equations in Ref. Reference Krishna, Sachan, Strader, Favazza, Khenner and Kalyanaraman13. The transition thickness h T corresponds to the minimum in the curvature and occurs at h T ∼ 9 nm.

D. Estimation of thermocapillary effects
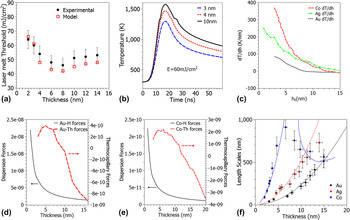
The deviation of length scales from the classical spinodal behavior due to a novel effect was observed in an earlier study of the pulsed laser dewetting of Co and Fe.Reference Trice, Favazza, Thomas, Garcia, Kalyanaraman and Sureshkumar2 The underlying reasons for that was novel nanoscale thickness-dependent heating effects that introduced thermocapillary forces in the dewetting process. A heat transport model that captured this transient thickness-dependent heating of ultrathin films under a laser pulse was further developed by us and is described in detail in Ref. Reference Shirato, Strader, Kumar, Vincent, Zhang, Karakoti, Nacchimuthu, Cho, Seal and Kalyanaraman36. One of the key ingredients of this transient thermal model is to account for the thickness-dependent optical reflectivity in the nanoscale thin films. The thermal model was applied to the Au films studied here to estimate the contribution of thermocapillary effects on the dewetting of Au. The quantitative accuracy of the model was verified by calculating the thickness dependence of the melt threshold laser energy, as shown in Fig. 3(a) (open symbols), which showed excellent agreement with the experimentally determined melt threshold [Fig. 3(a)–closed symbols]. An important effect that is evident here is that the energy required to melt the Au film does not change monotonically with increasing thickness. In fact, around a thickness 6–8 nm, the required energy passes through a minimum and eventually reaches a stable value for very thick films. This effect, due to the thickness-dependent reflectivity and transient nature of the heating pulse, is at the heart of the novel thermocapillary effect reported in Ref. Reference Trice, Favazza, Thomas, Garcia, Kalyanaraman and Sureshkumar2 as well as the unusual processing dependence of nanowire formation reported in Ref. Reference Shirato, Strader, Kumar, Vincent, Zhang, Karakoti, Nacchimuthu, Cho, Seal and Kalyanaraman36. Essentially, since the local film temperature is thickness dependent, one could expect to see a gradient in surface tension for a film with thickness undulations. In dewetting theory, it is recognized that surface undulations initiate the dewetting process, and therefore these undulations, in conjunction with the laser pulse, cause the surface tension gradients and ensuing thermocapillary effects that modify the classical dewetting behavior in metals such as Co and Fe.
Thermal behavior of the Au film on SiO2/Si irradiated by a pulsed laser (a) laser energy density threshold for melting Em of Au films on SiO2. Comparison of experimental measurements (closed symbols) with calculations (open symbols) using COMSOL multiphysics.Reference Shirato, Strader, Kumar, Vincent, Zhang, Karakoti, Nacchimuthu, Cho, Seal and Kalyanaraman36 (b) Time dependent temperature for different Au film thicknesses at a fixed value of the laser energy density. (c) Theoretical estimates for the thermal gradients along the film vacuum interface following pulsed laser melting of Au films using a laser energy density of 70 mJ/cm2. Data for Co and Ag films are also shown and were taken from Refs. Reference Trice, Thomas, Favazza, Sureshkumar and Kalyanaraman14 and Reference Krishna, Shirato, Favazza and Kalyanaraman44. (d) Thickness dependent magnitude of Au dispersion forces (Au–H) compared to thermocapillary forces (Au–Th) from the modeling results. (e) Thickness dependent magnitude of Co dispersion forces (Co–H) compared to thermocapillary forces (Co–Th) from the modeling results.Reference Trice, Thomas, Favazza, Sureshkumar and Kalyanaraman14 (f) Comparison of experimentally measured dewetting length scales of Au (this work), CoReference Favazza, Kalyanaraman and Sureshkumar16 and Ag.Reference Krishna, Sachan, Strader, Favazza, Khenner and Kalyanaraman13 The trend line equations are Au (λ = 2.43 × h 1.98), Ag (λ = 5.53 × h 1.97), and for Co in the spinodal regime and without thermal gradients is (λ = 25.7 × h 1.98) while the thermal gradient effect was estimated from the energy transfer model mentioned in Ref. Reference Krishna, Shirato, Favazza and Kalyanaraman44.

For the case of Au and at a fixed value of the laser energy density, the potential magnitudes of the thermal gradients due to undulations in film height were estimated. In Fig. 3(b) the modeled temperature versus time profiles are shown for two different thickness and a fixed value of laser energy density. From this, it is clear that at any given time, the two thicknesses result in different temperatures, and hence, the film height undulations will have different instantaneous temperatures. The magnitude of the thermal gradient (T h = dT/dh) as a function of varying film height at the instant of melting was estimated using the thermal model, and this is shown in Fig. 3(c) (dashed line). The order of magnitude of the effect in Au ranges between 0 and 100 K/nm and can be contrasted to the values shown for Ag and Co, which have larger magnitudes.
Based on these results, we can justify why we did not observe deviations from the classical λ ∝ h 2 spinodal behavior for Au, as evident from Fig. 1(g). Previous works have developed a theoretical framework to generalize the influence of thermocapillary forces on pulsed laser dewetting.Reference Shirato, Krishna and Kalyanaraman43,Reference Krishna, Shirato, Favazza and Kalyanaraman44 The magnitude of attractive dispersion forces and thermal gradient forcesReference Shirato, Krishna and Kalyanaraman43,Reference Krishna, Shirato, Favazza and Kalyanaraman44 can be incorporated into hydrodynamic models to obtain a final dewetting length scale described as:
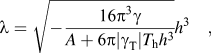 $${{\rm{\lambda }} = \sqrt { - {{{\rm{16\pi }}^{\rm{3}} {\rm{\gamma }}} \over {A + {\rm{6\pi |\gamma }}_{\rm{T}} |T_{\rm{h}} h^{\rm{3}} }}} h^{\rm{3}} }\quad,$$
where γ T is the temperature coefficient of the surface tension. From the above equation, one can see that if the magnitude of the dispersive forces estimated by the term  ${({\textstyle{A \over {{\rm{2\pi }}h}}})}$is much larger than the thermal gradient forces given by (
 ${\textstyle{3 \over 2}}$γThT h), one will continue to see the classical form of the spinodal dewetting. In Figs. 3(d) and 3(e), these two forces are calculated and compared for Gold and Cobalt, respectively. It is clear that for Gold, the attractive dispersion forces are significantly stronger than the thermal gradient forces, while in the case of Cobalt, the magnitude of attractive dispersion forces can be weaker than the thermal gradients. In Fig. 3(f) we have compared the experimentally determined length scales for Au, Ag, and Co and as evident, the Co behavior deviates from the classical h 2 behavior, while the ones for Au and Ag do not, implying a much weaker role of thermal gradient effects in these metals under ns pulsed laser dewetting. Another interesting observation that can be made with reference to Fig. 3(f) is that Au dewetting produces much smaller nanostructures than Ag or Co for a comparable film thickness. From the experimentally extracted values of the Hamaker coefficient, provided in Table I, this appears to be due to the extremely large value of the Au Hamaker coefficient in conjunction with its weak thermocapillary effects.
E. Modeling
Modeling the dynamics of the dewetting process that accurately captures the various physical effects, including the mass and thermal transport is highly important, since predictive computer-guided approaches are critical for the development of future nanomanufacturing scenarios. Here, a fully 3D and nonlinear modeling of Au film was performed, and the evolution of the morphology was tracked from the initial continuous film to the formation of nanoparticles. The full account of the transport models and numerical techniques has been published elsewhere.Reference Khenner, Yadavali and Kalyanaraman21,Reference Khenner, Yadavali and Kalyanaraman23 The models use the thin film (lubrication) approximation of the Navier-Stokes equations and incorporated the laser pulse-created, thickness-dependent temperature field in the energy equation and in the temperature-dependent surface tension. Simulations were done on a square domain of size 2λ (where λ is the length scale from the linear stability analysis of the temperature-sensitive thin film hydrodynamics describing spinodal dewetting) with periodic boundary conditions. A Hamaker coefficient value of A = 1.4 × 10⁻¹⁸J was used in the simulation.
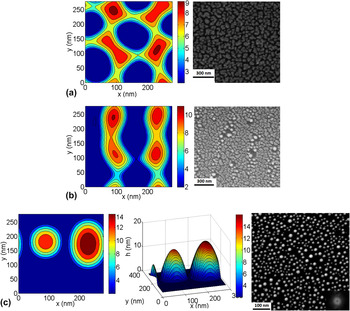
In Figs. 4(a), 4(b), and 4(c), the computed contour plots of the Au film height are shown at the different times for dewetting of 5 nm Au films. The contour plot and corresponding 3D plot are shown in Fig. 4(c). It is evident from the early stage behavior that dewetting first results in a network of cells and then two ridges of roughly equal height and width are formed by ripening. The cell network stage is consistent with the structure evidenced in the experiments, as shown by the SEM image in Fig. 4(a) for a Au film of 4.5 nm thickness following 10 pulses. Likewise, the later time stage, shown in Fig. 4(b), is consistent with the modeling structures of ridge-like or bicontinuous features. For later times, the evolution results in the breakup of the ridges leading to the formation of nanoparticles, as shown in Fig. 4(c), and this compares well to the SEM image of the experimental state after approximately 10,500 pulses.
Three-dimensional modeling of the dewetting dynamics of a 5 nm Au film. (a) Contour plot of the height of Au film at 560 ns compared to the SEM image of the film after 10 pulses. (b) Contour plot after 640 ns compared to the SEM image after 200 pulses. (c) Contour and 3D plot after 1200 ns compared to the SEM image of nanoparticles after 10,500 pulses. The simulations were done with Hamaker coefficient A = 1.4 × 10⁻¹⁸ J. Note the different scales in the modeling and experimental SEM figures.

IV. CONCLUSIONS
In conclusion, we have studied the thickness dependence of the dewetting pattern evolution in Au thin films studied in the range of ∼3–16 nm under ns pulsed laser melting. Investigations of the dewetting morphologies show that Au has bicontinuous structures for film thickness ≤8.5 nm and hole-like structures for film thickness ≥10 nm. Evaluation of the trend in characteristic length scales as measured by inter-particle spacing λ and diameter D shows the classical h 2 and h 5⁄3 dependence, respectively, confirming that Au follows the classical spinodal dewetting behavior. Evaluation of the thermal gradient forces under the transient laser heating confirmed that thermocapillary forces in Au are significantly weaker than its dispersive forces. Au was observed to have a very large Hamaker coefficient, and as a result, the Au dewetting length scales are significantly smaller than that of other metals such as Ag and Co. Nonlinear modeling studies show very good correlation with the experiment in capturing the 3D morphology of the dewetting Au films as well as in the evolution of this morphology. These studies lay the foundation of accurate computer-driven design of pulsed laser dewetting nanostructures for future implementation in nanomanufacturing scenarios.
ACKNOWLEDGMENTS
Some of the authors (SY and RK) acknowledge the support by the Sustainable Energy Education and Research Center, TNSCORE, and NSF through Grant No. CMMI-0855949. M.K. acknowledges the support of WKU Faculty Scholarship Council via Grant Nos. 10-7016 and 10-7054, and the Perm Ministry of Education (Russia) Grant No. C-26/628.