Introduction
Huntington’s disease (HD) is a debilitating progressive neurodegenerative disease that disrupts all aspects of life due to the broad range of symptoms affecting movement, and psychiatric and cognitive functions. Fronto-striatal damage is a key element of the gross pathological findings in HD (Baizer, Desimone, & Ungerleider, Reference Baizer, Desimone and Ungerleider1993; Yeterian & Pandya, Reference Yeterian and Pandya1995). Consistent with damage to fronto-striatal circuitry, HD is associated with impairments in attention, working memory, processing speed, psychomotor functions, episodic memory, emotion recognition, and executive functions (Duff, Beglinger, Theriault, Allison, & Paulsen, 2010a; Labuschagne et al., Reference Labuschagne, Jones, Callaghan, Whitehead, Dumas and Say2013; Stout et al., Reference Stout, Paulsen, Queller, Solomon, Whitlock, Campbell and Aylward2011). A growing body of research suggests that HD also affects visuospatial processing (Lawrence, Watkins, Sahakian, Hodges, & Robbins, Reference Lawrence, Watkins, Sahakian, Hodges and Robbins2000; Lineweaver, Salmon, Bondi, & Corey-Bloom, Reference Lineweaver, Salmon, Bondi and Corey-Bloom2005; Mohr et al., Reference Mohr, Brouwers, Claus, Mann, Fedio and Chase1991).
Posterior cortical areas, including the parietal and occipital cortices which subserve visuospatial functions, also show structural changes in HD, including volume loss, reduced cortical thickness, and associated white-matter abnormalities (Tabrizi et al., Reference Tabrizi, Langbehn, Leavitt, Roos, Durr and Craufurd2009). In addition, changes in brain metabolites (NNA and glutamate) in the posterior cingulate have also been reported in HD (Unschuld et al., Reference Unschuld, Edden, Carass, Liu, Shanahan, Wang and Ross2012). Although decline in visuospatial performance has not been directly associated with posterior cortical brain changes in HD, these deficits are hypothesized to be linked to occipital and parietal degeneration.
Deficits in visuospatial performance have been demonstrated across a variety of cognitive tasks in HD (Gomez-Tortosa, del Barrio, Barroso, & Garcia Ruiz, Reference Gomez-Tortosa, del Barrio, Barroso and Garcia Ruiz1996; Lawrence et al., Reference Lawrence, Watkins, Sahakian, Hodges and Robbins2000; Lineweaver et al., Reference Lineweaver, Salmon, Bondi and Corey-Bloom2005), but it is the ability to spatially manipulate information that is particularly poor in HD and tends to worsen with disease progression (Mohr et al., Reference Mohr, Brouwers, Claus, Mann, Fedio and Chase1991). This finding points to the possible role in the dorsal visual stream in HD pathology. The dorsal stream is one of two visual pathways in primates known to be important for spatial perception and localization (Baron-Cohen, Wheelwright, Hill, Raste, & Plumb, Reference Baron-Cohen, Wheelwright, Hill, Raste and Plumb2001). The dorsal stream involves projections from the visual cortex to the anterior parietal lobe where information is integrated about where objects are, and provides essential input that directs movement in relation to objects in space (Goodale & Milner, Reference Goodale and Milner1992; Kravitz, Saleem, Baker, & Mishkin, Reference Kravitz, Saleem, Baker and Mishkin2011; Mandal, Joshi, & Saharan, Reference Mandal, Joshi and Saharan2012).
Brain lesion, neuroimaging, and brain stimulation studies indicate that the parietal lobes play an important function in tasks involving mental rotation and visual search (Blankenburg et al., Reference Blankenburg, Ruff, Bestmann, Bjoertomt, Josephs, Deichmann and Driver2010; Donner, Kettermann, Diesch, Villringer, & Brandt, Reference Donner, Kettermann, Diesch, Villringer and Brandt2003; Harris et al., Reference Harris, Egan, Sonkkila, Tochon-Danguy, Paxinos and Watson2000). Consistent with the links between “where” information is and motor planning, functional magnetic resonance imaging (MRI) studies of mental rotation demonstrate activations of the primary motor and premotor cortices (Evans & Rothbart, Reference Evans and Rothbart2007; Rubin et al., Reference Rubin, Carter, Bishop, Pournajafi-Nazarloo, Harris, Hill and Sweeney2013), and the subcortical motor system involving the basal ganglia (Harris, Harris, & Caine, Reference Harris, Harris and Caine2002). These foregoing findings support a role for the dorsal visual pathway, motor cortex and basal ganglia in visuospatial functions, and are regions also implicated in the neuropathology of HD.
Given the evidence of visuospatial dysfunction, together with the identification of brain changes in regions known to be important for visuospatial processing in HD, deficits in complex visual processing have been suggested to be markers of disease progression in HD (Gomez-Tortosa et al., Reference Gomez-Tortosa, del Barrio, Barroso and Garcia Ruiz1996). Evidence is also accumulating that visuospatial deficits can be identified in premanifest HD many years before onset (Duff, Belanger, et al., Reference Duff, Paulsen, Mills, Beglinger, Moser and Smith2010; Duff, Paulsen, et al., Reference Duff, Paulsen, Mills, Beglinger, Moser and Smith2010; Robins Wahlin, Lundin, & Dear, Reference Robins Wahlin, Lundin and Dear2007), suggesting that visuospatial abilities may be one of the early cognitive functions to decline in HD. Nonetheless, to date, little is known about the association between posterior brain activity and visuospatial cognition in HD.
Recently, in an attempt to broaden our understanding of the potential posterior cortical involvement in the neuropathology of HD, we examined associations between cortical thickness across specifically the occipital lobe and several cognitive tasks using data from the larger TRACK-HD study (Johnson et al., Reference Johnson, Rees, Labuschagne, Durr, Leavitt, Roos and Scahill2015). These associations between occipital lobe and cognition were examined for six cognitive tasks including Stroop, Trial Making, Symbol Digit, Spot the Change, and the two visuospatial tasks Map Search and Mental Rotation. The findings showed regionally specific associations between reduced cortical thickness and performance deficits on five of six tasks, mostly strongly in the lateral occipital and lingual regions, and no evidence of cuneus involvement. Mental Rotation was the only task that showed no associations with occipital brain regions.
The focus of Johnson et al. was on the occipital lobe and a range of cognitive tasks for which only a single variable was analyzed. Thus, to obtain a clear picture of the nature of the visuospatial deficits in HD, a more detailed investigation, spanning across the posterior brain from occipital lobe to motor regions and across the spectrum of HD, is needed. Using data from the TRACK-HD longitudinal study, we examined the link between visuospatial processing and structural brain changes in premanifest and early stage diagnosed HD, using two visuospatial tasks: visual search and attention task requiring locating symbols on a map, and a mental rotation task of complex stimuli.
Based on previous evidence in healthy participants, we selected tasks that reliably recruit posterior brain regions known to be affected in HD, in particular the occipital lobes, inferior and superior parietal areas and the basal ganglia. We build on our previous work (Johnson et al., Reference Johnson, Rees, Labuschagne, Durr, Leavitt, Roos and Scahill2015) by examining visual search and mental rotation performance at two time points, 12 months apart, and studied associations between task performance and disease severity as well as MRI measures including regional gray- and white-matter volume and cortical thickness. We hypothesized that visuospatial deficits would: be detectable across the HD spectrum, deteriorate over 12 months, correlate with disease severity and functional capacity, and be associated with posterior and striatal brain volumes and cortical thickness.
Method
Participants
We recruited 104 participants with early HD, 119 HD gene-expanded (≥40 CAG repeats) premanifest HD participants, and 110 healthy controls from Paris, Leiden, Vancouver and London for the TRACK-HD study (Tabrizi et al., Reference Tabrizi, Langbehn, Leavitt, Roos, Durr and Craufurd2009). Selection criteria for premanifest HD involved Total Motor Scores ≤5, as assessed by the Unified Huntington’s Disease Rating Scale (UHDRS) (Huntington Study Group, 1999), and Disease Burden Score ≥250, calculated by age x [CAG-35.5] (Penney, Vonsattel, MacDonald, Gusella, & Myers, Reference Penney, Vonsattel, MacDonald, Gusella and Myers1997). The premanifest HD participants were divided, based on the baseline group medium (10.8 years) for predicted years to diagnosis, into those far from diagnosis (PreA) and those near diagnosis (PreB). The manifest HD group was divided, as defined by the UHDRS Total Functional Capacity score, into those with stage-1 HD (HD1; scores of 11–13) and stage-2 HD (HD2; scores of 7–10) (Shoulson & Fahn, Reference Shoulson and Fahn1979).
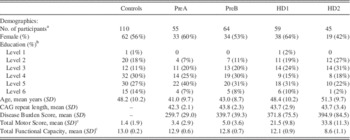
Controls, including primarily spouses or partners and gene negative siblings, were frequency-matched on age, sex and education (Table 1). Study entry criteria included ages 18–65 years, ability to tolerate and safely undergo MRI, not participating in a clinical drug trial, and free of other major neurological, psychiatric or medical illnesses, including significant head injury and drug or alcohol abuse. All participants were tested annually as part of the larger TRACK-HD study. It is important to note that the visuospatial assessments reported here were introduced at the 24-month time point, and were therefore assessed at 24 and 36 months of the TRACK-HD study. However, for simplicity, we have referred to baseline and 12-month follow-up in the current study. Written informed consent was obtained from participants according to the Declaration of Helsinki, and the study was approved by local ethics committees.
Participant demographics as measured at baseline

a All participants who attended either baseline or 1-year follow-up.
b Education level was reported according to the International Standard Classification of Education.
c Total motor and functional capacity scores were measured using the UHDRS (Huntington Study Group, 1999).
PreA=premanifest HD far from diagnosis; PreB=premanifest HD near diagnosis; HD1=HD stage-1; HD2=HD stage-2; SD=standard deviation; %=percentage.
Visuospatial Assessment
Map search
The Map Search task is a subtest from the Test of Everyday Attention (Robertson, Ward, Ridgeway, & Nimmo-Smith, Reference Robertson, Ward, Ridgeway and Nimmo-Smith1994), and measures visuospatial selective attention. For the task, participants were timed for 2 min while they searched for, and used a pen to circle, a target symbol that occurred in multiple places on a map among other distracter symbols. The map was visually cluttered, similar to any road map, and displayed a portion of the city of Philadelphia in the United States. Participants began performing the task using a pen of a given color, and then after 1 min, the examiner exchanged the pen for a different color to differentiate responses made in the first and second minutes of testing. We measured the number of correctly circled targets, scored separately at 1 and 2 min. The maximum score was 80. Previous evidence using this task in early HD (n=10) versus controls demonstrated a large effect size of −2.92 (Murray & Stout, Reference Murray and Stout1999). We highlight here that we have previously reported on the number correct for 2 min using different statistical methods in Johnson et al. (Reference Johnson, Rees, Labuschagne, Durr, Leavitt, Roos and Scahill2015).
Mental rotation
The computerized Mental Rotation task assesses the ability to mentally rotate 3-dimensional stimuli consisting of images of cubes, attached to each other by sharing a common side or sides (Peters & Battista, Reference Peters and Battista2008; Shepard & Metzler, Reference Shepard and Metzler1971). On each trial, a pair of stimuli was presented. One figure in the pair was either a rotation of the other figure, or a rotation of the mirror image of the other figure. Participants had to indicate whether the rotated figure was identical to (“same”) or a mirror image of (“mirror”) the comparison figure. The stimuli were presented using six degrees of rotation across four difficulty levels: (i) 5 degrees, (ii) 65 and 305 degrees, (iii) 125 and 245 degrees, and (iv) 185 degrees. We collapsed the data across degrees that were similar in difficulty, that is, those degrees that were horizontally opposites and thus required the same amount of rotation from 0 (e.g., 65 and 305 degrees) (Bethel-Fox & Shepard, Reference Bethel-Fox and Shepard1988; Lineweaver et al., Reference Lineweaver, Salmon, Bondi and Corey-Bloom2005; Shepard & Metzler, Reference Shepard and Metzler1971). Thus, for simplicity, we subsequently refer to the four angles as 5, 65 (e.g., 65 and 305, both equal distance from 0), 125 (e.g., 125 and 245, both equal distance from 0), and 185 degrees.
There were 10 practice trials, followed by 48 experimental trials comprised of 12 trials each at the four difficulty levels, balanced for SAME and MIRROR conditions. We measured accuracy (percent correct), response time (for correctly identified targets only) and speed-accuracy trade-off (correlation between accuracy and response times). Previous research showed an effect size of −0.68 in premanifest HD (n=11) versus controls (Robins Wahlin et al., Reference Robins Wahlin, Lundin and Dear2007). We highlight here that we previously reported on a total score involving number correct collapsed across all degrees of rotation in a different set of analyses (Johnson et al., Reference Johnson, Rees, Labuschagne, Durr, Leavitt, Roos and Scahill2015).
MRI Acquisition
Participants underwent 3 Tesla MRI scanning, with data acquisition procedures that were standardized according to the TRACK-HD study protocol (Tabrizi et al., Reference Tabrizi, Langbehn, Leavitt, Roos, Durr and Craufurd2009). Gray- and white-matter were assessed using voxel-based morphometry (VBM) and cortical thickness using Freesurfer version 5.3; for more details see (Tabrizi et al., Reference Tabrizi, Langbehn, Leavitt, Roos, Durr and Craufurd2009).
Statistical Analyses
For Map Search, we separately analyzed the number of correct objects in 1 and 2 min. To jointly model the proportions at baseline and follow-up, we used a generalized estimating equations (GEE) approach with a logit link, a “working” assumption of independence between the baseline and follow-up, and robust Huber-White standard errors (Huber, Reference Huber1967) that allow both for the fact that the baseline and follow-up measures are not independent, and that the number of objects identified at each visit does not truly follow a binomial distribution. For Mental Rotation, we separately analyzed accuracy and response times as continuous variables, using a mixed-effects regression model with random subject-specific intercepts to simultaneously model the multiple outcomes.
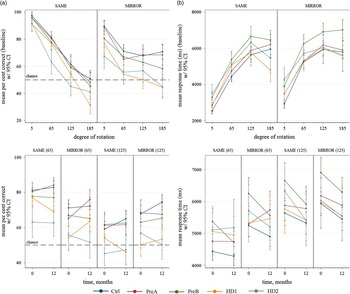
We again used robust Huber-White standard errors, which are robust to the residual heteroscedasticity that may be expected between disease groups. All analyses included an effect of time (allowing for the fact that visits were not always exactly one year apart) and adjusted for age, sex, educational level, and study site. Effects were permitted to vary with time and, with Mental Rotation outcomes, by degree (5/65/125/185 degrees) and condition (SAME/MIRROR). We report between-group comparisons on only the 65 and 125 degree angles because inspection of the data indicated ceiling effects for accuracy at 5 degrees (all participants performed near the 90–100% accuracy level), and floor effects for accuracy at 185 degrees (the HD groups performed way below chance level); Figure 1.
Mean Mental Rotation accuracy (a) and response time (b) at baseline (top, all degrees of rotation) and annualized change (bottom, 65 and 125 degrees). Means are standardized to the marginal distribution of age, sex, education, and site in the groups combined. Ctrl=controls; PreA=premanifest HD far from diagnosis; PreB=premanifes HD near diagnosis; HD1=HD stage-1; HD2=HD stage-2.

For cross-sectional comparisons between-groups at baseline, we calculated standardized marginal contrasts between controls and each of the gene-positive groups (PreA, PreB, HD1, and HD2) for each outcome from the models described above. These contrasts compared the expected mean outcomes between groups, after standardizing the groups to have the same distribution of adjustment covariates, thus removing the effect of these potential confounders from the contrast (Muller & MacLehose, Reference Muller and MacLehose2014). The expected outcomes were predicted by multiplying probabilities predicted from the GEE (for Map Search) by the number of possible events (here number of targets to be found=80) or from the mixed model (for Mental Rotation).
For longitudinal analyses, we compared annualized change in performance from baseline to 12 months between groups. These standardized contrasts calculated the expected change in the outcome by taking the first derivative of the regression equation with respect to time (in units of 1 year), calculating in each group the predicted change in the probability (GEE) multiplied by 80 (Map Search) or the outcome (mixed effect model, Mental Rotation), and contrasting the changes. Standard errors of both sets of contrasts were calculated using the delta method (Oehlert, Reference Oehlert1992). For Mental Rotation, we also examined the speed-accuracy trade-off relationship by adding accuracy as a second exposure of interest to the response time regression model. The effect of accuracy in each group was allowed to differ by time, degree of rotation (65 and 125 degrees) and SAME/MIRROR condition.
Standardized contrasts using methods described above were used to estimate the effect of accuracy on time taken to correctly identify objects between subgroups at baseline. In the gene-positive groups, we then used partial Pearson correlation coefficients adjusted for age, sex, site, education, and CAG length to determine how performance accuracy on the visuospatial tasks related to disease severity, measured by the Disease Burden Score (Penney et al., Reference Penney, Vonsattel, MacDonald, Gusella and Myers1997), and Total Functional Capacity, and Total Motor Scores taken from the UHDRS. For Disease Burden, we report partial correlations separately for each of the four groups. For Total Motor Score, only the two diagnosed groups are included because in the premanifest group, motor scores are very low and have little variance. Total Functional Capacity is reported for the diagnosed group as a whole because it also has low variance and it serves as the defining difference between disease stages in the two diagnosed groups. Stata v13 (StataCorp, College Station, TX) was used for all statistical analyses involving task performance and disease severity. Because each cognitive task has its own independent interest, no adjustments were made to p-values to allow for multiple comparisons (Rothman, Reference Rothman1990).
Finally, we investigated associations between regional brain volume (VBM), and the selected measures (i.e., accuracy) from the Map Search and Mental Rotation (65 and 125 degree) tasks using the combined gene-positive group (PreA, PreB, HD1, HD2), adjusting for age, gender, site, education, intracranial volume, CAG, and Disease Burden. Results are corrected for multiple comparisons using a 5% false discovery rate (Deboer et al., Reference Deboer, Medina, Davis, Presnell, Powers and Smits2013). Likewise, using the combined gene-positive group, associations between cortical thickness and accuracy measures from both tasks were examined using a general linear model and the FreeSurfer “Different Onset, Same Slope” model (Fischl & Dale, Reference Fischl and Dale2000; Fischl et al., Reference Fischl, Salat, Busa, Albert, Dieterich, Haselgrove and Dale2002, Reference Fischl, van der Kouwe, Destrieux, Halgren, Segonne, Salat and Dale2004). The model constrained the slopes of any continuous variables to evolve at the same rate in all groups. A DOSS model was deemed appropriate after first investigating that there were no age-related differences on cortical thickness within the groups, the genders or the scanners. A Monte Carlo correction for multiple comparisons was applied (Hagler, Saygin, & Sereno, Reference Hagler, Saygin and Sereno2006), with a vertex-wise threshold (cluster forming threshold) of p<.05 (two-tailed) and a cluster-wise threshold of pcw<0.025 (i.e., pcw<0.05 corrected across two hemispheres). Results were adjusted for age, gender, site, education, CAG and Disease Burden.
Results
Cross-sectional and Longitudinal Visuospatial Performance
Map search accuracy
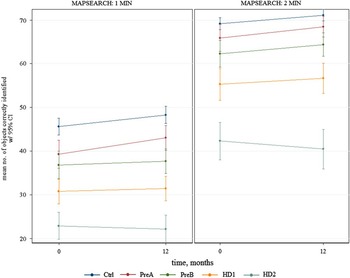
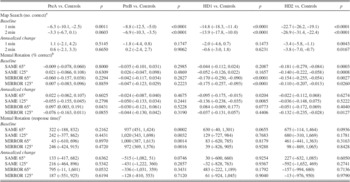
Cross-sectionally at baseline and 12 months, groups of increasing severity of disease showed worse performances (i.e., fewer correct targets found) at both 1 and 2 min (Fig. 2). Between-group comparisons at 1-min showed strong evidence (all p<.002) of impaired performance in all disease groups compared to controls, with the differences from controls ranging from 6.3 correct targets (95% CI 2.5,10.1) for PreA to 22.7 correct targets (19.1,26.2) for HD2; Table 2. The 2-min scores also showed strong evidence of impaired performance in PreB, HD1, and HD2 (p<.0001) and a trend for statistical significance in PreA (p=.06). Longitudinally, there were significant 12-month declines in Map Search performance at both 1 and 2 min for the HD2 group relative to controls [−3.4 (−5.8,−1.1) p=.0043, and −3.8 (−7.0,−0.7) p=.0167]. No other between-group comparisons showed significant differences in annualized change.
Mean Map Search 1- and 2-min scores at baseline and at annualized follow-up, standardized to the marginal distribution of age, sex, education, and site in the groups combined. Ctrl=controls; PreA=premanifest HD far from diagnosis; PreB=premanifes HD near diagnosis; HD1=HD stage-1; HD2=HD stage-2.

Between-group contrasts for cross-sectional (baseline) differences and annualized change differences on the Map Search and Mental Rotation tasks
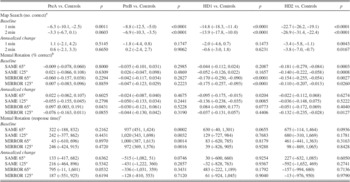
Note. Contrasts are means (95% confidence interval) and are standardized to the marginal distribution of age, sex, education, and site in the groups combined.
a Map Search is presented as the number of objects correctly identified.
b Mental Rotation percent correct.
c Mental Rotation response time in milliseconds.
PreA=premanifest HD far from diagnosis; PreB=premanifest HD near diagnosis; HD1=HD stage-1; HD2=HD stage-2. p=significance p-value
Mental rotation accuracy
Cross-sectionally at baseline and 12 months, and for both the SAME and MIRROR conditions, accuracy was typically lower with larger degrees of rotation in all disease groups and controls (Fig. 1(a)). Furthermore, the more severe the disease stage the poorer performance tended to be across all conditions (Fig. 1(a)). There was strong evidence of impairment in the HD1 group on both 65 and 125 degrees for MIRROR trials [−17.0% (−25.0,−9.0) and −17.5% (−25.7,−9.3); both p<.0001], and in the HD2 group on both degrees for both SAME and MIRROR trials [ranging from −18.1% (−27.9,−8.4) to −11.0% (−20.7,−1.3); all p<.03]. However, the premanifest HD groups’ accuracy appeared similar to that of controls at both degrees. Longitudinally, there was no compelling evidence to suggest that the HD groups changed or declined more rapidly than controls. Four of the 16 comparisons made with controls reached formal statistical significance, but one of these was in the direction of reduced changes, and taken as a whole, no clear coherent pattern emerged from these results; Table 2.
Mental rotation response time
Cross-sectionally at baseline and 12 months follow-up, in the control and PreA groups the mean response time for correct answers generally increased at each increment in the degree of difficulty under the SAME condition, but stabilized or decreased at the larger degrees in the PreB, HD1, and HD2 groups (Fig. 1(b)). A similar pattern was present under the MIRROR condition except that all groups’ mean response times stabilized or decreased at the larger degrees. There were no significant differences in response time at either condition or either 65 and 125 degree between controls and the PreA, HD1, and HD2 groups, but the PreB group was significantly slower than controls at both degrees for both conditions, where differences ranged from 1020 ms (343,1698) to 937 ms (451,1424), all p<.004; Table 2. Longitudinally, there was no strong evidence of changes in performance over 12 months in the disease groups compared to controls. Two of the 16 comparisons made approached formal statistical significance (p=.053 and p=.075) but there was no coherent pattern to these results.
Mental rotation speed-accuracy
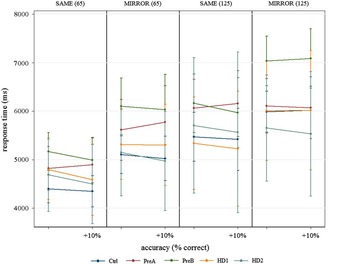
For all groups except PreA, response time for accurate answers tended to be faster in participants with better overall performance. In contrast, PreA participants who performed better tended to be slower when making correct responses (Fig. 3). Of the sixteen comparisons made, one comparison, which was between PreA and controls at 65/MIRROR, was statistically significant (p=.048), where for each 10% absolute increase in accuracy, the difference in the corresponding change in response time between PreAs and controls was 239 ms (95% CI: 3, 476); Supplementary Table 1. No other comparisons approached statistical significance, so interpretation of this result must be made with caution.
Mean Mental Rotation response time at baseline as a function of accuracy at 65 and 125 degrees under both SAME and MIRROR conditions. Means are standardized to the marginal distribution of age, sex, education, and site in the groups combined. Ctrl=controls; PreA=premanifest HD far from diagnosis; PreB=premanifes HD near diagnosis; HD1=HD stage-1; HD2=HD stage-2.

Associations between Cross-sectional Visuospatial Accuracy and Disease Severity
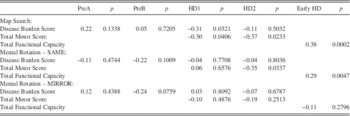
In HD1, performance on the Map Search 1-min variable was negatively correlated with Disease Burden (partial r=−0.31; p=.032) and Total Motor Score (partial r=−0.30; p=.041). In HD2, performance on Map Search 1-min, and accuracy on the Mental Rotation under the SAME condition, were both negatively correlated with Total Motor Score (partial r=−0.37; p=.023 and partial r=−0.35; p=.034, respectively). In the combined diagnosed HD group, Total Functional Capacity was associated with both Map Search 1-min performance (partial r=0.38; p<.001) and Mental Rotation (SAME) accuracy (partial r=0.29; p=.005); Table 3. Disease Burden in the premanifest groups was not associated with visuospatial task performance.
Partial correlations between disease severity measures and outcomes at baseline

Note. Correlations are adjusted for age, CAG length, sex, education, and site. For Map Search, we used the 1-min outcome, and for Mental Rotation we used average accuracy at 65 and 125 degrees in both SAME and MIRROR conditions. Since Total Functional Capacity score is the defining difference between disease stages, outcome correlations with this measure are reported across both stages combined. PreA=premanifest HD far from diagnosis; PreB=premanifes HD near diagnosis; HD1=HD stage-1; HD2=HD stage-2; p=significance p-value. Disease Burden Scores are calculated as age x [CAG-35.5] (Penney, et al., 1995). Total Motor Score and Total Functioning Capacity are calculated from the UHDRS (Huntington Study Group, 1999).
Associations between Cross-sectional Visuospatial Accuracy and Structural Brain Abnormalities
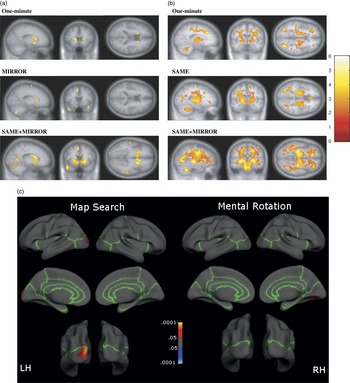
Baseline brain volumes, assessed using VBM, were significantly correlated with both Map Search and Mental Rotation tasks, that is, reduced volume with poorer performance (Fig. 4). Specifically, poorer performance (lower scores) on Map Search 1-min scores correlated with gray-matter volume loss, predominantly in striatal regions of the basal ganglia (caudate, putamen) and to a lesser extend with parieto-occipital regions (precuneus/cuneus, left lingual gyrus), motor areas (precentral gyri), fusiform and insula. Poorer Map Search 1-min scores were also associated with widespread white-matter volume loss, in the cortiocostriatal tract, cingulum, and cerebellum.
Structural brain correlations to visuospatial performance at baseline. Correlations included all the gene-positive groups combined. For Map Search, we used the 1-min scores, and for Mental Rotation we used accuracy for 65 and 125 degrees combined. Voxel based morphometry results for gray-matter (a) and white-matter (b) are corrected for multiple comparisons using the false discovery rate at p<.05, and cortical thickness results (c) are corrected using a Monte Carlo cluster-wise correction at p<.05. Voxel based morphometry associations were adjusted for age, gender, site, education, intracranial volume, CAG and disease burden, and cortical thickness associations were adjusted for age, gender, site, education, CAG, and disease burden. LH=left; RH=right.

For Mental Rotation, at 65 degrees and SAME/MIRROR conditions, poorer accuracy was associated with gray-matter volume loss in the striatal regions (caudate, putamen), and also across several cortical regions including parieto-occipital cortex (precuneus, calcarine, lingual regions), motor regions (supplementary motor area, precentral gyrus, cerebellum), temporal lobe (fusiform, middle temporal gyri, temporal pole, hippocampus, parahippocampal region), superior frontal lobe, and cingulate. When SAME and MIRROR conditions were separated, only the MIRROR condition showed significant gray-matter correlations (caudate, supplementary motor area, precentral gyrus, cingulate, temporal pole, cerebellum).
Thus, the MIRROR condition appeared to account for most of the gray-matter associations observed in the combined SAME/MIRROR conditions. Poorer accuracy on the combined SAME/MIRROR conditions correlated with white-matter volume loss throughout the brain, but particularly in the striatal region, corpus callosum, brain stem and cerebellum. When the SAME and MIRROR conditions were examined separately, only the SAME condition showed significant white-matter correlations and mainly in the occipital lobe, corticostriatal tract, cingulum, brain stem and cerebellum. Thus, the SAME condition likely accounted for most of the white-matter associations observed in the combined SAME/MIRROR conditions. Adding to these VBM results, poorer 1-min Map Search scores were associated with significantly less cortical thickness in the superior parietal lobe region extending into the lateral occipital region, p=.007 (Fig. 4). For Mental Rotation at 65 degrees and combined SAME/MIRROR conditions, poorer performance was associated with less thickness in the fusiform/lingual region, p=.01 (Fig. 4).
Discussion
This study aimed to elucidate the visuospatial abnormalities across the spectrum of HD using a large sample of subjects. We have several key findings. First, cross-sectionally, we found large effects for comparisons between controls and all premanifest and early HD groups on Map Search, thus demonstrating the sensitivity of the Map Search task for both premanifest and diagnosed HD. In contrast, Mental Rotation performance differed from controls only for the early HD groups, suggesting that compared to Map Search, Mental Rotation, at least in the version we used, was not as sensitive for HD. Second, for Mental Rotation, correct response times were slower in the premanifest near to onset group compared to controls, but not in the premanifest far from onset or diagnosed groups, suggesting the presence of compensatory strategies. Third, for Map Search only, performance deterioration was significant over 12 months in the early HD2 group (more advanced but still relatively early diagnosed HD) but not in premanifest or HD1 groups, suggesting a detectable decline over one year in Map Search at the more severe disease stages. Fourth, in diagnosed individuals, Map Search, but not Mental Rotation, was significantly associated with Disease Burden, motor symptoms and functional capacity in most comparisons to controls. We found no associations between Disease Burden and Map Search or Mental Rotation in the premanifest groups.
Finally, we demonstrated correlations between visuospatial performance (Map Search and Mental Rotation) and both brain volume and cortical thickness evident in parieto-occipital (pre-/cuneus, calcarine, lingual) regions, as well as motor and fusiform gyrus regions, suggesting a link between structure and function, thereby substantiating the link between visuospatial performance and posterior brain dysfunction in HD.
Possible Compensation during Mental Rotation
Interestingly, cross-sectional analyses of Mental Rotation response times, showed that those premanifest HD near to onset (PreB) slowed their response times (i.e., took longer to respond) compared to controls. Coupled with the fact that there were no performance differences in the PreB group, whereas the diagnosed groups were less accurate than controls, this may indicate that PreB maintained their performance on visual cognitive function by compensating with slower responses, whereas early HD maintained their response times but showed significantly poorer performance accuracy. In our speed-accuracy trade-off results, there was no strong evidence for a difference in the trade-off relationship between any of our gene-positive groups and controls, although there was a weakly significant difference in those premanifest HD far from onset (PreA). PreA participants who performed more accurately overall, took more time to do so; corresponding control participants took slightly less time, giving a total difference of 239 milliseconds per 10% improvement in accuracy.
Previous evidence reported speed-accuracy trade-offs during mental rotation in diagnosed HD (Lineweaver et al., Reference Lineweaver, Salmon, Bondi and Corey-Bloom2005), although the sample size was small and no premanifest HD participants were included. The lack of generality of the speed-accuracy trade-off in Mental Rotation across the HD groups may indirectly suggest that visuospatial compensation processes are evident in the early disease stages, demonstrated by maintained accuracy in the face of slower response times (in PreB), but that these compensation processes are diminished by the time the disease progresses through to the clinical stages. This finding is in line with recent suggestions of compensatory mechanisms in posterior (parietal) brain regions, which are regions implicated in visuospatial processes, in those premanifest HD closest to motor disease onset (Klöppel et al., Reference Klöppel, Gregory, Scheller, Minkova, Razi and Durr2015).
Visual Search Performance Dysfunction Occurs Early and Deteriorates over 12 Months
Performance on the Map Search in all gene-positive groups was worse than controls, including the far from onset PreA group, whereas performance accuracy on the Mental Rotation was worse only in the diagnosed groups. Our findings are in line with previous evidence of visuospatial deficits in HD (Gomez-Tortosa et al., Reference Gomez-Tortosa, del Barrio, Barroso and Garcia Ruiz1996; Lawrence et al., Reference Lawrence, Watkins, Sahakian, Hodges and Robbins2000; Lineweaver et al., Reference Lineweaver, Salmon, Bondi and Corey-Bloom2005; Mohr et al., Reference Mohr, Brouwers, Claus, Mann, Fedio and Chase1991) including in premanifest stages (Duff, Beglinger, et al., Reference Duff, Beglinger, Theriault, Allison and Paulsen2010; Duff, Paulsen, et al., Reference Duff, Paulsen, Mills, Beglinger, Moser and Smith2010; Robins Wahlin et al., Reference Robins Wahlin, Lundin and Dear2007). Our finding that Map Search showed deficits even in the premanifest stages of HD, suggests that a visual attentional task may be a more sensitive visuospatial marker of disease progression than a more complex visuospatial task involving the ability to spatially manipulate information, such as mental rotation. Map Search taps into the everyday behavior of visually searching for items on a map or other cluttered visual field, and thus may have some ecologically relevant implications.
Furthermore, Map Search deteriorated over 12 months in the HD2 group (vs. controls), whereas there was no strong evidence of longitudinal changes on Mental Rotation. It is possible that Map Search, because of its attentional component, taps more into disease-related circuits than Mental Rotation that may contribute to its sensitivity in premanifest HD. However, this remains to be examined in more detailed using larger visual processing protocols. Nonetheless, this is the first study reporting longitudinal change, although only over 12 months, in visuospatial abilities in HD. Although a relatively short interval, this provides initial evidence of significant and rapid declines in visuospatial/visuo-atttentional processes.
Visuospatial Performance Correlates with Disease Severity
Our findings showed that greater disease severity (disease burden and motor signs) is associated with worse performance on Map Search and Mental Rotation tasks in diagnosed individuals, and that better functional capacity is associated with better performance. This supports our predictions of posterior brain region involvement, as measured by visuospatial performance, in the neuropathology of HD. No previous study has directly linked visuospatial performance to disease severity or functional capacity in HD. For Alzheimer’s disease, not only have such links been found, but furthermore, visuospatial functions were most strongly associated with functional ability compared to any other cognitive domain that was examined (Perry & Hodges, Reference Perry and Hodges2000). These authors also found that visuospatial function was the sole cognitive predictor of functional abilities. These findings suggest the possibility of a link between visuospatial deficits and disease severity as well as functional outcomes in HD. The finding of functional significance may also have implications for clinical trials investigating drug treatments for HD. However, we are cautiously interpreting these findings as it could merely reflect that visuospatial performance track with the progression of the disease.
Visuospatial Performance Correlates with Posterior Cortical and Striatal Areas
We found a strong link between visuospatial performance and brain volume in HD, predominantly in occipito-parietal (pre-/cuneus, calcarine, lingual), motor (supplementary motor area, precentral gyrus, cerebellum), and temporal (fusiform) regions. Similarly, our cortical thickness correlations showed that Map Search was associated with thickness of the superior parietal cortex, extending into lateral occipital lobe, and Mental Rotation was associated with thickness of the occipital lobe, extending into the posterior fusiform gyrus. These findings are consistent with prior suggestions of cortico-striatal circuitry with connections that span not only the frontal cortex but also temporal and posterior cortical regions including visual and parietal cortices (Baizer et al., Reference Baizer, Desimone and Ungerleider1993; Yeterian & Pandya, Reference Yeterian and Pandya1995). Our findings extend our previous work (Johnson et al., Reference Johnson, Rees, Labuschagne, Durr, Leavitt, Roos and Scahill2015), by showing associations between visuospatial performance involving Map Search and Mental Rotation performances and posterior parts of brain that extend beyond that of the occipital lobe. The findings therefore support our predictions of additional posterior cortical involvement in the neuropathology of HD.
To date, there is very limited evidence linking specific brain measures with visuospatial performance in HD. However, our findings of associations between occipito-parietal and striatal volumetrics and visuospatial processing in HD, are consistent with evidence of dorsal visual stream involvement in visuospatial processing in healthy participants (Donner et al., Reference Donner, Kettermann, Diesch, Villringer and Brandt2003; Harris et al., Reference Harris, Egan, Sonkkila, Tochon-Danguy, Paxinos and Watson2000, Reference Harris, Harris and Caine2002). Dorsal visual stream deficits relating to mental rotation have been implicated in Alzheimer’s disease (Jacobs et al., Reference Jacobs, Van Boxtel, Heinecke, Gronenschild, Backes, Ramakers and Verhey2012; Mandal et al., Reference Mandal, Joshi and Saharan2012; Prvulovic et al., Reference Prvulovic, Hubl, Sack, Melillo, Maurer, Frolich and Dierks2002). Our findings may therefore suggest that the dorsal visual pathway could be more susceptible to early stages of neurodegeneration, conforming to the previous reports of a longitudinal progression pattern of dorsal-to-ventral cell death in HD (Vonsattel & DiFiglia, 1998). More specifically, the Map Search findings may suggest that visual attentional processes, relating to the posterior parietal cortex, may specifically be implicated in the visuospatial deficits reported here. However, a more direct and systematic comparison of dorsal versus ventral visual stream involvement, in addition to the possibility of dysfunctional attentional processes, is needed.
We also found gray-matter associations in other cortical regions for Map Search (fusiform and insula) and more broadly for Mental Rotation (superior frontal lobes, fusiform, middle temporal gyrus, temporal pole, hippocampus, parahippocampus, and cingulate). The broader range of regions associated with Mental Rotation, compared to Map Search, is perhaps due to the complex nature of the mental rotation stimuli, which represent 3-dimensional forms, compared to the 2-dimensional forms represented on the map used for Map Search. In support, evidence suggests that the basal ganglia sends direct projections to the prefrontal, motor and temporal cortices, and these neural projections are involved in the recognition and registration of complex contextual patterns that are relevant to behavior (Beiser, Hua, & Houk, Reference Beiser, Hua and Houk1997; Lawrence et al., Reference Lawrence, Watkins, Sahakian, Hodges and Robbins2000).
The broader range of cortical regions implicated in Mental Rotation, such as the frontal and temporal cortices, likely reflects these output projections from the basal ganglia in response to the processing of complex 3-dimensional stimuli. Both visuospatial tasks showed associations with the fusiform gyrus. The involvement of the fusiform gyrus in color integration, visuospatial processing and mental imagery (Bogousslavsky, Miklossy, Deruaz, Assal, & Regli, Reference Bogousslavsky, Miklossy, Deruaz, Assal and Regli1987) supports its role in both Map Search and Mental Rotation. The finding of temporal lobe involvement in visuospatial deficits in HD does not support the view that the dorsal visual pathway, which does not include the temporal lobes, is specifically implicated in the neuropathology of HD. However, evidence in Alzheimer’s disease suggests that both the dorsal and ventral pathways are affected in Alzheimer’s disease as a result of both compensatory responses and functional reorganization. In our study, we were unable to tease apart the involvement of the two visual pathways.
Limitations and Future Studies
There are key points to consider when interpreting these findings. First, our findings may suggest that tasks involving visual search, or of selective attentional processes, are more sensitive at detecting differences between premanifest HD and controls, than mental rotation. However, it is possible that our measure of mental rotation lacks sufficient sensitivity, or may not engage disease-specific circuits, to detect group differences in the premanifest period. Thus, it is impossible to attribute with certainty the lack of findings in the premanifest group to the absence of deficits per se rather than the lack of a sensitive measure. Furthermore, the declines in visual search, that were consistent across all !HD groups, may have reflected slowness in processing speed rather than visuospatial deficits. It is, therefore, possible that a combination of poor visual search ability as well as speed or movement slowness could have contributed to the visual search findings. However, the effects of motor dysfunction on cognitive outcomes are likely to be small (Stout et al., Reference Stout, Paulsen, Queller, Solomon, Whitlock, Campbell and Aylward2011) but remains to be examined specifically for visuospatial tasks.
Second, we did not adjust our p-values in our many comparisons and may have false discoveries in our findings. We were therefore cautious in reporting and interpreting our findings relating to speed-accuracy and longitudinal declines in mental rotation. Third, response time on mental rotation was for correct answers only. We, therefore, could have failed to detect a true cross-sectional deficits or longitudinal change because some participants may have been over-represented, that is, those who are naturally better at the tasks or have less disease burden. In addition, the two time points also limits our longitudinal outcomes and more time points should be considered in future studies.
Fourth, we only examined brain volume changes cross-sectionally, making it impossible to make conclusions linking rates of brain deterioration to visuospatial performance. Finally, correlations between posterior brain volume loss and poorer functional capacity cannot be interpreted as causal evidence that smaller posterior brain volume cause poorer function. Instead, our correlational findings may reflect a common association between overall HD neuropathology rather than a direct functional association. However, the inclusion of Disease Burden scores in the regression model reduced this overall disease effect and may suggest a more specific association.
Future research should replicate these findings to more clearly delineate posterior brain functions involving visuospatial tasks in HD. In particular, the current findings should be extended to other possible endpoints of posterior brain dysfunction in HD, such as other cognitive and occulomotor outcomes. In addition, a more comprehensive assessment of visuospatial function is needed, along with longer longitudinal intervals, to fully delineate the multifaceted visuospatial functions in HD.
Acknowledgments
The authors offer their gratitude to the Track-HD research volunteers, and to their carers and companions who helped make their participation possible. TRACK-HD is supported by the CHDI/High Q Foundation Inc, a not-for-profit organization dedicated to finding treatments for Huntington’s disease. There are no conflicts of interest to report for all authors. TRACK-HD Investigators: Canada: A. Coleman, R. Dar Santos (University of British Columbia, Vancouver). France: C. Jauffret, D. Justo (APHP, Hôpital Salpêtriere, Paris). Netherlands: E. M. Dumas, E. P. ‘t Hart, V. Roedig (Leiden University Medical Centre, Leiden). UK: M. Say, D. Whitehead (University College London, London). USA: H. Johnson, E. Axelson (University of Iowa, Iowa City, IA).
Supplementary material
To view supplementary material for this article, please visit http://dx.doi.org/10.1017/S1355617716000321