I. INTRODUCTION
Semiconductor photocatalysts have been researched extensively because of their applications for environmental purification and energy conversion.Reference Chen, Ma and Zhao1 Among semiconductor photocatalysts, TiO2 is most widely used due to its nontoxicity, stability, and efficient photocatalytic activity.Reference Tong, Ouyang, Bi, Umezawa, Oshikiri and Ye2 However, nanostructured TiO2 suffers from low efficiency under visible light illumination since it has a large band gap energy of 3.2 eV.Reference Chong, Jin, Chow and Saint3 Therefore, a lot of research works have been carried out to improve TiO2 as a visible light active photocatalyst, including dye-sensitizing, metal-doping, nonmetal-doping, and coupling of two semiconductors.Reference Chen and Mao4–Reference Bhattacharyya, Varma, Tripathi and Tyagi7 Although the light absorption was extended to a visible light region, these processes often suffered from a multistep synthesis process or involved an increase in the carrier–recombination centers.Reference Moon, Takagi, Fujishiro and Awano8–Reference Umebayashi, Yamaki, Yamamoto, Miyashita, Tanaka, Sumita and Asai10 These methods are not appropriate for developing highly efficient visible light active photocatalysts. At present, exploiting non-TiO2-based photocatalysts with high visible light photocatalytic activity is important and desirable.
Recently, non-TiO2 visible light active photocatalysts based on vanadate have received increased attention owing to their efficient photocatalytic activity under visible light irradiation.Reference Tan, Zhang, Ren, Wei, Huang and Xia11 Visible light active silver vanadate photocatalysts were successfully synthesized using a simple hydrothermal process, and the samples had higher photocatalytic activities than those of P25 (Ref. Reference Huang, Pan, Li, Li and Yang12); Large-scale, high-purity, and uniform BiVO4 nanoribbons have been synthesized by a facile hydrothermal route, and the nanoribbons showed superior photocatalytic activities in the degradation of eosin Y under visible light irradiationReference Wang, Shao, Cheng, Hua and Wei13; A series of vanadate grafted TiO2 heterostructure photocatalyst were synthesized to enhance the visible light activity of TiO2, in which the grafted vanadate with narrow band gap can absorb light at significantly lower energies in the visible rangeReference Min, Zhang, Chen and Zhang14; Wang et al. reported the preparation of Zn3V2O8 through solid-state calcination and its photocatalytic activity for O2 evolution.Reference Wang, Tang, Zou and Ye15 The floriated nanobelt and nanostructures of Zn3V2O7(OH)2(H2O)2 were successfully synthesized, and it was used as a kind of photocatalyst for organic pollutant degradation under UV light irradiation. The photocatalytic activity of the Zn3(VO4)2 nanostructure formed via calcination of Zn3V2O7(OH)2(H2O)2 was 3 times that of the sample prepared by solid-state reaction under visible light irradiation.Reference Shi, Wang, Zhou and Zhu16 It is well known that solid-state calcination reactions not only consume too high energy but also obtain the photocatalytics with low surface areas. Therefore, how to synthesize nanostructured photocatalytics through soft chemical methods is very important in the practical application.
In this study, Zn3(VO4)2 nanorods have been prepared from simple hydrothermal synthesis and characterized by several means, such as x-ray diffraction (XRD), Fourier transform infrared (FTIR), scanning electron microscopy (SEM), x-ray photoelectron spectroscopy (XPS), UV–vis diffuse reflectance spectra (DRS), and Brunauer–Emmett–Teller (BET) surface area and pore size analyzer. Furthermore, the adsorption isotherm and photocatalytic degradation of methylene blue (MB) from aqueous solutions have been further studied in detail. The photocatalytic degradation for 4-nitrophenol (4-NP), as a kind of typical phenol pollutant with less degradation activity, over the nanorod photocatalysts has been also studied. The photocatalytic mechanism in the degradation process was also further studied based on the main active species.
II. EXPERIMENTAL
A. Materials and preparation of the Zn3(VO4)2 nanorods
NH4VO3 and ZnSO4•7H2O were purchased from Aladdin Reagent Co. Ltd, China. All other reagents were used as received and without further purification. Distilled deionized water was used with a resistivity of 18.0 MΩ cm. The Zn3(VO4)2 nanorods were prepared from typical hydrothermal treatment as follows: A mixture of NH4VO3 (0.351 g, 3 mmol), ZnSO4•7H2O (2.301 g, 8 mmol), CF3COOH (0.5 mL), and distilled deionized water (60 mL) was stirred for 40 min under room temperature and then sealed in a 100 ml teflon-lined reactor and heated in an oven at 180 °C for 18 h and then slowly cooled to room temperature. After filtration, the resulting powder was washed with water and ethanol several times to ensure the elimination of the excess of surfactant, then dried at 80 °C in a dust-proof environment to obtain a dark green powder of Zn3(VO4)2 nanorods.
For comparison, N-doped TiO2 was also prepared through low temperature synthesis according to the literature reported by Wu et al.Reference Wu, Long, Cai, Chen and Wu17
B. Characterization of Zn3(VO4)2 nanorod photocatalysts
The powder XRD patterns were recorded on a Rigaku D/MAX-RB diffractometer (Rigaku, Tokyo, Japan) with monochromatized Cu Kα radiation (λ = 1.5418 Å). The generator was operated at 40 kV and 25 mA. The samples were scanned at diffraction angles from 10 to 80° at the scanning rate of 0.068°/s; The FTIR spectrum was recorded between 4000 and 400 cm−1 on a Nicolet FT-360 instrument; The morphological observations were performed on a field emission scanning electron microscope (FESEM, S-4800, Hitachi, Japan) and linked with an Oxford Instruments x-ray analysis system; XPS experiments were carried out in an ultrahigh vacuum using the ESCALAB Mark II XPS (Thermo-VG Scientific Ltd., UK) with Mg Kα radiation (1253.6 eV) from the Mg anode source. The high-resolution scans of core level spectra were recorded with an energy step of 0.05 eV and set to 15 eV pass energy. The binding energy was referenced to the C1s peak at 284.6 eV; A PerkinElmer Lambda 35 UV/vis spectrometer equipped with a labsphere diffuse reflectance accessory was used to characterize the UV–vis DRS of the catalyst over a range of 200–700 nm. Labsphere RSA-PE-20 was used as a reflectance standard; The specific surface area of the sample was measured using the BET method by a surface area and pore size analyzer (SA3100, Beckman Coulter). Prior to the measurements, samples were degassed at 180 °C for 3 h.
C. Adsorption equilibrium experiments
The batch equilibrium experiments were carried out in conical flasks and rotated in the reciprocating shaker under the same conditions. To obtain the adsorption isotherm, the powders of Zn3(VO4)2 nanorods at a constant dose of 1.0 g/L were added to the MB solution at different concentrations (10–60 mg/L). Aliquots were taken from the flask at equilibrium after 120 min, centrifuged, diluted, and analyzed by UV–visible spectrophotometer to determine the initial and equilibrium MB concentrations of the solutions. The amount of MB adsorbed onto Zn3(VO4)2 nanorods at equilibrium was calculated by the difference between the initial and equilibrium MB concentrations.
D. Photocatalytic activity studies
To examine the photocatalytic degradation of MB, a solution containing 10 mg/L MB and as-prepared Zn3(VO4)2 nanorod catalysts was allowed to equilibrate for 60 min in the darkness. Then, 50 mL of the prepared suspension was transferred to a 500 mL pyrex reactor. The reactor was open to air to ensure enough oxygen in the reaction solution. The lamp was switched on to initiate the reaction. A 250 W indoor fluorescent lamp was used as a visible light irradiation source, cooled with flowing water in a quartz cylindrical jacket around the lamp. The short wave length components (λ < 420 nm) of the light were cut off using a glass optical filter. The distance between the lamp and the center of the quartz tube was 15 cm. During irradiation, agitation was maintained to keep the suspension homogeneous, and then this was sampled after an appropriate illumination time. The N–TiO2 powder was also tested for comparison to evaluate the photocatalytic degradation activity of the Zn3(VO4)2 nanorods. The concentration of the MB in each degraded sample was determined with a spectrophotometer (UV/vis Spectrophotometer, WFZUV-2000) at λmax = 665 nm and a calibration curve. Using this method, the ratio of the MB instant concentration of the solution (C t) to the initial concentration of MB, C t/C 0, was obtained to evaluate the photocatalytic degradation. Total organic carbon (TOC) was determined using a TOC analyzer (Shimadzu TOV-VCPH). In the experiment of the photocatalytic degradation of 4-NP, an initial concentration of 5 mg/L 4-NP was used, and the other experimental conditions and operations were the same as the degradation of MB.
III. RESULTS AND DISCUSSION
A. XRD spectrum
Figure 1 shows the XRD patterns of the as-prepared Zn3(VO4)2 nanorods. All peaks can be well indexed to orthorhombic structured Zn3(VO4)2 with a space group of Cmca and the cell parameters a = 6.088 Å, b = 11.489, and c = 8.280 Å, which shows a good agreement with the literature data (JCPDS no. 73-1300).
XRD patterns of the as-prepared Zn3(VO4)2 nanorods.

B. FTIR spectrum
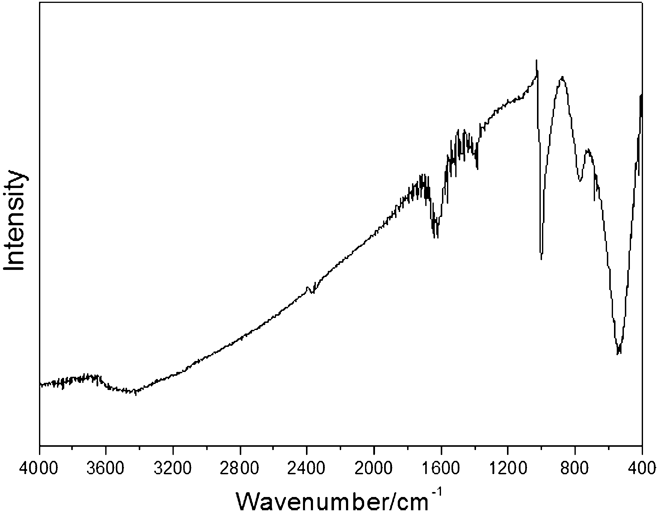
The characteristic peaks in the FTIR spectrum of the Zn3(VO4)2 nanorods are shown in Fig. 2. Two peaks at 998 and 495 cm−1 were assigned to υs(V–O–Zn) and υs(V–O–V), respectively, while the peak at 774 cm−1 can be ascribed to the corresponding asymmetric vibrations υas(V–O–Zn) and υas(V–O–V). These characteristic peaks are consistent with the previous report.Reference Wang, Shi and Jiang18 The peaks at 3468 and 1625 cm−1 may be assigned to the symmetric stretching vibration and bending vibration of H–O–H from water molecules adsorbed by the surface of nanorods.
FTIR spectrum of the as-prepared Zn3(VO4)2 nanorods.
C. SEM images
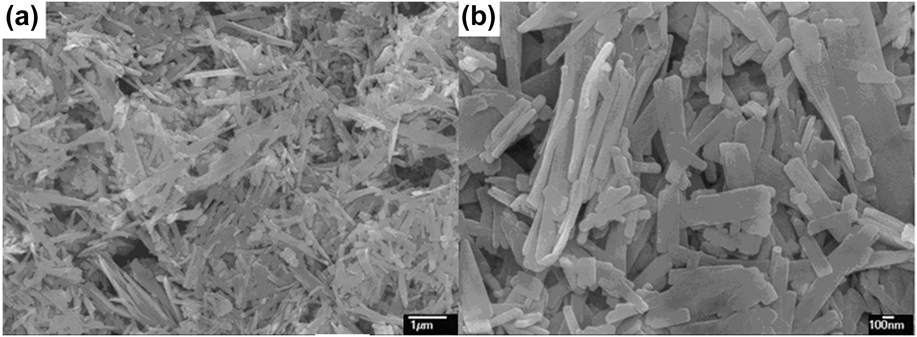
Figure 3 presents the SEM images of the prepared Zn3(VO4)2 nanorod powder. The low-magnification SEM image [Fig. 3(a)] shows that the obtained sample consists of many nanorods. It can be observed from the high magnification SEM image [Fig. 3(b)] that the nanorods consisted of rods with a thickness of approximately 30 nm, length in the range 400–600 nm, and width in the range 150–250 nm.
SEM images of the Zn3(VO4)2 nanorods for (a) low-magnification and (b) high-magnification.
D. XPS spectrum
The surface chemical composition of the as-prepared Zn3(VO4)2 nanorods was further checked by XPS, and the obtained results are shown in Fig. 4. It can be seen from the survey spectrum that this sample was composed of Zn, V, and O, except for the ubiquitous C contaminants, which are usually unavoidable in the XPS measurements. The resolution XPS spectra of Zn2p core levels revealed that the binding energies of Zn2p3/2 and Zn2p1/2 of this sample were 1022 and 1042 eV, respectively. The typical O2s core level with 530 eV was observed. Besides, the binding energy of V2s and V2p3/2 of this sample was observed at 630 and 513 eV, respectively.
XPS spectrum of the Zn3(VO4)2 nanorod sample.
E. DRS measurement
The photoabsorption ability of the nanomaterial was detected by UV–vis DRS, as shown in Fig. 5. The Zn3(VO4)2 nanorods showed the strong photoabsorption properties from the light region of 280–800 nm. The band gap energy (E g) of the material can be estimated by the formula: E g = 1240/λg, where λg is the wave length corresponding to the intersection point of the vertical and horizontal parts of the spectrum. The absorption band edge of the Zn3(VO4)2 nanorods is about 500 nm, and the E g value of Zn3(VO4)2 nanorods was determined from a plot of (AR)2 versus energy E g and was elicited to be 2.44 eV (inset in Fig. 5), indicating that the as-prepared photocatalyst has a strong visible light response.
UV–vis DRS and the plot of (AR)2 versus energy E g (inset) of the Zn3(VO4)2 nanorods.
F. BET surface areas and pore structure
Figure 6 shows the nitrogen adsorption–desorption isotherms and the corresponding pore-size distribution (PSD) curve of the as-prepared Zn3(VO4)2 nanorods. The shape of the hysteresis loop for the nanorods is a type H3, associated with plate-like particles giving rise to narrow slit-shaped pores, which is consistent with the SEM results (Fig. 3). The sample shows the isotherm of type IV, with a hysteresis loop at relative pressure P/P 0 between 0.2 and 1.0, indicating the presence of microporous and mesoporous formed by aggregation of nanorods.Reference Sing, Everett, Haul, Moscou, Pierotti, Rouquerol and Siemieniewska19 From the inset PSD curve, the quite broad (from 2 to 70 nm) and bimodal microporous (3–5 nm) and mesoporous (about 27.0 nm) were found. The microporous reflects porosity within nanorods, while mesoporous can be related to the pores formed between stacked nanorods, which can be seen from the SEM images mentioned above. Such organized porous structures might be extremely important in photocatalysis because of their efficient transport pathways between reactant and product molecules.Reference Wang, Yu, Ho, Hou and Fu20,Reference Yu, Su and Cheng21
N2 adsorption–desorption isotherms and PSD (inset) of the Zn3(VO4)2 nanorods.
G. Adsorption isotherm studies
It has been demonstrated that the photocatalytic degradation rate depends greatly on the adsorption behavior between photocatalyst and pollutant molecules, and the adsorption of pollutant molecules onto the catalyst can significantly improve the degradation efficiency.Reference Tryba, Morawski and Inagaki22 Adsorption isotherm models are commonly used to describe adsorption and further investigate its adsorptive mechanisms. Figure 7 presents the equilibrium adsorption characteristics of MB onto Zn3(VO4)2 nanorods under room temperature. It was observed that the equilibrium adsorption capacity, Q e, increased with the increase of C e. With the increase of an initial MB concentration from 10 to 60 mg/L, the amount of the adsorbed MB at equilibrium increased from 9.8 to 39.9 mg/g. The explicit isotherm of L-shape, according to Giles et al.,Reference Giles, MacEwan, Makhwa and Smith23 indicated that there is no strong competition between the solvent and MB to occupy the Zn3(VO4)2 nanorods. Based on the equilibrium adsorption characteristics of MB onto Zn3(VO4)2 nanorods, the Langmuir isotherm was fitted well with the correlation coefficient of 0.9998, indicating the existence of monolayer adsorption onto the photocatalytic surface.Reference Özacar and Şengil24
Adsorption isotherm of MB onto Zn3(VO4)2 nanorods at room temperature. The inset presents the linear fit for Langmuir isotherm model.
H. Photocatalytic degradation activity
The photocatalytic degradation of MB dye was measured as a function of irradiation time in the presence of the Zn3(VO4)2 nanorod catalysts, and N–TiO2 powder was also tested for comparison, as shown in Fig. 8(a). Under the same conditions, the photocatalytic activity of the as-prepared Zn3(VO4)2 nanorod sample was about 3.5 times higher than that of N–TiO2. To further study the photocatalytic property of the Zn3(VO4)2 nanorods, we also determine the TOC degradation, as compared to the decoloration. The rate of the TOC reduction was slower than that of the decoloration of the MB dye. For the concentration of 10 mg/L, the decoloration rate reached 96%, while the TOC removal rate of the solution reached to about 51% within 150 min, indicating that the as-prepared photocatalyst shows high photocatalytic efficiency in mineralizing organic pollutant.
(A) Photocatalytic degradation of MB by (a) N–TiO2 for C t/C 0; (b) Zn3(VO4)2 nanorods for TOC; and (c) Zn3(VO4)2 nanorods for C t/C 0 under visible light irradiation; (B) Absorption changes of a MB aqueous solution at room temperature in the presence of Zn3(VO4)2 nanorods under visible light irradiation.
Figure 8(b) shows the change of absorption spectra of MB in the presence of Zn3(VO4)2 nanorods. The two absorption peaks at 250 and 291 nm in the ultraviolet regions dropped gradually with increasing irradiation time and almost completely disappeared after 150 min. The intensity of the major absorption peak at 660 nm in the visible region drops apparently with a concomitant shift of the peak to shorter wave length. This indicates that MB dye is de-ethylated in a stepwise manner and the ethyl groups are removed one by one. No new absorption peaks appeared in the visible or the ultraviolet regions, which indicated the complete photocatalytic decoloration of the MB during the photocatalytic reaction.
To further evaluate the photocatalytic activities for the degradation of phenol pollutant over the as-prepared photocatalyst, the degradation of 4-NP over Zn3(VO4)2 nanorods has been also studied, as shown in Fig. 9. Under the same conditions, the photocatalytic activity of the as-prepared Zn3(VO4)2 nanorod sample was about 2.5 times higher than that of N–TiO2. For the concentration of 5 mg/L of 4-NP, the degradation rate reached 90%, and the TOC removal rate of the solution reached to about 44% within 6 h, indicating that the as-prepared photocatalyst also shows high photocatalytic efficiency in mineralizing phonetic pollutant. Therefore, the activity of our prepared sample is high and may be used in practical applications based on the degradation activities for MB and 4-NP pollutants.
(A) Photocatalytic degradation of 4-NP by (a) N–TiO2 for C t/C 0; (b) Zn3(VO4)2 nanorods for TOC; and (c) Zn3(VO4)2 nanorods for C t/C 0 under visible light irradiation; (B) Absorption changes of a 4-CP aqueous solution at room temperature in the presence of Zn3(VO4)2 nanorods under visible light irradiation.
I. Photocatalytic mechanism
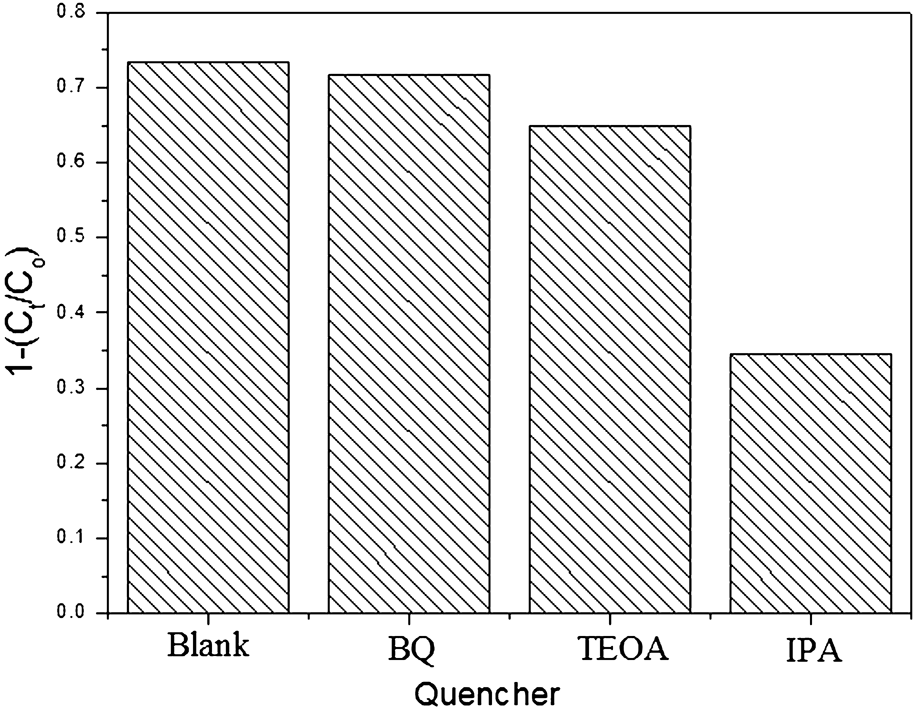
The main oxidative species in the photocatalytic process could be detected through the trapping experiments of carriers. The effects of p-benzoquinone (BQ, •O2 scavenger), isopropyl alcohol (IPA, •OH scavenger), and triethanolamine (TEOA, electron scavenger) on the photodegradation rate of MB under visible light irradiation were investigated and the results are shown in Fig. 10. The results reveal that the MB photodegradation was significantly suppressed by IPA and slightly decreased by TEOA, indicating that the superoxide radicals (•OH) might be the main active species in MB photodegradation, and the photogenerated electrons also partly involved in the process of photocatalytic degradation.
Trapping experiments in the system of photodegradation of MB by Zn3(VO4)2 nanorods. [MB] = 10 mg/L, photocatalytic dosage: 1.0 g/L, [quencher] = 5 mM, and time: 80 min.
To further verify the role of the •OH radical in the photocatalytic degradation, the determination of •OH radical in the process of photocatalytic degradation was also studied. The determination of •OH radical's formation in the process of photocatalytic degradation under visible light irradiation was performed by fluorescence technique using terephthalic acid (TA), which readily reacted with •OH radicals to produce highly fluorescent product, 2-hydroxyterephthalic acid (HTA).Reference Xiang, Yu and Wong25,Reference Guo, Lin, Zheng, Xiao and Li26 The intensity of the peak attributed to HTA was known to be proportional to the amount of •OH radicals formed.
The fluorescence emission spectrum (excitation at 315 nm) of the TA solution in the presence of Zn3(VO4)2 nanorod powder was measured every 60 min during illumination. Figure 11 shows the induction of fluorescence from 5 × 10⁻⁴ M TA solution in 2 × 10⁻³ M NaOH. As shown in Fig. 11, a gradual increase in the fluorescence moderate intensity at about 425 nm was observed with increasing illumination time, indicating that the •OH does played an important part in the photocatalytic process. The plot of increase in the fluorescence intensity against illumination time at 425 nm has been also discussed (Fig. 11, inset). The fluorescence intensity under visible light illumination in TA solutions increased almost linearly against time. Consequently, it can be concluded that the •OH radicals formed at the interfaces of Zn3(VO4)2 nanorod powders were in proportional to the light illumination time obeying zero-order reaction rate kinetics.
•OH trapping PL spectra of Zn3(VO4)2 nanorods on the TA solution under visible irradiaion. The inset presents the plot of fluorescence intensity versus time.
IV. CONCLUSION
Zn3(VO4)2 nanorods have been prepared by a facile hydrothermal method from NH4VO3 and ZnSO4•7H2O as raw materials. The as-prepared nanorods were characterized in detail through XRD, FTIR, SEM, DRS, XPS, and BET. The SEM images show that the nanorods consisted of rods with a thickness of approximately 30 nm, length in the range 400–600 nm, and width in the range 150–250 nm. The Zn3(VO4)2 nanorod photocatalyst has a strong visible light response with E g = 2.44 eV. Based on the equilibrium adsorption characteristics of MB onto Zn3(VO4)2 nanorods, the Langmuir isotherm was fitted well. Under the same conditions, the photocatalytic degradation activity for MB and 4-NP over the as-prepared Zn3(VO4)2 nanorod sample in visible light was about 3.5 times and 2.5 times higher than that of N–TiO2, respectively. The main active species in MB photodegradation mostly come from •OH, and photogenerated electrons also partly involved in the photocatalytic degradation process.
ACKNOWLEDGMENTS
This work was supported by the Natural Science Foundation of Fujian, P.R. of China (2013H0053 and 2012J06005), the Natural Science Foundation of Zhangzhou (ZZ2012J01), the Key Laboratory of Urban Environment and Health, Institute of Urban Environment, Chinese Academy of Sciences (KLUEH201305), and Innovation Team of Minnan Normal University.