


Introduction
The evolution of continuous traits is critically dependent on the genetic variance available in populations. Moreover, since traits in multicellular complex organisms often are not genetically independent (due to pleiotropy, epistasis, and linkage disequilibrium), these organisms cannot be regarded as a collection of independent parts being changed by evolutionary processes. Instead, an organism must be understood as a coherent whole, with relationships described by a covariance structure. Thus, traits usually evolve in a correlated way, and to fully understand the evolution of complex structures (like the mammalian skull) we need to deal with the inheritance of such multidimensional phenotypes (Fisher Reference Fisher1930; Wright Reference Wright1931; Lande Reference Lande1979; Lande and Arnold Reference Lande and Arnold1983; Falconer and MacKay Reference Falconer and MacKay1996). Quantitative genetics provides a framework with which to understand multivariate phenotypic character evolution, and this framework has been used to study many evolutionary questions in several extant and some extinct species, from plants to vertebrates (e.g., Lande Reference Lande1979; Cheverud Reference Cheverud1984; Lofsvold Reference Lofsvold1986; Arnold Reference Arnold1992; Steppan Reference Steppan1997; Goswami Reference Goswami2006; Goswami et al. Reference Goswami, Smaers, Soligo and Polly2014; Hansen and Houle Reference Hansen and Houle2008; Webster and Zelditch Reference Webster and Zelditch2011; Porto et al. Reference Porto, Shirai, de Oliveira and Marroig2013; Armbruster et al. Reference Armbruster, Pélabon, Bolstad and Hansen2014; Haber Reference Haber2015). Under this framework it is fundamental to determine the additive genetic variance–covariance matrix (hereafter G matrix), since it interacts with evolutionary processes to determine the rate and direction of evolution (Lande Reference Lande1979; Lande and Arnold Reference Lande and Arnold1983; Cheverud Reference Cheverud1984).
The G matrix is a symmetric square matrix in which each row/column represents a phenotypic trait measured in a population. The G matrix describes the additive genetic variance of each trait (i.e., unstandardized measure of heritability) on the diagonal and the additive genetic covariance between traits on the off-diagonal elements (Lande Reference Lande1979; Arnold Reference Arnold1981; Cheverud Reference Cheverud1988; Steppan et al. Reference Steppan, Phillips and Houle2002). Therefore, the G matrix describes the population’s variance and covariance that are linearly inheritable for a given set of traits and is relevant for the prediction of evolution on these traits (Falconer and MacKay Reference Falconer and MacKay1996; McGuigan Reference McGuigan2006). There are two aspects of the G matrix that should be conjointly studied to understand a population’s mean phenotypic evolution (Marroig and Cheverud Reference Marroig and Cheverud2001; Marroig et al. Reference Marroig, Shirai, Porto, de Oliveira and De Conto2009; Porto et al. Reference Porto, Oliveira, Shirai, Conto and Marroig2009): one is the matrix structure, which is the relationship (covariance or correlation) between traits; the other is the matrix’s overall magnitude of integration, which is related to the intensity of the relationships between traits (Porto et al. Reference Porto, Oliveira, Shirai, Conto and Marroig2009).
The theory involving the G matrix and its consequences for mean phenotype evolution was originally developed to explain changes occurring within a few generations (microevolution; Lande Reference Lande1979; Marroig and Cheverud Reference Marroig and Cheverud2001). However, this theory can be extended to account for the evolution among distinct species (macroevolution) if one major condition is satisfied: G matrices from different lineages share a similar structure (Lande Reference Lande1979; Turelli Reference Turelli1988; Jones et al. Reference Jones, Arnold and Bürger2004). Matrices are similar when they predict similar responses to directional selection, or if they suggest similar partitions of traits in variational modules, that is, similar patterns of high and low correlations between traits in both matrices. Theoretical models (Lande Reference Lande1979; Turelli Reference Turelli1988; Barton and Turelli Reference Barton and Turelli1989) and empirical studies (Arnold Reference Arnold1981; Lofsvold Reference Lofsvold1986; Cheverud Reference Cheverud1988; Kohn and Atchley Reference Kohn and Atchley1988; Wilkinson et al. Reference Wilkinson, Fowler and Partridge1990; Shaw et al. Reference Shaw, Shaw, Wilkinson and Turelli1995; Roff Reference Roff1996; Bégin and Roff Reference Bégin and Roff2003) do not agree in their assessment of the degree of structural similarity between G matrices from different evolutionary lineages. Therefore, we must empirically assess the structural similarity between the G matrices of the evolutionary lineages of interest before conducting any macroevolutionary study with them (Turelli Reference Turelli1988; Arnold Reference Arnold1992; Steppan Reference Steppan1997; Arnold et al. Reference Arnold, Buerger, Hohenlohe, Ajie and Jones2008).
However, the accurate estimation of the G matrix, even for a single population, is a complex enterprise, because G-matrix estimation requires a large number of related individuals, from hundreds to thousands, in known genealogies (Steppan et al. Reference Steppan, Phillips and Houle2002; McGuigan Reference McGuigan2006). This is especially limiting when studying organisms that are difficult to breed in the lab or that have long life spans. In some cases, such extinct species, it is impossible to estimate G matrices. Thus, obtaining G matrices and testing their structural similarity is often unfeasible, and the understanding of mean phenotypic micro- or macroevolution using quantitative genetics is hampered.
Fortunately, there is consistent evidence, at least for morphological traits, and particularly for mammals, that the variance–covariance phenotypic matrix (henceforth P matrix) can be used as a surrogate for the G matrix (the Cheverud conjecture; Cheverud Reference Cheverud1988, Reference Cheverud1996; Roff Reference Roff1995; Reusch and Blanckenhorn Reference Reusch and Blanckenhorn1998; House and Simmons Reference House and Simmons2005; Akesson et al. Reference Akesson, Bensch and Hasselquist2007; Porto et al. Reference Porto, Oliveira, Shirai, Conto and Marroig2009). Working with P matrices is easier, because they are simpler to estimate with any confidence than G matrices, since P matrices can be determined without genealogical information (Cheverud Reference Cheverud1988). Besides, estimating P matrices is also relevant by itself, since “natural selection acts on phenotypes, regardless of their genetic basis” (Lande and Arnold Reference Lande and Arnold1983: 1210). The most challenging aspect in properly estimating P matrices is obtaining adequate sample sizes, because the lower the ratio between sample size and number of traits analyzed, the greater the influence of error on the P-matrix estimation (Marroig et al. Reference Marroig, Melo and Garcia2012).
However, the Cheverud conjecture should not be taken as an axiom. Instead, it should be empirically evaluated for the evolutionary lineages under study (Marroig and Cheverud Reference Marroig and Cheverud2001, Reference Marroig and Cheverud2010). To do so, it is always preferable to have at least one G matrix for comparison, but this is not strictly necessary. If high structural similarity between the P matrices is observed, this is most probably due to a common G-matrix structure. Since the phenotype is mainly determined by the additive genetic effect (G) and an environmental variation (E; P=G+E; Falconer and MacKay Reference Falconer and MacKay1996), there are two possibilities to explain the structural similarity between P matrices. First, the G matrices share a similar structure, and the resemblance between P matrices is related to a common genetic background. Second, the G matrices have different structures, and the environmental matrices of each lineage would accurately compensate for the effects of G matrices to always generate P matrices with similar structures. The second option is highly unlikely, especially in a context that compares a large number of taxa that have a long evolutionary history and diverse ecology (Marroig and Cheverud Reference Marroig and Cheverud2001).
The approach outlined above has been successfully used as a first fundamental step to understanding mammalian cranium morphological evolution (Cheverud Reference Cheverud1982, Reference Cheverud1988; Lofsvold Reference Lofsvold1986; Steppan Reference Steppan1997; Marroig and Cheverud Reference Marroig and Cheverud2001; Ackermann and Cheverud Reference Ackermann and Cheverud2004; Oliveira et al. Reference Oliveira, Porto and Marroig2009; Porto et al. Reference Porto, Oliveira, Shirai, Conto and Marroig2009; Shirai and Marroig Reference Shirai and Marroig2010). The mammalian cranium is an appealing model for studying morphological macroevolution, because it has a complex development and is involved in several of the organism’s vital functions (e.g., brain protection, food processing) that allow the exploration of a wide range of questions (e.g., Cheverud Reference Cheverud1995; Ackermann and Cheverud Reference Ackermann and Cheverud2004; Hallgrímsson et al. Reference Hallgrímsson, Jamniczky, Young, Rolian, Parsons, Boughner and Marcucio2009; Marroig and Cheverud Reference Marroig and Cheverud2010; Cardini and Polly Reference Cardini and Polly2013; Porto et al. Reference Porto, Shirai, de Oliveira and Marroig2013; Haber Reference Haber2015).
Unfortunately, there are cases in which even P matrices cannot be properly estimated, such as for fossils lacking adequate sample sizes. This is frustrating, because most of world’s biological diversity is represented by fossils (Benton and Harper Reference Benton and Harper2009). For mammalian cranium morphological evolutionary studies covering extant and extinct taxa, one approach is to use the parameters determined for the extant groups as proxies for the extinct ones (Ackermann Reference Ackermann2003, Reference Ackermann2005; Ackermann and Cheverud Reference Ackermann and Cheverud2004). This approach relies on the uniformitarianism paradigm, which is not necessarily true (Ackermann Reference Ackermann2005). However, empirical studies have shown high structural similarity between the P matrices of extant taxa representing several lineages of the therian mammals (Lofsvold Reference Lofsvold1986; Steppan Reference Steppan1997; Marroig and Cheverud Reference Marroig and Cheverud2001; Ackermann and Cheverud Reference Ackermann and Cheverud2004; Goswami Reference Goswami2006, Reference Goswami2007; Oliveira et al. Reference Oliveira, Porto and Marroig2009; Porto et al. Reference Porto, Oliveira, Shirai, Conto and Marroig2009; Shirai and Marroig Reference Shirai and Marroig2010; Haber Reference Haber2015), suggesting the P matrices from extinct taxa could be replaced by P matrices from extant taxa.
Within this context, we aim to deepen our knowledge regarding Xenarthra, which is one of the major Placentalia group and has not been thoroughly studied under an evolutionary quantitative genetics framework. More specifically, one of our goals is to present the first broad-scale test of the Cheverud conjecture for xenarthran cranium P matrices, taking into account 12 extant and 4 extinct lineages. By testing the Cheverud conjecture within this magnaorder, we automatically achieve another goal: assessing the structural similarity of P matrices within Xenarthra. We also aim to explore the range of overall magnitude of integration within Xenarthra. By doing so, we characterize both fundamental aspects of the P matrix that are relevant to evolutionary studies. Complementarily, we explore whether phylogenetic proximity and morphological similarity influence both the structure of the P matrices and their overall magnitude of integration. Finally, since we found particularities in some xenarthran P matrices, we use the case study with Xenarthra to provide guidelines to researchers interested in performing evolutionary quantitative genetic analyses involving extinct lineages, especially when one cannot properly estimate P matrices for these lineages.
To accomplish these goals, we estimated P matrices for every evolutionary lineage at different taxonomic and phylogenetic levels (genera, subfamily, family, suborder, and order). The Cheverud conjecture was tested through the comparison of the structural similarity of the P matrices among genera to orders. Overall magnitude of integration was calculated for the P matrix of each genus. Distance matrices of the phylogeny, morphology, and overall magnitude of integration and a similarity matrix of P-matrices’ structures were determined at the genus level. These matrices were compared to evaluate the morphological differentiation (on average) and the influence of phylogeny on the P-matrices’ structures and their overall magnitude of integration.
Brief Contextualization of the Xenarthra (Mammalia)
Although the relationship of the Xenarthra with other mammals is not well resolved (Delsuc et al. Reference Delsuc, Catzeflis, Stanhope and Douzery2001; Murphy et al. Reference Murphy, Eizirik, O’Brien, Madsen, Scally, Douady, Teeling, Ryder, Stanhope, de Jong and Springer2001; Bininda-Emonds et al. Reference Bininda-Emonds, Cardillo, Jones, MacPhee, Beck, Grenyer, Price, Vos, Gittleman and Purvis2007; Goloboff et al. Reference Goloboff, Catalano, Mirande, Szumik, Arias, Kallersjo and Farris2009; O’Leary et al. Reference O’Leary, Bloch, Flynn, Gaudin, Giallombardo, Giannini, Goldberg, Kraatz, Luo, Meng, Ni, Novacek, Perini, Randall, Rougier, Sargis, Silcox, Simmons, Spaulding, Velazco, Weksler, Wible and Cirranello2013), their monophyly is well supported both by morphological (Engelmann Reference Engelmann1985; Gaudin Reference Gaudin2004) and molecular data (Bininda-Emonds et al. Reference Bininda-Emonds, Cardillo, Jones, MacPhee, Beck, Grenyer, Price, Vos, Gittleman and Purvis2007; Delsuc et al. Reference Delsuc, Superina, Tilak, Douzery and Hassanin2012; O’Leary et al. Reference O’Leary, Bloch, Flynn, Gaudin, Giallombardo, Giannini, Goldberg, Kraatz, Luo, Meng, Ni, Novacek, Perini, Randall, Rougier, Sargis, Silcox, Simmons, Spaulding, Velazco, Weksler, Wible and Cirranello2013). The Xenarthra are represented by three major groups, markedly distinct in their morphology, ecology, and biology: Folivora (sloths), Vermilingua (anteaters), and Cingulata (armadillos; Eisenberg Reference Eisenberg1989; Redford and Eisenberg Reference Redford and Eisenberg1992; Eisenberg and Redford Reference Eisenberg and Redford1999; Gardner Reference Gardner2007).
The origin of the Xenarthra precedes 60 Ma (Simpson Reference Simpson1980; Bergqvist et al. Reference Bergqvist, Abrantes and Avilla2004; Bininda-Emonds et al. Reference Bininda-Emonds, Cardillo, Jones, MacPhee, Beck, Grenyer, Price, Vos, Gittleman and Purvis2007; Delsuc et al. Reference Delsuc, Superina, Tilak, Douzery and Hassanin2012). Most of the group diversification occurred in South America, but some lineages evolved in Central and North America (Simpson Reference Simpson1980). The current distribution of xenarthrans is from southern North America into Patagonia (Gardner Reference Gardner2007). Evidence suggests their occurrence in the Northern Hemisphere was broader in the past, with several fossils found throughout North America (Stock Reference Stock1942; McDonald et al. Reference McDonald, Harington and De Iuliis2000; McDonald and Pelikan Reference McDonald and Pelikan2006; Gardner Reference Gardner2007; Hoganson and McDonald Reference Hoganson and McDonald2007). The xenarthrans are represented by 31 extant species in 14 genera (21 armadillos, 6 sloths, and 4 anteaters) that vary between 100 g and 40 kg (Eisenberg and Redford Reference Eisenberg and Redford1999; Delsuc et al. Reference Delsuc, Superina, Tilak, Douzery and Hassanin2012), but in the recent past (between the late Pleistocene and middle Holocene), they were far more speciose, and some species could weigh more than 1 ton (McDonald Reference McDonald2005; Cartelle et al. Reference Cartelle, De Iuliis and Pujos2008; Vizcaino et al. Reference Vizcaino, Bargo and Fariña2008).
Material and Methods
Samples
A total of 1139 adult specimens belonging to 16 genera (12 extant and 4 extinct; Fig. 1) were measured and used in this study. Specimens were considered adult when the supraoccipito-exoccipital and the basioccipito-exoccipital sutures were closed (i.e., completely ossified), the basioccipito-basisphenoid suture was fused or closed, texture of external bones was uniformly smooth, and viscerocranium and neurocranium exhibited adult proportions (Cheverud Reference Cheverud1995; Anderson and Handley Reference Anderson and Handley2001; Elbroch Reference Elbroch2006; Porto et al. Reference Porto, Oliveira, Shirai, Conto and Marroig2009). The process of determining whether a specimen is adult is to some extent iterative, in the sense that we need to examine several specimens of a species to develop the parameters that would allow determining adulthood. We would like to clarify that the definition of adulthood may vary according to research interest, and in our case adults are specimens in which development had no more influence, or drastically decreased influence, over phenotype. Xenarthra have, in relation to other mammals, morphological and developmental particularities (Eisenberg Reference Eisenberg1989; Redford and Eisenberg Reference Redford and Eisenberg1992; Eisenberg and Redford Reference Eisenberg and Redford1999; Gardner Reference Gardner2007; Hautier et al. Reference Hautier, Weisbecker, Goswami, Knight, Kardjilov and Asher2011; Rager et al. Reference Rager, Hautier, Forasiepi, Goswami and Sánchez-Villagra2014), and some classical adulthood parametrization (e.g., tooth eruption and wearing or basioccipito-basisphenoid closure) may not be applicable to Xenarthra; but with the several parameters adopted, we most likely sampled specimens whose phenotypes were no longer under major developmental influence. Using the specimens selected based on the above criteria, we further observed the within-genera specimen distribution in principal component analysis (PCA) scatter plots based on the first and second PCs for genera with at least 20 specimens. In all cases, there were no outliers. All specimens were examined and identified by A.H. Only specimens identified to the species level were included in our sample. All extant specimens were wild caught.
Phylogenetic/taxonomy hierarchy adopted. Within parentheses are the sample sizes for the different data sets of distances (35D, 32D, 28D, and 25D). See section “Sets of distances” for clarifications. † denotes an extinct genus. * denotes taxa not included in the analyses above the genus level. NA means no available sample for the specified set of distances.

The fossil record is patchy, and paleontological analyses often rely on a limited number of fossils per species. The adequate number of specimens per species may vary according to the kind of analyses performed, and in our case less than five specimens is prohibitive, and as will be shown throughout our paper, samples that are smaller than the number of traits can be considered inappropriate, since matrix estimation will probably be dominated by sampling error (Marroig et al. Reference Marroig, Melo and Garcia2012). Xenarthra has a rich fossil record, and ideally we would have sampled several extinct lineages within Cingulata, Vermilingua, and Folivora. However, we were able to measure at least five skulls containing the appropriate number of landmarks (see subsections “Landmarks and Measurements” and “Sets of Distances” ) and not presenting morphological distortion only for four Folivora genera. Among the four extinct sloths, only Paramylodon was reasonably sampled (Fig. 1). Consequently, for the other three genera, sampling error probably contributed substantially to their estimated P matrices (Marroig et al. Reference Marroig, Melo and Garcia2012). To avoid biases in the results due to potentially high sampling errors, data from Acratocnus, Neocnus, and Scelidotherium were not included in the analyses above the genus level or in the determination of the similarity/distance matrices.
Taxonomy and Phylogeny
The adopted taxonomy reflects the phylogenetic relationships, and the analyses were therefore both taxonomically and phylogenetically structured. The least inclusive taxonomic level analyzed was genus. Species were not considered due to the absence of a well-resolved phylogeny for the Xenarthra at this level and the lack of adequate sample sizes for several species. The taxonomy of extant Xenarthra is in accordance with Gardner (Reference Gardner2007). The taxonomy of the extinct genera followed the proposals of MacPhee et al. (Reference MacPhee, White and Woods2000), McAfee (Reference McAfee2009), and Miño-Boilini and Carlini (Reference Miño-Boilini and Carlini2009; see Fig. 1 for details regarding the taxonomic/phylogenetic hierarchy adopted).
Here, we follow the fully resolved extant genus phylogeny proposed by Möller-Krull et al. (Reference Möller-Krull, Delsuc, Churakov, Marker, Superina, Brosius, Douzery and Schmitz2007). When including the extinct Paramylodon, the Folivora clade was considered a polytomy due to the absence of a molecular phylogeny that includes this extinct genus and the major incongruence observed among morphological and molecular analyses involving extant and extinct taxa (see discussions in Gaudin Reference Gaudin2004; Clark Reference Clark2010).
Landmarks and Measurements
As noted earlier, all specimens were measured by A.H. For each specimen, three-dimensional coordinates were recorded for 32 landmarks (Fig. 2; Supplementary Table 1; Porto et. al. 2009) using an MX or MLX Microscribe digitizer. The determination of some landmarks varied according to the taxon and should be considered only partially homologous among the Xenarthra (see Supplementary Table 1 for details). Worth mentioning is that ZS and ZI in the anteater Cyclopes and ZYGO in Pilosa (anteaters and sloths; see Fig. 2 for details regarding these landmarks) could not be determined by the meeting of the sutures present in the other taxa due to the absence (or reduction) of the jugal and squamosal, respectively, and were determined as extremity points of anatomical regions determined by one or two bones (Supplementary Table 1).
Landmarks on ventral, dorsal, and lateral view of an armadillo Cabassous skull. Scale bar, 5 cm.

A set of 35 linear distances in millimeters were calculated based on the landmarks recorded (Table 1). Bilateral distances were averaged between both sides. If the distance from one side was missing, the distance from the other side was used to represent the bilateral distance. The set of distances calculated aimed to represent the whole cranium morphology and important developmental and functional relationships among cranial regions while avoiding redundancy (Cheverud Reference Cheverud1982; Marroig and Cheverud Reference Marroig and Cheverud2001). Furthermore, measurements were designed to capture local developmental/functional aspects of the skull, which has often been accomplished by measuring within bone interlandmark distances. We opt to use distances instead of landmark-based data under a generalized Procrustes analysis (GPA), because Van der Linde and Houle (Reference Van der Linde and Houle2009) demonstrated that GPA tends to disperse local variation onto all landmarks, producing covariation structures that are difficult to interpret. We believe that while GPA is good at describing shape changes, studies interested in covariation should adopt different methods. Thus, we think our measurements are better suited to our goal of representing the phenotypic part of the genetic-phenotypic map (sensu Wagner and Altenberg Reference Wagner and Altenberg1996) than the common practice of using PCs of shape (Walker Reference Walker2000; Van der Linde and Houle Reference Van der Linde and Houle2009; Berner et al. Reference Berner, Kaeuffer, Grandchamp, Raeymaekers, Räsänen and Hendry2011; Marquéz et al. Reference Marquéz, Cabeen, Woods and Houle2012). Each specimen was measured twice to account for measurement errors (Lessells and Boag Reference Lessells and Boag1987). The measurement error was estimated for genera with more than 15 specimens as a proportion of total variance due to within-individual differences in repeated measurements (Fig. 1). The measurement error calculated individually for each genus and trait ranged between 0.71 and 1, with an average for all genera and traits of 0.98 and a standard deviation of 0.03. Only six cases presented values below 0.89, and they were associated with traits exhibiting low total variation and not larger differences between replicas. Therefore, measurement error has a negligible impact on the subsequent analyses. Specimen traits were represented by the average between both measurements.
Linear distances and their relation to the cranial anatomical region.

Missing Data
Some of the fossil crania were incomplete and presented missing data. Fossil specimens that had missing data for sagittal distances were not considered in this study. For fossil specimens that had missing data for bilateral distances obtained from landmarks off the sagittal plane, a missing data-substitution procedure was adopted whenever the specimen had one of the landmarks that composes the distance at one side of the cranium and the other at the other side. The procedure consisted of reflecting one of the landmarks coordinates in relation to the cranium sagittal plane and then calculating the distance based on the original coordinates of one landmark and the reflected coordinates of the other (see supplemental material for more information and tests of reliability and accuracy of this procedure).
Sets of Distances
Pilosa has the premaxilla loosely attached to the maxilla, and several specimens analyzed did not have this bone, hindering the record of IS and preventing the calculation of all distances based on this landmark. Moreover, fossil specimens were consistently devoid of the cranium regions presenting IS, ZYGO, and NSL, preventing the calculation of the distances based on these landmarks. Due to these circumstances, four different sets of distances were used to progressively include more taxa and increase sample sizes in the analyses (Fig. 1): the original set of 35 distances (hereafter 35D); a set of 32 distances, excluding ISPM, ISNSL, and ISPNS (32D); a set of 28 distances, excluding ISPM, ISNSL, ISPNS, PTZYGO, ZIZYGO, EAMZYGO, and ZYGOTSP (28D); and a set of 25 distances, excluding ISPM, ISNSL, ISPNS, PTZYGO, ZIZYGO, EAMZYGO, ZYGOTSP, NSLNA, NSLZS, and NSLZI (25D).
On the one hand, this approach progressively allows the incorporation of new taxa in the analyses, increases sample sizes, and minimizes sampling error effect on the estimation of the P matrices (Marroig et al. Reference Marroig, Melo and Garcia2012). On the other hand, the overall cranium shape representation is gradually simplified. The regions most affected were the zygomatic arch (28D and 25D) and the face (25D). All analyses were performed for the four sets of distances.
Estimating Variance–Covariance and Correlation P Matrices
The P matrix can be represented as the variance–covariance matrix (hereafter covariance matrix) as well as its standardized form, the correlation matrix. Both forms were estimated, but before that, sources of potential variation in trait means that were not of immediate interest were statistically evaluated within each genus (Oliveira et al. Reference Oliveira, Porto and Marroig2009). The effect of sex, species, intraspecific variation, and their potential interactions, were tested through (1) MANOVA based on Wilk’s lambda statistic, considering the significance at p<0.05; and (2) univariate ANOVA, considering the tested effect as influencing trait means whenever two or more variables (distances) had significance at p<0.01. Notice that in some cases low sample size prevented analysis with MANOVA or in the 35D data set (see details in Table 2).
Sources of variation tested (x) and controlled (♦) for each xenarthran genus.

When the uni- and multivariate tests were significant, the effects of the respective source of variation and/or interaction between them were controlled (Table 2). Residual pooled within-group phenotypic covariance and correlation matrices were estimated for each genus using the general linear model approach (Marroig et al. Reference Marroig, de Vivo and Cheverud2004). Above the genus level, P covariance, and correlation matrices were estimated as the pooled within-group phenotypic matrices of the taxa following the adopted phylogeny (Fig. 1).
Testing the Cheverud Conjecture
The Cheverud conjecture was tested throughout different taxonomic/phylogenetic levels (genus, subfamily, family, suborder, and order). P matrices were calculated for each taxon at each level of analysis and compared pairwise. The structural similarity among covariance and correlation matrices was evaluated through the random skewers method (RS; Cheverud and Marroig Reference Cheverud and Marroig2007) and the Krzanowski projection method (KP; Krzanowski Reference Krzanowski1979, Reference Krzanowski2000; Blows et al. Reference Blows, Chenoweth and Hine2004). Although there are other methods suitable for matrix structure comparisons (e.g., Cheverud Reference Cheverud1988; Flury Reference Flury1988; Mitteroecker and Bookstein Reference Mitteroecker and Bookstein2009), we chose the RS and KP because they provide simple and intuitive measurements of overall similarity between two matrices and can be applied to covariance and correlation matrices.
The RS is based on the multivariate response to selection equation and consists of multiplying each matrix by 1000 normalized random-selection gradient vectors and correlating the resulting evolutionary-response vectors (normalized to a length of one) between each pair of matrices. The same vectors are used for each pair of matrices, and only the response to the same selection is correlated between each matrix pair. Therefore, a distribution of 1000 vector correlations of simulated evolutionary responses is obtained for each pair of matrices being compared. The mean vector correlation between the matrices’ evolutionary-response vectors is a measure of similarity (Cheverud and Marroig Reference Cheverud and Marroig2007). The RS correlation, as any correlation, can vary from −1 to 1. Yet in real matrices usually it varies between 0 (the matrices have distinct structures) and 1 (the matrices share the same structure). Statistical significance was evaluated by comparing the observed RS value with an empirically derived distribution of the correlation of 1000 random vectors. If the observed value exceeded 95% of the empirically derived distribution, it was considered different from 0 (Cheverud Reference Cheverud1996; Cheverud and Marroig Reference Cheverud and Marroig2007).
The KP consists in determining a projection S matrix that finds the best-matched pairs of orthogonal axes (PC) in the same k-dimensional subspace. The sum of the eigenvalues of the S matrix divided by the k dimensions represents the similarity of the two subspaces and is expressed between 0 and 1, where 0 means the two subspaces are dissimilar and 1 means they are strictly similar. The k dimensions were determined by the first k PCs of the integer part of half the original number of dimensions minus 1. For example, for the 35D data set, k=16 (integer part of 35/2 − 1; Krzanowski Reference Krzanowski1979, Reference Krzanowski2000; Blows et al. Reference Blows, Chenoweth and Hine2004).
Due to the finite nature of the samples, covariance and correlation matrices are estimated with error and, consequently, the maximum structural similarity (r max) between two matrices is not 1. In fact, r max is the square root of the product of the repeatabilities (t) of the pair of matrices (see the t calculation below). Hence, it is possible to obtain an adjusted similarity (r adj) as a proportion of r max and the observed similarity (r obs) according to (Cheverud Reference Cheverud1996):
 $$r_{{{\rm adj}}} \,{\equals}\,r_{{{\rm obs}}} /r_{{{\rm max}}} $$
The t for both correlation and covariance matrices was determined using a bootstrap resampling procedure of self-correlation (Marroig and Cheverud Reference Marroig and Cheverud2001; Porto et al. Reference Porto, Oliveira, Shirai, Conto and Marroig2009). For every evolutionary lineage, 1000 bootstrap resamplings of the original data were made, keeping sample size constant, after removing sources of variation (for details see Table 2). Correlation and covariance matrices were estimated for each of the resamples, and RS and KP were used to compare the original and the 1000 resample matrices. Mean RS and KP values represented t. It is important to keep in mind that the bootstrap resampling procedure should not be used when samples are smaller than the number of traits (Chernick Reference Chernick2008; Chernick and LaBudde Reference Chernick and LaBudde2010; Puth et al. Reference Puth, Neuhäuser and Ruxton2015). With small initial samples, use of the bootstrap resampling procedure on the matrix repeatability will produce overestimated values, as the bootstrap samples tend to be similar due to the small sample space, which will result in conservative corrections of the matrices’ similarities. In any event, these high repeatabilities should not be interpreted as indicating a well-estimated matrix.
In addition, the covariance and correlation genus P matrices were compared with the covariance and correlation G and P matrices of the rodent Calomys (Garcia Reference Garcia2010) through the RS and KP methods. The rationale for comparing Xenarthran P matrices with G and P matrices of other taxa is that if the structural similarity between these matrices is high, the Cheverud conjecture is supported.
Recently, Aguirre et. al. (Reference Aguirre, Hine, McGuigan and Blows2014) described methods for comparison of covariance matrices under the Bayesian paradigm, including the Bayesian RS and the Bayesian KP methods. The Cheverud conjecture between xenarthran genus P matrices was also evaluated using these methods.
Overall Magnitude of Integration
The overall magnitude of integration was determined for the genera correlation P matrices (Pavlicev et al. Reference Pavlicev, Cheverud and Wagner2009) by calculating the scale-independent coefficient of determination (r 2) that is the mean of squared correlation coefficients. The r 2 determines the overall level of correlation among all traits and potentially ranges from 0 (all traits are independent) to 1 (all traits are fully correlated; Cheverud et al. Reference Cheverud, Wagner and Dow1989; Porto et al. Reference Porto, Oliveira, Shirai, Conto and Marroig2009).
It was recently reported the r 2 may be biased by the sampled population coefficient of variation (Young et al. Reference Young, Wagner and Hallgrímsson2010). To explore this issue, we calculated an adjusted coefficient of determination (r 2adj). One thousand bootstrap resamplings for each genus (holding the sample size of the original data and taking into account the sources of undesired variation; Fig. 1; Table 2) were produced. For each resample, the r 2 was calculated. If the correlation between the r 2 and the mean coefficient of variation for all traits was significant (p<0.05), the r 2 was regressed on the mean coefficient of variation. Based on the regression equation for each evolutionary lineage, the r 2adj was calculated at a mean coefficient of variation of 6% (Young et al. Reference Young, Wagner and Hallgrímsson2010; Porto et al. Reference Porto, Shirai, de Oliveira and Marroig2013). This procedure was done solely to evaluate the uncertainty of the r 2 estimates, since there is no biological explanation to support analyzing all evolutionary lineages at the same level of morphological variation (Porto et al. Reference Porto, Shirai, de Oliveira and Marroig2013).
Similarity and Distance Matrices
The phylogenetic distance matrix was differently determined for the different data sets (35D, 32D, 28D, and 25D). For 35D and 32D, for which only extant taxa were considered, the phylogenetic distance between two taxa was the sum of the lengths of the corresponding branches of the adopted phylogeny (Möller-Krull et al. Reference Möller-Krull, Delsuc, Churakov, Marker, Superina, Brosius, Douzery and Schmitz2007). The branch length was the number of substitutions per site along the corresponding branch. For 28D and 25D the same procedure was adopted, but all branches had a length of 1, and the relationship within Folivora was considered a polytomy. For comparative reasons, the same procedure was also adopted for 35D and 32D. So, two phylogenetic distance matrices were estimated for 35D and 32D.
The morphological distance matrix was obtained for all data sets by calculating the squared Mahalanobis distance (D2) between genera:
 $${\bf{D}} ^{\ \ 2} _{{ij}} \,{\equals}\,(\rmu _{i} {\minus}\rmu _{j} )'{\bf{W}} ^{{{\minus}1}} (\rmu _{i} {\minus}\rmu _{j} )$$
where µi and µj are the vector of trait means for the compared taxa, and W is the pooled within-group covariance matrix of all Xenarthra, controlling for the sources of undesired variation (for details see Table 2; Ackermann Reference Ackermann2002). Morphological distances were moderate to weakly correlated with phylogenetic distances (Supplementary Table 2). Residual morphological distances were calculated by linearly regressing the morphological distances as a function of the phylogenetic distances. After a constant was added, the log-transformed residual morphological distance matrix was used in later analyses.
The overall magnitude-of-integration distance matrix was calculated for all data sets as the absolute differences in r 2 for each pair of matrices (Porto et al. Reference Porto, Oliveira, Shirai, Conto and Marroig2009). The structural similarity matrix for all data sets for the covariance and correlation matrices are the results of the RS and KP methods (Marroig and Cheverud Reference Marroig and Cheverud2001). Matrices were compared based on the cross-product of element entries followed by Mantel’s test (15,000 permutations) for assessing statistical significance (Cheverud et al. Reference Cheverud, Wagner and Dow1989).
Statistical Analyses
All analyses were done in the R Environment for Statistical Computing (R Development Core Team 2013) using the EvolQG package (Melo et al. Reference Melo, Garcia, Hubbe, Assis and Marroig2015).
Results
The results presented here are mainly from the analyses of the 25D data set. However, whenever differences in the results between the data sets exist, they are also presented.
Testing the Cheverud Conjecture
The observed similarity among the xenarthran genera covariance matrices were usually above 0.6 for both the RS and KP. The adjusted similarities were usually above 0.7 for the RS and frequently above 0.75 for the KP. In general, observed and adjusted similarities were higher for the correlation matrices than for the covariance matrices (Figs. 3 and 4; Supplementary Tables 3 and 4). The poorly sampled extinct sloths Acratocnus and Neocnus (Fig. 1) presented almost all original and adjusted RS similarities below 0.5. On the other hand, the KP similarities for these taxa showed higher similarities, especially the adjusted ones above 0.7. Besides the results for Acratocnus and Neocnus, adjusted similarities below 0.7 were found mainly for the RS of covariance matrices. These values were more frequent in cases in which one of the two taxa compared was the extinct sloths Paramylodon and Scelidotherium or the anteater Myrmecophaga or the armadillo Priodontes. With the exception of the comparisons involving Acratocnus and Neocnus, all similarities were significant at p<0.01. Most similarities (23 of 28) involving Acratocnus and 8 of 28 comparisons involving Neocnus were significant at p<0.05. Lower RS and KP similarities for both covariance and correlation matrices were usually associated with lower sample sizes from at least one of the matrices under comparison (Supplementary Figs. 1–4).
Structural similarity for the 25D data set between xenarthran genera covariance matrices. Open symbol, individual value; closed symbol, mean value; circle, RS; square, KP.

Structural similarity for the 25D data set between xenarthran genera correlation matrices. Open symbol, individual value; closed symbol, mean value; circle, RS; square, KP.

The adjusted structural similarities between xenarthran genus P matrices and the rodent G and P matrices were usually above 0.6, with several above 0.7 (Table 3). Similarities above 0.5 and below 0.65 were restricted to the RS and most often to the covariance matrices and were related to the armadillos Priodontes and Dasypus, the anteater Myrmecophaga, and the extinct sloth Paramylodon. Similarities below 0.4 were restricted to the RS and the poorly sampled extinct sloths Acratocnus and Neocnus. All similarities were significant at p<0.01, except the ones involving Acratocnus and Neocnus.
Adjusted structural similarity for the covariance and correlation matrices for the 25D data set between the Calomys G and P matrix and the xenarthran P matrices. Bold values were significant at p<0.01.

At the subfamily, family, suborder, and order levels, similar results were found (Supplementary Tables 5 and 6). Observed and adjusted similarities were usually above 0.7 for both KP of covariance and correlation matrices and RS of correlation matrices. Several adjusted similarities for the RS of covariance matrices were below 0.7 and most frequently involved Mylodontinae/dae (Paramylodon), Myrmecophaginae/dae (Tamandua and Myrmecophaga), Folivora (all sloths), and Vermilingua (all anteaters). Similarities based on correlation matrices were regularly higher than on the covariance matrices, especially for the RS. All similarities above the genus level were significant at p<0.01.
Regarding the results obtained with the distinct sets of distances (35D, 32D, 28D, and 25D), conspicuous differences were observed between the 35D and 32D results, but only within taxa that had a markedly increased in sample size (Fig. 1; Supplementary Tables 7–18).
The results obtained using the Bayesian methods were congruent with the results presented above and generally show a pattern of high similarities between matrices (for details see the supplemental material).
Overall Magnitude of Integration
Before presenting the results, it is important to state that r 2 varies considerably with sample size used to estimate the correlation matrix. The r 2 estimated from less than 20–25 specimens is considerably overestimated (Supplementary Fig. 5). Consequently, in these circumstances the r 2 should be considered an upper limit for the population r 2, instead of a good proxy for the real population r 2. For this reason, the r 2 from the poorly sampled extinct sloths Scelidotherium, Acratocnus, and Neocnus were considered upper-limit r 2 estimates.
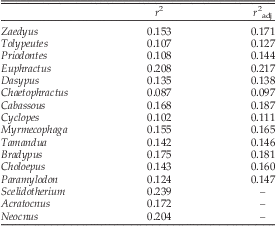
The r 2 values were all below 0.25 and, excluding the three extinct sloths mentioned above, ranged between 0.087 and 0.208 (Table 4). Pearson’s product-moment correlation between r 2 and r 2adj was high at 0.962 (p<0.001). The r 2 across the different sets of distances varied markedly only between 35D and 32D for taxa with considerable variation in sample size (Fig. 1; Supplementary Table 19). One thousand bootstrap resamplings of the general linear model residuals of each genus showed that minor differences in the r 2 are due to sampling, but differences above ~0.1 cannot be explained solely by sampling (Supplementary Fig. 6).
Original (r 2) and adjusted (r 2adj) overall magnitude of integration for the 25D data set of the Xenarthra.
Similarity and Distance Matrices
The results for the phylogenetic distance matrix, determined by considering the number of substitutions per site as the branch length, and the phylogenetic distance matrix, determined by considering all branches as having a length of 1, were virtually the same for the 35D and 32D data sets. For the sake of brevity, we chose to present only the results from the latter.
Structural similarity among xenarthran genus P matrices were correlated with phylogenetic history (Table 5). There was a weak correlation (~0.2) between the RS similarities and the phylogeny and a moderate correlation (~0.6) between KP similarities and phylogeny. The overall magnitude of the integration distance matrix was not correlated with the phylogenetic distance matrix. The log-transformed residual morphological distance matrix obtained by linearly regressing the morphological distances as a function of the phylogenetic distances presented a moderate correlation (~0.6) with the covariance matrix RS observed and adjusted similarities (Table 5). The overall magnitude of integration distance matrix was not correlated with the morphological distance matrix.
Matrix correlation between original and adjusted structural similarity matrix and overall magnitude of integration distance matrix (r 2) and residual morphologic and phylogenetic distance matrices among xenarthran genera for the 25D data set. Bold values were significant at p<0.05. The phylogenetic distance matrix was determined considering all branches having length of 1, and the residual morphological distance matrix was obtained based on this phylogenetic distance matrix.

Regarding the results obtained with the distinct sets of distances (35D, 32D, 28D, and 25D), results were congruent between the data sets but with minor differences in the intensity of the correlations and number of significant correlations (Supplementary Table 20).
Discussion
The Cheverud Conjecture
Xenarthran P matrices are not strictly identical or proportional. To satisfy these conditions, the product between one matrix and the inverse of the other should be a scalar multiple of the identity matrix (see Klingenberg and Monteiro Reference Klingenberg and Monteiro2005). However, two P matrices (or G matrices) will never satisfy this equation (Falconer and MacKay Reference Falconer and MacKay1996; Cheverud and Marroig Reference Cheverud and Marroig2007; Porto et al. Reference Porto, Oliveira, Shirai, Conto and Marroig2009). So, a more pertinent question is not whether the matrices are identical/proportional or not, but rather how much structural similarity is required between G or P matrices so they can be used in macroevolutionary studies (Roff Reference Roff1996, Reference Roff1997; Marroig and Cheverud Reference Marroig and Cheverud2001). There is no consensus among researchers about the minimum amount of structural similarity between G or P matrices needed to perform macroevolutionary studies (Cheverud Reference Cheverud1988; Arnold and Phillips Reference Arnold and Phillips1999; Marroig and Cheverud Reference Marroig and Cheverud2001). However, at least for RS, it has been argued that if there is high (above 0.7) structural similarity between the matrices, their differences will have a small effect over the results of macroevolutionary quantitative genetics studies (Marroig and Cheverud Reference Marroig and Cheverud2001; Prôa et al. Reference Prôa, O’Higgins and Monteiro2012). Furthermore, RS goes to the core of the evolutionary question by assessing whether two G or P matrices have similar evolutionary responses to the same selection gradients (Cheverud and Marroig Reference Cheverud and Marroig2007).
Overall, RS results indicate xenarthran P matrices tend to respond quite similarly to different selection gradients. In fact, xenarthran P matrices have in general high structural similarities (above 0.7), regardless of the taxonomic/phylogenetic level, the method (RS or KP) employed, and the type of matrix (covariance or correlation). Considering the deep evolutionary history of Xenarthra (Delsuc et al. Reference Delsuc, Superina, Tilak, Douzery and Hassanin2012) and the broad phylogenetic context of this study, the high structural similarity among P matrices gives support to the idea that Xenarthra, in general, share a common genetic and developmental basis and, consequently, a common G-matrix structure. In other words, although there are differences in additive genetic variation between any evolutionary lineages (Falconer and MacKay Reference Falconer and MacKay1996; Porto et al. Reference Porto, Oliveira, Shirai, Conto and Marroig2009) and in skull development within Xenarthran evolutionary lineages (Hautier et al. Reference Hautier, Weisbecker, Goswami, Knight, Kardjilov and Asher2011; Rager et al. Reference Rager, Hautier, Forasiepi, Goswami and Sánchez-Villagra2014), those differences do not drastically alter the G-matrix structure. Accordingly, the P matrices are good proxies for their genetic counterparts, and the Cheverud conjecture holds true for this group. Further support to this interpretation is given by the generally high (above 0.7) adjusted similarities observed between xenarthran P matrices and rodent G and P matrices, irrespective of the method and the type of matrix analyzed. The discussion above fits perfectly well with previous findings that mammals in general share similar morphological cranial G- and P-matrices structures, regardless of the analyses being based on traditional morphometric data (Lofsvold Reference Lofsvold1986; Steppan Reference Steppan1997; Marroig and Cheverud Reference Marroig and Cheverud2001; Oliveira et al. Reference Oliveira, Porto and Marroig2009; Porto et al. Reference Porto, Oliveira, Shirai, Conto and Marroig2009; Shirai and Marroig Reference Shirai and Marroig2010; Haber Reference Haber2015) or geometric morphometric data (Goswami Reference Goswami2006, Reference Goswami2007; even though it is not yet well established if there is a clear and direct correspondence between results obtained from both types of data). This relative stability in mammalian G and P matrices is not fully comprehended, but in all likelihood some sort of shared stabilizing selection on the correlation pattern is involved in this large-scale stability (Jones et al. Reference Jones, Arnold and Bürger2003; Melo and Marroig Reference Melo and Marroig2015). This shared stabilizing selection could be generated by similar functions being performed by the same homologous traits between lineages or by shared developmental paths between lineages resulting in similar internal stabilizing selection.
Nevertheless, there are some comparisons involving specific genera (the extinct sloths Acratocnus, Neocnus, Scelidotherium, and Paramylodon; the anteater Myrmecophaga; and the armadillo Priodontes) that did not show high similarities and should be discussed thoroughly. The most notable examples of lower similarities are related to the extinct sloths Acratocnus and Neocnus, which often presented adjusted RS similarities below 0.5. Considering both have poor sample sizes (eight and six specimens, respectively), it is likely these low similarities were to a large extent due to problems in the matrices’ estimation related to sample size (Supplementary Figs. 1–4 and 7; Marroig et al. Reference Marroig, Melo and Garcia2012), rather than differences inherent to their biological systems. The KP results reinforce this hypothesis, since the observed KP similarities involving these taxa were consistently smaller than the similarities involving other taxa (Figs. 3 and 4). Another point in favor of a sample size effect is that the RS similarities involving Cyclopes increased markedly between 35D and 32D, where sample size changed from 12 to 91 (Supplementary Tables 7–10). The armadillo Priodontes and the extinct sloth Scelidotherium also have small samples (24 and 16, respectively) and this probably contributed to some of the RS similarities involving them being below 0.7 (Supplementary Figs. 1–4 and 7; Marroig et al. Reference Marroig, Melo and Garcia2012). In spite of this, it is remarkable that they still have several adjusted similarities above 0.7.
Sampling error cannot be the sole cause for the adjusted RS similarities below 0.7 found in the comparisons involving the extinct sloth Paramylodon and the anteater Myrmecophaga for covariance matrices, since sample sizes for Paramylodon, Myrmecophaga, and all other Xenarthra but Acratocnus, Neocnus, Priodontes, and Scelidotherium ranged between reasonable and good (Fig. 1). Furthermore, sampling error should affect both correlation and covariance matrices in roughly similar ways, so the substantial increase in the RS similarities observed for the correlation matrices in these cases is not justified. The difference in RS similarities between the covariance matrix and the standardized correlation matrix suggests the lower RS similarities observed for the covariance matrices are related to a strong uneven distribution of trait variances (and associated covariances) across P matrices. Most commonly this is related to scale differences. Larger traits tend to present larger variances and smaller traits tend to show smaller variances. The same relationship can be extended to the associated covariances (Cheverud and Marroig Reference Cheverud and Marroig2007). This can be exemplified by the anteater Myrmecophaga, which has a very long rostrum and forehead in comparison with the posterior part of the braincase and therefore has relatively high (co)variances related to the distances that represent these regions (PMZS, PMZI, PMMT, NABR, and NAPNS; Supplementary Table 21). Another source of discrepancy in (co)variance occurs when the location of a landmark varies markedly across specimens within a population. This was only observed for the landmark PT for the extinct sloth Paramylodon. The suture between the frontal and parietal reaches the squamosal in different parts, more anteriorly or posteriorly depending on the specimen. As a consequence, the distances related to PT (BRPT, PTAPET, PTBA, PTEAM, PTTSP, and PTAS) have relatively large (co)variances, especially PTTSP (Supplementary Table 22).
In circumstances such as the ones described above, where some traits present considerably more (co)variation than others, the traits with more variation will correspond to axes of major variation in the multidimensional space and, consequently, will be highly correlated with the first PC (Krzanowski Reference Krzanowski2000). After the first PC, the other PCs can be interpreted as successive orthogonal axes of major variation. Knowing the PCs is relevant, because their direction (i.e., eigenvectors) and variance (i.e., eigenvalues) may bias changes in mean phenotypes, especially the first PC, because it encompasses most of the available variation (Schluter Reference Schluter1996; Marroig and Cheverud Reference Marroig and Cheverud2005, Reference Marroig and Cheverud2010; Hansen and Voje Reference Hansen and Voje2011). Moreover, RS similarities are expected to be relatively low if the directions and/or the variances of the PCs are markedly different between the evolutionary lineages being compared. On the one hand, KP similarities show all Xenarthra share closely related subspaces. Additionally, the RS similarities for the correlation matrices—which have variance-standardized covariances—and for the reasonably/well-sampled taxa suggest Xenarthra have similar association patterns between traits. On the other hand, when we consider the covariance matrices for the reasonably/well-sampled taxa, the RS similarities indicate the PCs differ across some taxa in their direction/order of relevance or the amount of variance explained by them or both. For the extinct sloth Paramylodon and anteater Myrmecophaga covariance P matrices, few traits dominate the evolutionary response, because these traits present considerably higher variation. Evolutionary responses for these genera will always be biased by these few traits in relation to the others, exerting a strong attractor effect over the evolutionary-response vector. Consequently, they will diverge more often from other evolutionary lineages, and we now focus on the specific reasons for this divergence.
The discussion below refers to the results for covariance matrices, unless otherwise stated. Generally the first PC in skull data of mammals is size related both for covariance and correlation P matrices (Porto et al. Reference Porto, Shirai, de Oliveira and Marroig2013), and the only exception within Xenarthra is the extinct sloth Paramylodon, which has the second PC as size-related. The first PC for this genus is a contrast between the distance PTTSP and the distances BRPT, PTAPET, PTBA, PTEAM, and PTAS (Supplementary Table 23; notice this condition applies only for the covariance matrix, since the first PC for the correlation matrix is size related). The mean correlation of the Paramylodon’s first PC with the others is 0.47 (SD=0.1; minimum=0.28; maximum=0.65), while the mean correlation of the first PC of all Xenarthra but Paramylodon is 0.83 (SD=0.09; minimum=0.49; maximum=0.96; Supplementary Table 24). Thus, Paramylodon’s first PC in general has a different direction than the first PC from the other genera. This is a major reason why this genus has the largest number of adjusted RS similarities below 0.7 (not considering the results for Acratocnus and Neocnus). In fact, if the distance PTTSP is removed from the analysis, the first PC for Paramylodon also becomes size related, and the adjusted RS similarities involving this genus increase for several comparisons (Supplementary Table 25). This interpretation is reinforced when we compare the results involving this genus for the covariance and correlation matrices. Results for correlation matrices are considerably higher, since in this case Paramylodon’s first PC is, as for the other Xenarthra, size related. Myrmecophaga has a strong allometric first PC, which is mainly represented by the distances representing the length of the rostrum and forehead (PMZS, PMZI, PMMT, NABR, and NAPNS; Supplementary Table 23). The correlations of its first PC with those of the other taxa, excluding Paramylodon, are fairly high (mean=0.78; SD=0.13; minimum=0.49; maximum=0.96; Supplementary Table 24). Moreover, the first PC explains 66.7% of the total variance, the biggest apportioned variance explained by the first PC across Xenarthra (Supplementary Table 23). Thus, we hypothesized that although the direction of the first PC between Myrmecophaga and other Xenarthra is similar, the evolutionary responses will be more severely biased by the first PC in Myrmecophaga, and this bias is an important reason why this genus has several adjusted RS similarities below 0.7. To test our hypothesis, three covariance matrices (C1, C2, and C3) were constructed using the following equation:
 $${\bf C}\,{\equals}\,{\bf V}^{{\rm t}} \,{\bf \Lambda }\,{\bf V}$$
where C is a covariance matrix, V is a square matrix of normalized eigenvectors, Λ is a square diagonal matrix of eigenvalues, and the superscript t denotes matrix transpose. All Cs have the same eigenvectors as Myrmecophaga (i.e., V is the normalized eigenvector matrix from Myrmecophaga’s P matrix). C1 has the eigenvalues from Dasypus’s P matrix, C2 has the eigenvalues from Tamandua’s P matrix, and C3 has the eigenvalues from Bradypus’s P matrix. Therefore, Myrmecophaga’s P matrix, C1, C2, and C3 have the same directions for the PCs but different total amounts of variation, and variances explained by each PC. Note, however, the RS is not influenced by differences in total amount of variation, since it compares selection responses for both matrices by their directions, which only depend on the relative variation between eigenvalues, and is not influenced by their norm, which depends on total variation. The adjusted RS similarities comparing the Cs and the Xenarthra matrices were determined and, regardless of the C, were most often higher than the comparisons involving Myrmecophaga (Supplementary Table 26), suggesting the apportioned variance explained by the first PC contributes to the results observed in the RS similarities involving Myrmecophaga. However, the Myrmecophaga and Cs matrices show relatively low similarities with the sloths’ matrices, suggesting in these cases not only the variance but also the direction of the first PC is a major contributor to the lower similarities.
This discussion is congruent with the results found at the subfamily, family, suborder, and order levels.
Overall Magnitude of Integration
If compared to the theoretical maximum of 1, the overall magnitude of integration found across Xenarthra is low, since these values ranged between 0.09 and 0.24. However, the empirical distribution for a broad range of mammalian taxa suggests this statistic ranges between 0.04 and 0.6 (Oliveira et al. Reference Oliveira, Porto and Marroig2009; Porto et al. Reference Porto, Oliveira, Shirai, Conto and Marroig2009; Shirai and Marroig Reference Shirai and Marroig2010), at least when using linear distances. Although magnitude of integration statistics based on geometric morphometrics are available (e.g., Goswami et al. Reference Goswami, Smaers, Soligo and Polly2014), it is not yet clear whether these measurements of integration on linear distances and geometric morphometrics are directly comparable. Thus, xenarthran r 2 can be considered to be between low and moderate; the fossils analyzed are no exception, since Paramylodon had r 2=0.124, and the other extinct taxa had r 2 below 0.239. More important than the values by themselves is the marked variation of the overall magnitude of integration across Xenarthra, with some genera having values around twice as big as others. Besides minor differences in the structure of the P matrices, differences in the overall magnitude of integration help to illuminate the huge morphological diversity observed across extant and extinct Xenarthra. Even matrices that share exactly the same structure may respond in different directions to the same selection gradients if they have markedly distinct overall magnitudes of integration (Marroig et al. Reference Marroig, Shirai, Porto, de Oliveira and De Conto2009; Porto et al. Reference Porto, Oliveira, Shirai, Conto and Marroig2009). A high r 2 usually means traits are tightly correlated. As a result, the morphospace is restricted to one or few dimensions, and in turn, the responses to selection will be usually constrained by these few dimensions (i.e., only a few directions in the morphospace have variation for change). The opposite is true for a low r 2, which will show weak intertrait associations and a morphospace represented by more dimensions (Lande Reference Lande1979; Hansen and Houle Reference Hansen and Houle2008; Pavlicev et al. Reference Pavlicev, Cheverud and Wagner2009; Shirai and Marroig Reference Shirai and Marroig2010). Consequently, responses to selection will often be less constrained. Therefore, it is expected that genera such as the armadillo Euphractus and the sloth Bradypus will tend to be more constrained in their responses to selection than the armadillo Chaetophractus and the anteater Cyclopes, at least on a microevolutionary timescale. However, further analyses with appropriate statistics (Hansen and Houle Reference Hansen and Houle2008), which effectively measure how the G or P matrix influences evolution, are required to properly explore this issue.
Similarity and Distance Matrices
There is a weak to moderate association between phylogenetic relationships and P-matrix structure maintenance. KP similarity matrices were moderately correlated with the phylogenetic distance, suggesting morphological subspaces between closely related taxa are more aligned than between phylogenetically distant taxa. In contrast, RS similarity matrices were only weakly correlated with the phylogenetic distances, suggesting there is only a small tendency for closely related taxa to have more similar evolutionary responses to the same selection gradients than do phylogenetically distant taxa. The log-transformed residual morphological distance matrix (obtained by the linear regression of the morphological distances as a function of the phylogenetic distances) was moderately correlated only with the RS similarities for the covariance matrices, suggesting differences in trait means have a limited influence over the similarity of the P matrices. The overall magnitude of integration distance matrix was not correlated with both the phylogenetic distance and the log-transformed residual morphological distance matrices, suggesting changes in overall magnitude of integration are to some extent not associated with phylogeny or morphological changes in character means.
Implications and Applications for Paleontology
All the above discussions are important to guide evolutionary quantitative genetics analyses involving extinct lineages. We will first discuss biological and methodological reasons that may contribute to the observed structural differences in G or P matrices and then, later in this section, we will address when extant taxa G or P matrices may be used as surrogates for the extinct taxa G or P matrices.
The first concern is related to the ratio between sample size and number of traits (S/T). In order to estimate a covariance matrix, S/T should be above 1, otherwise the estimated matrix will not be a proper covariance matrix (i.e., it will not be a positive-definite matrix), and this may impose several limitations on further analyses (e.g., Lande and Arnold Reference Lande and Arnold1983; Marroig et al. Reference Marroig, Melo and Garcia2012). Yet, when S/T is below 1 it is still possible to estimate a matrix, but as shown for the extinct sloths Acratocnus and Neocnus, matrices estimated from small samples may present unreliable results in some circumstances, since error will dominate the matrix estimation (Marroig et al. Reference Marroig, Melo and Garcia2012). In these cases, results should be carefully scrutinized to determine whether they are biologically meaningful. This unreliability does not mean poorly estimated P matrices should not be determined, since they can be informative to some extent despite the estimate error. The adjusted KP similarities, for example, showed that those subsampled genera share an aligned morphological subspace with other Xenarthra. It is also possible to determine a maximum overall magnitude of integration for these cases (Supplementary Fig. 5). The usual recommendation is to maximize S/T whenever possible, so the influence of error in matrix estimation is minimized (Sokal and Rolhf Reference Sokal and Rolhf1995), and the researcher should carefully consider the trade-off between sample size and number of traits. The relevance of error in matrix estimation is also conditioned by the eigenvalue distribution. Given a specified number of traits, when most of the total variation is explained by the first PCs, fewer specimens will be needed to reasonably estimate a matrix, while when the total variation is more evenly distributed across the eigenvalues, more specimens will be needed to reasonably estimate a matrix (Supplementary Fig. 7).
Other works dealing with mammalian skulls found that around 15 specimens should be enough to reasonably estimate a matrix, at least in the S/T below 1 situation (Goswami Reference Goswami2006; Goswami and Polly Reference Goswami and Polly2010). We agree with Goswami and Polly (Reference Goswami and Polly2010) in that this value should not be generalized indiscriminately to other situations. On this topic, we would like to comment on two points. First, as shown above, matrix estimation accuracy depends on the number of traits and on the eigenvalue distribution of the matrix (Supplementary Figs. 5 and 7), thus different studies and populations may require more or fewer specimens to reasonably estimate a matrix. Second, assessment of the quality of the matrix estimation will be different depending on the type of matrix (covariance or correlation) and on the matrix comparison method (e.g., matrix correlation, RS, or KP). For instance, we based our discussion on the covariance matrix and on the RS and KP, while Goswami (Reference Goswami2006) and Goswami and Polly (Reference Goswami and Polly2010) based their discussions on matrix correlation of correlation matrices, and this difference in methodology leads to different similarity values that are not directly comparable.
Regarding the number of traits, the analyses with the distinct sets of distances (35D, 32D, 28D, and 25D) showed that changing the number of traits does not necessarily change the results. Between 25D and 35D, 10 traits were added into the analyses, and no noticeable differences were observed in the results when sample sizes where constant across the distance sets. Our results are congruent with the findings of a recent study that used two distinct data sets, one with 107 interlandmark distances and another with 32 interlandmark distances (Haber Reference Haber2015). Yet in some particular cases, removing only one trait (or a few) from the analyses may considerably change the results, as was the case when the PTTSP distance was removed from the covariance analyses and Paramylodon’s covariance P matrix consequently became more similar to that of other Xenarthra.
There are at least three (co)variation and correlation particularities of traits that may more intensely affect the structural similarity of evolutionary lineages’ matrices, and one should be aware of them. The first two cause strong, uneven distribution of trait variances and associated covariances: (1) the presence of some disproportionately large traits, as observed for the anteater Myrmecophaga, and (2) some traits varying markedly due to differences in landmark locations across specimens within a population, as is the case for the distances involving the landmark PT in the extinct sloth Paramylodon. As a result, in both cases relatively high variances and covariances will be associated with these traits, and these will exert an attractor effect over the evolutionary-response vector, diminishing the similarity of the evolutionary-response vector between these taxa and other evolutionary lineages. The same principle holds true for some disproportionately small traits, and this concern applies primarily to covariance matrices. The third element, which is relevant to both covariance and correlation matrices, is the pattern of association between traits. Theoretically, traits may have different patterns of association in different lineages (e.g., population A has a strong positive association between traits 1 and 2, while population B has a strong negative association), and this difference in patterns will have an impact in the similarity between matrices if several traits have different patterns of association between lineages. Thus, when considering fossils, researchers should evaluate whether they might encounter one or more of these trait particularities in the analyses. Phylogenetic proximity and morphological similarity may also contribute to the resemblance between structure of P matrices and overall magnitude of integration (Marroig and Cheverud Reference Marroig and Cheverud2001; Goswami Reference Goswami2006; Oliveira et al. Reference Oliveira, Porto and Marroig2009; Porto et al. Reference Porto, Oliveira, Shirai, Conto and Marroig2009; Haber Reference Haber2015).
Another point of concern are the properties of the G or P matrices that are of interest for a particular study. The covariance matrix represents each trait’s variation and the between-trait intensity and pattern of association, while the correlation matrix represents only the latter (Pavlicev et al. Reference Pavlicev, Cheverud and Wagner2009). Most often, evolutionary studies rely on the information available in the covariance matrix (Hansen and Houle Reference Hansen and Houle2008), but in some circumstances analyzing the correlation matrix may be more relevant (Pavlicev et al. Reference Pavlicev, Cheverud and Wagner2009). As an example of the impact of the two different matrices in evolutionary studies, take the RS similarities involving the extinct sloth Paramylodon. Considering only the variance-standardized covariances (i.e., correlation matrix) Paramylodon responds very similarly to other evolutionary lineages to random-selection vectors (mean adjusted RS similarities excluding Acratocnus and Neocnus is 0.78; SD=0.03), whereas if the variation for each trait is considered (i.e., covariance matrix), responses are far less aligned with other lineages (mean adjusted RS similarities, excluding Acratocnus and Neocnus, is 0.61; SD=0.07). Also, depending on the particularities of the methods used to compare matrices, even the comparison between the same matrices may show different results. The contrast between the results produced by the RS and KP methods can be exemplified again by the results involving Paramylodon’s covariance matrix. While the RS similarities involving this lineage indicate its responses to random-selection vectors are not strongly aligned with the responses from other lineages, the KP similarities show it shares a closely related morphological subspace with other lineages.
Now, the critical question to be answered is: When is it safe to use G or P matrices of extant lineages as surrogates for the G or P matrices of subsampled extinct lineages in evolutionary quantitative genetics analyses? There is good overall evidence that therian mammals in general share a common genetic and phenotypic structure of variation and covariation (Lofsvold Reference Lofsvold1986; Steppan Reference Steppan1997; Marroig and Cheverud Reference Marroig and Cheverud2001; Goswami Reference Goswami2006, Reference Goswami2007; Oliveira et al. Reference Oliveira, Porto and Marroig2009; Porto et al. Reference Porto, Oliveira, Shirai, Conto and Marroig2009; Shirai and Marroig Reference Shirai and Marroig2010; Haber Reference Haber2015), and the results for the Xenarthra are in line with this idea. This study and Haber (Reference Haber2015) also show this conclusion holds for different sets of distances. Therefore, for the therian mammals it is likely any given extant G or P matrix will suit well as a surrogate for extinct lineages. A conservative approach might be to select closely related phylogenetic or morphologically similar extant lineages as surrogates, since they may present more similar G or P matrices.
Nevertheless, special attention should be paid to extinct lineages showing either some disproportionately large (or small) traits or some traits varying markedly due to differences in the location of landmarks across specimens within a population. If the researcher suspects one of these two conditions applies to some traits of the lineage of interest, caution is required in the study of the covariance matrix and how it influences responses to selection. This concern is far less important if one is studying the properties expressed by the correlation matrix or if one is interested in the morphological subspace orientation. Also, attention should be paid to a trait’s patterns of association in different lineages, since differences in these patterns may severely decrease similarities between covariance/correlation matrices. Unless an extant lineage with similar trait characteristics is known, there will not be a good extant surrogate. In these cases, the best option would be to run the analyses with some G or P matrices from extant lineages that have relatively different structures and evaluate whether these matrices bias the results or not. Indeed, using different extant matrices as surrogates may be an appropriate standard approach, since it takes into account the uncertainties related to the unknown G or P matrices of extinct lineages (e.g., Ackermann and Cheverud Reference Ackermann and Cheverud2004). It is important to stress how a deep understanding of the methods used and the potential sources of variation is required to properly use extant G or P matrices as surrogates for the extinct ones.
Conclusions
The extant and extinct Xenarthra have similar P-matrix subspaces, as measured by the KP, and for taxa with at least adequate samples they tend to respond to selection gradients in similar ways. Two exceptions are the anteater Myrmecophaga and the extinct sloth Paramylodon, which have systematically lower adjusted RS similarities for the covariance matrices. In the case of Myrmecophaga, it is due to relatively minor differences in the PC directions and differences in the allocation of total variance in the first PC, which are consequences of the long rostrum and forehead in relation to the rest of the skull. In the case of Paramylodon, it is by virtue of a relatively intense departure of its first PC direction in relation to the other Xenarthra associated with differences in the position of the landmark PT among specimens. Xenarthran P matrices can be used as surrogates for their G matrices and, in general, extant taxa P matrices are good surrogates for extinct taxa G or P matrices. Nevertheless, the question of when it is reasonable to use extant G or P matrices as surrogates to extinct ones is not a trivial one with a straightforward answer. Guidelines were provided, and special attention is advised for traits that are either disproportionately large (or small) in relation to the other traits, or that are determined by at least one landmark that varies markedly within a population, or that have different patterns of association in different lineages.
Acknowledgments
The authors are thankful to people and institutions who provided generous help and/or access to collections: J. Galkin, R. Voss, and E. Westwig (American Museum of Natural History); M. Flannery and A. Goode (California Academy of Science); R. Fariña, D. Hernández, and A. Rojas (Faculdad de Ciencias de la Universidad de la Republica); B. Patterson, W. Simpson, and S. Ware (Field Museum of Natural History); S. Aguiar and J. Ohana (Museu Paraense Emílio Goeldi); M. Thompson (Idaho Museum of Natural History); J. Dines and X. Wang (Los Angeles County Museum); A. Farrell and J. Harris (La Brea Tar Pits and Museum); D. Flores and A. Kramarz (Museo Argentino de Ciencias Naturales); C. Cartelle, A. Vasconcelos, and L. Vilaboim (Museu de Ciências Naturais da Pontifícia Universidade Católica de Minas Gerais); T. Aguzzoli and D. Sanfelice (Museu de Ciências Naturais da Fundação Zoobotânica do Rio Grande do Sul); I. Olivares and M. Reguero (Museo de La Plata); S. Bermudez (Museo Paleontológico de Colonia del Sacramento); E. Gonzalez, A. Rinderknecht, and V. Scarabino (Museu Nacional de Historia Natural de Montevideo); S. Franco and J. A. de Oliveira (Museu Nacional); C. Conroy, E. Lacey, and J. Patton (University of California Museum of Vertebrate Zoology); A. Currant, P. Jenkins, and L. Tomsett (Natural History Museum); A. Barnosky and P. Holroyd (University of California Museum of Paleontology); K. Finn, R. Hulbert, B. MacFadden, C. McCaffery, and D. Reed (Florida Museum of Natural History); M. Brett-Surman, L. Gordon, and D. Lunde (Smithsonian National Museum of Natural History); J. Gualda, F. Nascimento, and M. de Vivo (Museu de Zoologia da Universidade de São Paulo); and P. Auricchio (Universidade Federal do Piauí). We are deeply indebted to Fábio Machado, Daniela Rossoni, Mark Hubbe, Lionel Hautier, P. David Polly, Anjali Goswami, and Jonathan Bloch for their insightful comments on a previous draft of this manuscript, to Nadia de Moraes-Barros for assisting with Bradypus species identification; and to Mary Safford Curioli for her editorial suggestions, which greatly improved the quality of our manuscript. This research was supported by grants and fellowships from Fundação de Amparo à Pesquisa do Estado de São Paulo (AH 2012/24937-9; DM 2014/26262-4; GM 2011/14295-7), Coordenadoria de Aperfeiçoamento de Pessoal de Nível Superior, and the Field Museum of Natural History.
Supplementary Material
Supplemental materials deposited at Dryad: doi:10.5061/dryad.6br16



