The forecasting of presidential-election outcomes using vote-function models is a relatively recent field of investigation in France, mainly because the election of the French president by universal suffrage only dates back to 1965. Another reason is the extended length of the French presidential term (i.e., seven years until 2002, then five years). Thus, for a long time, performing econometric tests to forecast French elections was simply not possible.
Initially, to increase the limited number of observations in vote-function models, Jérôme and Jérôme-Speziari (Reference Jérôme and Jérôme-Speziari2001) developed a regional panel data model. This model then was enhanced with a National Front vote function and provided forecasts until 2017 (e.g., Jérôme and Jérôme-Speziari Reference Jérôme and Jérôme-Speziari2003; see also Foucault and Nadeau Reference Foucault and Nadeau2012).
Looking ahead to the 2022 French presidential election, we followed in this regional-level modeling tradition and proposed a forecasting model that first aimed to put forward the political-economic dynamics of the 13 new large metropolitan regions (Jérôme-Speziari and Bélanger Reference Jérôme-Speziari and Bélanger2022).Footnote 1 Our effort integrated the changes resulting from the upheaval in Right–Left partisan logic in 2017 and the election of Emmanuel Macron, which involved resorting to seemingly unrelated regression (SUR) modeling. This approach enabled us to provide a forecast of the first-round regional support in the 2022 election, simultaneously for each of the five main party groups (i.e., Incumbent, Main Opposition, Challengers, Diverse Right, and Far Right). These estimates, based on regional economic and popularity data for 1974–2017, suggested a victory for Emmanuel Macron against Marine Le Pen (National Rally, or RN) or Valérie Pécresse (Les Républicains, or LR) as the most likely outcome of the 2022 election.Footnote 2
DEVELOPING A REGIONALIZED FORECAST MODEL
Increasing the number of degrees of freedom is not the sole objective of a regionalized or state-based model. It also is a way to understand the political-economic dynamics of territories. Indeed, the presidential vote in France has a territorial component that should not be neglected. If economic and social conditions affect voting behavior in a given region, then national-level forecasting can be improved through a vote function that relies on disaggregated data. It is noteworthy that some regions are anchored ideologically in the long term, which does not exclude changes in trajectory. This may be due to a change in national and/or local economic conditions (e.g., measured by the unemployment rate or its variation), which also may lead to the residential mobility of some voters.
Furthermore, some regions have been shown to be ideologically stable since 1974 (i.e., Auvergne-Rhône-Alpes, Grand-Est, and Corsica on the Right; Hauts-de-France, Nouvelle-Aquitaine, and Occitanie on the Left). Others are more unstable (i.e., Bourgogne-Franche-Comté, Bretagne, and Normandie). Still other regions appear to be quasi-stable (i.e., Centre-Val-de-Loire, Pays-de-la-Loire, and Provence-Alpes-Côte d’Azur on the Right; Ile-de-France on the Left).
The inclusion of regional ideological trajectories in our forecasting model was inspired by work showing that French voters typically give more weight to their ideological than to their partisan identification when making their electoral choices (Lewis-Beck, Nadeau, and Bélanger Reference Lewis-Beck, Nadeau and Bélanger2012). Thus, the weight of the regional electoral strongholds for each political family should be a significant explanatory determinant of the vote in the first or second round.
The Pays-de-la-Loire, Ile-de-France, and Corsica regions are Conservative strongholds, from Union of Democrats for the Republic (UDR) to LR. The Auvergne-Rhône-Alpes, Bretagne, Centre-Val-de-Loire, Grand Est, Normandie, and Pays-de-la-Loire regions are areas of Centrist strength, from Union for French Democracy (UDF) to Macron. Ile-de-France is a Conservative stronghold, but the Left has won the presidential election there four of six times.
The RN (formerly the National Front) has a strong base in Grand Est, Occitanie, and Provence-Alpes-Côte d’Azur and to a lesser extent in Bourgogne-Franche-Comté, Centre-Val-de-Loire, and Hauts-de-France. Finally, the Diverse Right historically is stronger in Centre-Val-de-Loire, Bourgogne-Franche-Comté, and Pays-de-la-Loire (i.e., the stronghold of Philippe de Villiers).
Since the electoral calendar inversion in 2002, legislative elections undoubtedly became presidential-confirmation elections to the extent that they take place immediately after presidential elections. Nevertheless, we hypothesized that the ideological trajectory of political families can be determined by the legislative elections preceding the presidential election since 1974. Indeed, they are the last national benchmark elections before the presidential election, thereby indicating how the regional electoral base may be replicated from one election to the next. For example, in 2022, the Socialist Party (PS) and LR could partially recover their respective 2017 legislative scores.
In addition to regionalized variables, we considered the popularity of the outgoing president, or the prime minister under cohabitation, as an indicator of political and economic credibility. Despite a lack of regional popularity data, we reasonably assumed that in each region, voters pay attention to the same “national” popularity figures broadcast by the media (i.e., Institut Français d’Opinion Publique–Journal du Dimanche, or IFOP–JDD).
THE MODEL’S EQUATIONS
To predict the 2022 election, our regionalized model—improved incrementally since 2001—needed to be adapted. Thus, the breaking of the bipartisan Right–Left balance initiated by Macron’s “central-bloc” strategy in 2017 led us to revise the structure and number of our equations. The emergence of Macron and La République en Marche (LREM) had, among others, the following two effects:
-
• the “quadripolarization” of political forces (Conservative–Centrist–Left lato sensu–Far Right)
-
• the resurgence of the rivalry between Conservatives and Centrists: the two families were allies from 1974 to 1997 but they were diverging from 1965 to 1969; then, from 2002 to the present, since Bayrou (UDF, then MoDem) refused to join Chirac’s Union for a Popular Movement (UMP); Bayrou is now a partner of Macron
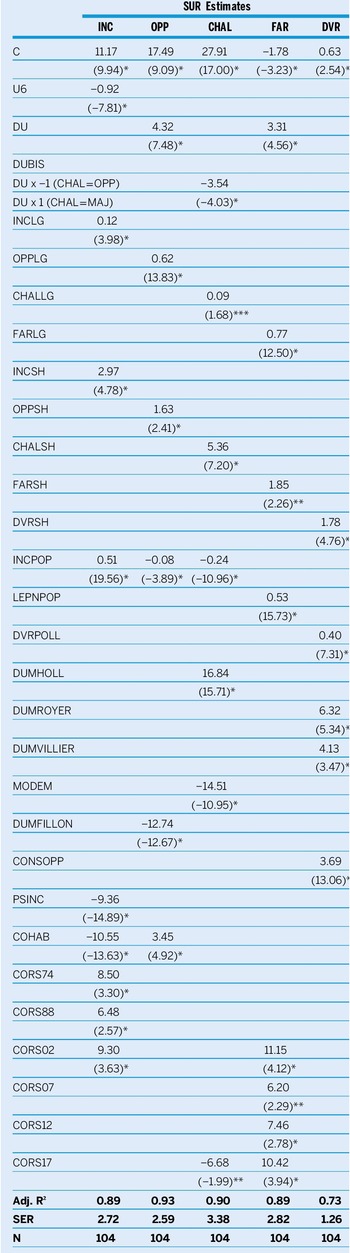
This led us to adjust our initial model by using the methodology proposed by Jérôme, Jérôme-Speziari, and Lewis-Beck (Reference Jérôme, Jérôme-Speziari and Lewis-Beck2017) to model the German multipartisan case using a system of SUR equations. The use of the SUR method is helpful because the determinants of voting for one candidate (or party family) also may determine the vote for the other candidates. In more technical terms, each vote equation’s error term is partly dependent on the error term of the other equations, and SUR allows correction for this interdependence (see the online appendix for more details). We thus specified five SUR equations (table 1) representing the candidates (and their political families) competing in 2022,Footnote 3 which provides a forecast for each candidate. Our model covers the period 1974–2017, encompassing the 13 new metropolitan regions (N=104).
2022 French Presidential Election (First Round)

Note: Student’s t (two-tailed): significant at the 1% (*), 5% (**), and 10% (***) levels. SER: Standard Error of Regression
The first equation involves the party supporting the outgoing president or cohabiting prime minister (INC). We considered the Conservatives as the incumbents in 1974, 1988, 2007, and 2012; the Socialists and Diverse Left in 2002 and 2017; and the Centrists in 1981, 1995, and 2022 (for forecasting).Footnote 4 They faced the “natural” opposition (OPP), our second equation. The opposition was formed by the Total Left from 1974 to 1995, from 2007 to 2012, and then 2022 (forecasted); the Conservatives along with the Center in 2002; followed by the Conservatives in 2017. The incumbents competed with their challengers (CHAL) within the same camp, our third equation. The Center in 1974, 1988, 2007, and 2012 was considered the challenger to the incumbent’s party; the Conservatives in 1981, 1995, and 2022 (forecasted); the Non-Socialist Left in 2002; and the Non-Socialist Left plus the Center in 2017.Footnote 5 The final two equations are concerned with the Diverse Right (DVR) present in 1974 and from 1995 to 2022 (forecasted);Footnote 6 and with the Far Right (FAR) present with Jean-Marie Le Pen in 1974 and then from 1988 to 2007; and Marine Le Pen from 2012 to 2022 (forecasted).
The incumbent vote (INC) is explained by the regional unemployment rate in December preceding the election (U6), which was expected to have a negative sign; past legislative elections (INCLG); an index measuring regional strongholds (INCSH)Footnote 7; and the incumbent’s popularity in the quarter before the election (INCPOP).Footnote 8 The more popular the incumbent is, the more votes he or she gains. In addition, prime ministers can incur the cost of cohabitation (COHAB), coded 1 (0 otherwise). Finally, we included a dummy variable coded 1 (0 otherwise) when the PS is incumbent and three dummy variables for Corsica (i.e., 1974, 1988, and 2002), which often is the source of outlier patterns.
The opposition vote (OPP) is explained by the variation in unemployment from December t-1 to December t-2 (DU), from which it can expect to gain support when positive; past legislative elections (OPPLG); its electoral strongholds (OPPSH); and the incumbent’s popularity, which should affect its support negatively. The opposition also is expected to benefit from cohabitation (COHAB). A dummy variable coded 1 (0 otherwise) also is added, which measures the electoral cost of the Fillon case for the Conservatives in 2017.
Support for incumbent’s party challengers (CHAL) should be affected by changes in unemployment (DUBIS).Footnote 9 It also should be explained by past legislative elections (CHALLG), strongholds (CHALSH), and the negative impact of the incumbent’s popularity (INCPOP). This equation also accounts for the electoral boost to challengers (including Macron) that resulted from the defection of François Hollande (DUMHOLL) in 2017 and for the negative impact for the Centrist challenger in 2012, when Bayrou sacrificed the UDF to create the MoDem (MODEM).
The vote for the Diverse Right (DVR) is explained by its strongholds (DVRSH) and vote intentions in the first quarter before the election (DVRPOLL). The Diverse Right-Wingers also benefit from the presence of the Conservatives in the opposition (CONSOPP). A dummy variable (DUMROYER) was added to isolate the stronghold of Jean Royer in 1974 (i.e., Centre-Val-de-Loire) and Philippe de Villiers’s stronghold in 1995 (i.e., Pays-de-la-Loire).
The Far Right (FAR) vote function is consistent with the economic-voting hypothesis: a positive change in unemployment (DU) favors the RN (or the FN). The FAR variable also is explained by its electoral strongholds (FARSH) and past legislative results (FARLG). Also, a one-point increase in the popularity (Sofres-Kantar) of the RN (or FN) candidate results in a 0.53-point premium for him or her. Four dummy variables were introduced to isolate Corsica (i.e., 2002, 2007, 2012, and 2017).
EQUATION RESULTS AND FORECAST ESTIMATES
The SUR regressions’ results are presented in table 1. The statistical results are satisfactory, and all of the coefficients are significant at the 1% level (i.e., student’s t-statistics two-tailed)Footnote 10 with the expected signs. The standard errors of the regressions vary between 1.26 (DVR) and 3.38 (CHAL).
The regressions’ coefficients now could be used to generate the regionalized forecasts for the first round of the 2022 presidential election. They subsequently could be aggregated to estimate the national scores. The data used for the forecast are as follows:
-
• The level of the regional unemployment rate and its annual variation were from the most recent statistics available from the National Institute of Statistics and Economic Studies (September 2021).
-
• Partisan stronghold indices were calculated by the authors (see note 8).
-
• Macron’s popularity was set at 40% (IFOP–JDD, December 2021).
-
• Le Pen’s popularity was 23% (Sofres-Kantar-One Point, December 2021).
-
• The lagged legislative scores were aggregated by the authors and regionalized.
-
• The voting intentions used for the Diverse Right-Wing candidates (Zemmour+Dupont-Aignan+Asselineau+Lassalle) were 17% (average December 2021 polls).
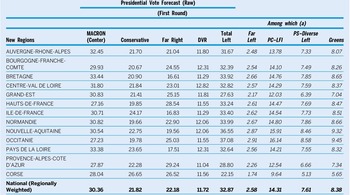
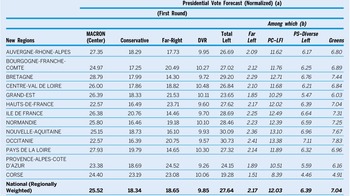
The regionalized forecasts in table 2a (i.e., raw forecasts) and table 2b (i.e., normalized forecasts) placed the Left bloc ahead of Macron, Le Pen, and the Conservative candidate (i.e., Pécresse, nominated by LR members on December 4, 2021). However, the Left bloc was extremely fragmented and none of its candidates seemed able to reach the second round. Precisely, the Total Left would gather 27.64% of the vote share (see table 2b, normalized data): Mélenchon (LFI; 12.03%), Hidalgo (PS; 6.39%), and Jadot (Greens; 7.04%) (see calculations in tables 2a and 2b). For his part, Macron seemed assured of qualifying to the second round (25.52%); however, Le Pen (18.65%) and Pécresse (18.34%) were close for second place, with both estimates within the model’s margin of error.
2022 French Presidential Election

Notes: (a) In December 2021, the Total Left score was 25.5% in the polls on average (Far Left=2%; PC–LFI=11.1%; Greens=6.5%; PS and Diverse Left=5.9%).
From this 25.5%, we calculated the relative electoral weight of each party in the Total Left reported to 100: (Far Left=7.84%; PC–LFI=43.53%;
Greens=25.49%; PS and Diverse Left=23.14%).
Note: Starting from the predicted score for the Total Left in a region i and applying the weights, we estimated the score of each component.
Example: PS score in Auvergne-Rhône-Alpes: 31.67 x (23.14/100)=7.33
2022 French Presidential Election

Notes: (a) Normalized scores calculation: the total votes predicted by the SUR model for each candidate or party are greater than 100.
Then, the scores were normalized so that their sum is 100.
Example: Conservative score in Auvergne-Rhône-Alpes.
(Raw forecast for a party in a region i/100) x raw forecast sum of all of the parties=(21.7*100)/118.66=18.29.
(b) Same calculations as in table 2a.
The complex question of predicting the second round remained, whether it was Macron versus Le Pen or Macron versus Pécresse. We were in unknown territory because we were no longer in the classic model of opposition between the Left and the Right in the second round. Based on existing data, however, we tried to predict the score of a right-wing or RN candidate in the second round—the score of Macron being deduced by default.
To model a Macron–Le Pen duel, we estimated a simple equation (equation 1) in which the score of the RN–FN in the second round in 2002 and 2017 (RN2) was a function of the voting intentions for the Far Right leader in the second round against Chirac or Macron (POLEPEN), RN–FN regional strongholds in the second round (RNSHT2) (see the online appendix), and a dummy variable for Corsica in 2017 (CORS17).
 $$ {\displaystyle \begin{array}{l}{\mathbf{RN}}_2=-9.29+1.038\times \mathbf{POLEPEN}+10.10\times {\mathbf{RN}\mathbf{SHT}}_2\\ {}\hskip5.4em {\left(-2.98\right)}^{\ast }{(10.48)}^{\ast}\hskip8em {(6.11)}^{\ast}\\ {}\hskip5.5em +\hskip0.2em 8.25\times {\mathbf{CORS}}_{17}\\ {}\hskip5.4em {(1.96)}^{\ast \ast}\\ {}\mathrm{Adj}.\mathrm{R}{}^2=0.87\hskip3.5em \mathrm{SER}=3.95\hskip3.5em \mathrm{N}=26\\ {}\mathrm{Student}'\mathrm{s}\hskip0.8em \mathrm{t}\;\left(\mathrm{two}\hbox{-} \mathrm{tailed}\right)\hskip-0.2em :\mathrm{significant}\hskip0.5em \mathrm{at}\hskip0.5em \mathrm{t}\mathrm{he}\hskip0.5em 1\%{(}^{\ast })\hskip0.5em \mathrm{and}\hskip0.5em 5\%{(}^{\ast \ast })\hskip0.5em \mathrm{levels}\end{array}} $$
With predictions for the right-wing candidate and the RN being close to one another and within the margin of error, we constructed a second equation to predict how well a Conservative candidate would score against a Centrist in the second round.Footnote 11 The regression covers 1974–1995 and 2007–2012; 2002 and 2017 were excluded (i.e., qualification of the RN–FN to the second round).
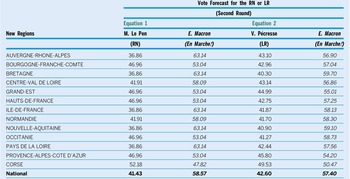
The vote for the Conservative candidate is explained by her score in the first round (RP1QUAL) (see table 2b); the scores of the Center (COMP1), the RN (FAR), and the Diverse Right (DVR) in the first round; and the Right’s strongholds in the second round (SHR2) (table 3).
 $$ {\displaystyle \begin{array}{l}{\mathbf{RP}}_2=14.9+0.70\times {\mathbf{RP}}_1\mathbf{QUAL}+0.57\times {\mathbf{COMP}}_1\\ {}\hskip4.5em {(4.68)}^{\ast }{(9.55)}^{\ast}\hskip8em {(6.89)}^{\ast}\\ {}\hskip4.5em +\hskip0.3em 0.49\times \mathbf{DVR}+0.47\times \mathbf{FAR}+2.60\times {\mathbf{SHR}}_2\\ {}\hskip5.5em {(3.68)}^{\ast}\hskip6em {(9.20)}^{\ast}\hskip4.5em {(2.90)}^{\ast}\\ {}\hskip1em \mathrm{Adj}.\mathrm{R}{}^2=0.78\hskip2em \mathrm{SER}=2.26\hskip2em \mathrm{N}=78\hskip0.2em \left(1974\hbox{--} 1995;2007\hbox{--} 2012\right)\\ {}\mathrm{Student}'\mathrm{s}\hskip0.5em \mathrm{t}\;\left(\mathrm{two}\hbox{-} \mathrm{tailed}\right):\mathrm{significant}\hskip0.5em \mathrm{at}\hskip0.5em \mathrm{t}\mathrm{he}\hskip0.5em 1\%{(}^{\ast })\hskip0.5em \mathrm{level}\end{array}} $$
2022 French Presidential Election

By plugging in the expected scores (see table 2b) and the stronghold areas (see table 3) and by setting the voting intentions predicted by the polls for Le Pen against Macron (44.45% in December 2021) in equations 1 and 2, we obtained the forecasts presented in table 3. We coded COMP1 as “0” on the assumption that Pécresse would not be able to benefit from all of the Centrist vote transfers because Macron should face her in the second round.
In both cases, at the time of our forecast, none of the right-wing (42.6%) or RN (41.4%) candidates would win over Macron. Only the combination of several factors could prevent the reelection of the incumbent: (1) a deterioration in his popularity level below its current 40%; (2) a worsening of the COVID-19 crisis weighing on growth and unemployment; and (3) Pécresse’s ability to rally some of the Right-Wing and Center-Right voters captured by Macron following Fillon’s elimination in 2017.
Finally, the Center had a great opportunity to reach the second round with 25.52% of the votes whereas, arithmetically, the weight of the Left bloc was 27.64% and the non-RN Right bloc was 28.1%. Thus, the Right–Left cleavage still existed; however, in May 2022, the “balkanization” of the French political spectrum could prevent it from resurfacing. This is another lesson resulting from our forecast.
DATA AVAILABILITY STATEMENT
Research documentation and data that support the findings of this study are openly available at the PS: Political Science & Politics Harvard Dataverse at https://doi.org/10.7910/DVN/DE6Y79.
Supplementary Materials
To view supplementary material for this article, please visit http://doi.org/10.1017/S1049096522000518.
CONFLICTS OF INTEREST
The authors declare that there are no ethical issues or conflicts of interest in this research.