Three-dimensional cryogenic imaging of biological cells by electron microscopy
Biological tissue is formed from individual cells, which present exquisitely complex and diverse morphologies. The study of their ultrastructure in three dimensions is almost synonymous with electron tomography.Reference Frank1,Reference Gan and Jensen2 Early methods, such as serial sectioning for transmission electron microscopy (TEM), have been augmented by serial surface-imaging techniques in the scanning electron microscope, such as array tomographyReference Micheva and Smith3,Reference Wacker and Schroeder4 and iterative polishing by mechanical microtomyReference Denk and Horstmann5 or focused ion beam milling.Reference Heymann, Shi, Kim, Bliss, Milne and Subramaniam6,Reference Weiner, Dahan-Pasternak, Shimoni, Shinder, von Huth, Elbaum and Dzikowski7 In the transmission electron microscope, tomography in tilt geometry is the preeminent approach to three-dimensional (3D) characterization. The 3D structure of a unique specimen, such as a biological cell, can be reconstructed from a series of projection images taken at different angles.Reference De Rosier and Klug8
TEM tomography has a number of differing implementations to suit the specimen preparation. Where cells or sections of tissue are embedded in plastic and stained with heavy metals such as uranium and osmium, the projection images are based on scattering contrast arising from the metal stain. Stain chemistry can be exploited to label specific structures or molecules within the ultrastructural context provided by 3D electron microscopy (EM).Reference Shu, Lev-Ram, Deerinck, Qi, Ramko, Davidson, Jin, Ellisman and Tsien9,Reference Diestra, Fontana, Guichard, Marco and Risco10 A new field of correlative microscopy has emerged, combining fluorescence methods with EM for the best of both worlds.Reference Watanabe, Punge, Hollopeter, Willig, Hobson, Davis, Hell and Jorgensen11–Reference Koster and Grünewald14 However, the steps of fixation and dehydration risk inducing changes in morphology; moreover, the stain distribution represents cellular features only indirectly. It is even possible to miss certain structures entirely if they are not effectively stained.
Ultimate preservation of cells and tissues might be achieved if the sample could be immobilized instantly in place. This is the goal of cryogenic fixation, in which a fully hydrated biological specimen is cooled so rapidly (or under high pressure) that the water solidifies into an amorphous glass without crystallizing into ice.Reference Falls, Davis, Scriven and Talmon15–Reference Dahl and Staehelin17 In the absence of heavy-metal staining, however, the light elements of biological matter scatter electrons too weakly to produce a conventional TEM image. Instead, contrast is generated by phase interference. Reconstruction from tilt tomography of phase-contrast images has emerged over the last dozen years as the state-of-the-art technique for the study of cellular architectures in unstained, cryogenically fixed material.Reference Medalia, Weber, Frangakis, Nicastro, Gerisch and Baumeister18,Reference Lučič, Rigort and Baumeister19 The recent introduction of scintillator-free cameras (direct electron detectors) based on complementary metal oxide semiconductor sensors promises great improvements in in situ cellular tomography,Reference Diebolder, Koster and Koning20 as has already been demonstrated for purified macromolecules.Reference Kühlbrandt21
The caveat here is that for interpretable phase contrast, the sample needs to be exceedingly thin, in fact, thinner than the cellular objects one might typically want to study. The typical thickness suitable for phase-contrast TEM is in the range of 200–300 nm. Cutting vitrified material into sections of this thickness at cryogenic temperatures is possible, but technically challenging.Reference Al-Amoudi, Chang, Leforestier, McDowall, Salamin, Norlén, Richter, Blanc, Studer and Dubochet22–Reference Hsieh, Schmelzer, Kishchenko, Wagenknecht and Marko24 Methods for molecular labeling are also constrained by the need to maintain cryogenic conditions, unless chemical fixation is also used. High-resolution structures reported so far have employed isolated or reconstituted specimens vitrified in thin layers, whose images can be computationally averaged.Reference Li, Mooney, Zheng, Booth, Braunfeld, Gubbens, Agard and Cheng25,Reference Bharat, Russo, Löwe, Passmore and Scheres26 While the level of detail available in such thin sections is certainly impressive, the spatial relation to the rest of the cell is lost.
One approach to extending the thickness realm for cryo-tomography is offered at synchrotron beam lines, using x-rays for illumination and diffractive optics (Fresnel zone plates) as lenses.Reference Schneider, Guttmann, Heim, Rehbein, Mueller, Nagashima, Heymann, Müller and McNally27–Reference Schertel, Snaidero, Han, Ruhwedel, Laue, Grabenbauer and Möbius30 When photon energy lies between the core ionization levels of carbon and oxygen (K-edges at 280 and 534 eV, respectively), lipids and carbon-rich structures appear dark on a lighter background of the aqueous medium. This low-energy, or “soft” region of the x-ray spectrum, is known as the “water window.” The penetration depth reaches 10 μm; in many cases, this is sufficient for imaging of intact cells. The image contrast based on quantitative absorption can be put on an absolute scale, and this information can then be used to identify cellular structures. The primary drawbacks of soft x-ray tomography are the modest resolution, typically 30–100 nm, and the shallow depth of field, which can be considerably smaller than the 10-μm thickness.
Still another approach is that of serial surface imaging using focused ion beam–scanning electron microscopy (FIB–SEM).Reference Heymann, Shi, Kim, Bliss, Milne and Subramaniam6 Vitrified biological specimens are serially milled by an ion beam while the freshly exposed block surface is imaged by the SEM.Reference Schertel, Snaidero, Han, Ruhwedel, Laue, Grabenbauer and Möbius30 Extraordinarily beautiful large-volume SEM cryo-imaging has been demonstrated by iterative FIB-milling.Reference Vidavsky, Masic, Schertel, Weiner and Addadi31 While the contrast mechanism for this novel method is not yet well understood, and repeated cryo-SEM imaging can cause instabilities in the delicate specimens, this method still holds great promise, as there is no fundamental limitation to the sample thickness.
Into this context enters the latest approach, cryo-tomography using STEM.Reference Wolf, Houben and Elbaum32 Recently, STEM has made great strides in the materials sciences, reaching the level of single-atom analytics.Reference Muller33–Reference Colliex, Gloter, March, Mory, Stéphan, Suenaga and Tencé37 The role of STEM in life sciences research is associated most closely with quantitative mass measurements of macromolecular assemblies.Reference Wall and Hainfeld38,Reference Engel and Hawkes39 While such specimens are normally dehydrated, a pioneering paper reported mass measurements under hydrated cryogenic conditions.Reference Trachtenberg, Leonard and Tichelaar40 Early efforts to use STEM as an imaging modality were largely abandoned in favor of scattering or phase-contrast TEM, though even in plastic-embedded samples, the stain requirements are more lenient, and some specimens can be observed by STEM without stain at all.Reference Carlemalm and Kellenberger41–Reference Wu, Kim, Bleher, Myers, Marvin, Inada, Nakamura, Zhang, Roth, Li, Woodruff, O’Halloran and Dravid43 STEM is now resurfacing for low-voltage imaging of thin sections in a SEM instrumentReference Klein, Buhr, Frase and Hawkes44 and can be combined conveniently with analytical tools, such as energy-dispersive x-ray spectroscopy (EDXS) and electron energy-loss spectroscopy.Reference Engel and Hawkes39,Reference Wu, Kim, Bleher, Myers, Marvin, Inada, Nakamura, Zhang, Roth, Li, Woodruff, O’Halloran and Dravid43,Reference Aronova and Leapman45 We consider it a matter of time before recent advances in STEM from materials science make their way into biological imaging.
A number of studies over the last decade have explored the application of STEM to tomography of stained, plastic-embedded thick (∼1 μm) specimens using the dual capabilities of modern automated TEM instruments.Reference Yakushevska, Lebbink, Geerts, Spek, van Donselaar, Jansen, Humbel, Post, Verkleij and Koster46–Reference Hohmann-Marriott, Sousa, Azari, Glushakova, Zhang, Zimmerberg and Leapman48 STEM is used routinely for this purpose at the Electron Microscopy Unit of the Weizmann Institute of Science,Reference Kapishnikov, Weiner, Shimoni, Guttmann, Schneider, Dahan-Pasternak, Dzikowski, Leiserowitz and Elbaum28,Reference Charuvi, Kiss, Nevo, Shimoni, Adam and Reich49–Reference Milrot, Mutsafi, Fridmann-Sirkis, Shimoni, Rechav, Gurnon, Van Etten and Minsky52 as well as other research labs.Reference Boonrungsiman, Gentleman, Carzaniga, Evans, McComb, Porter and Stevens53–Reference Pokrovskaya, Aronova, Kamykowski, Prince, Hoyne, Calco, Kuo, He, Leapman and Storrie57 It brings significant improvements for contrast and sample thickness compared to conventional TEM tomography. Having all the detectors and software in place, it was natural to test the STEM imaging in cryogenic conditions for unstained vitrified specimens. The following summarizes our initial explorations of the methodology and insights to its potential contributions to cellular imaging.
Microscope layout
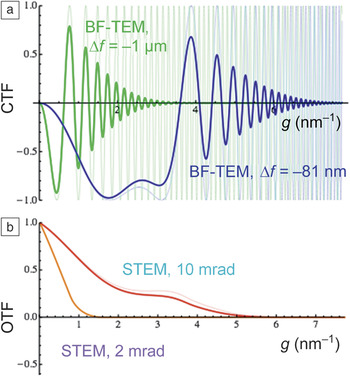
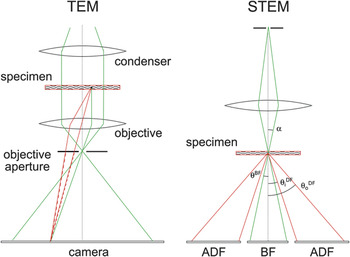
The basic microscope layouts for TEM and STEM are shown in Figure 1.Reference Kirchenbuechler, Mutsafi, Horowitz, Levin-Zaidman, Fass, Wolf and Elbaum58 Cryo-TEM relies on phase effects to generate contrast. Scattered and unscattered waves interfere coherently at the image plane, but due to a relative 90° phase shift, the contrast is minimal when in focus. In practice, one generates contrast by defocusing the specimen. This adds a path length difference that depends on the scattering angle and produces a complicated contrast transfer function (CTF) (Figure 2). At the lowest spatial frequencies (small diffraction angles), there is no contrast, while at higher frequencies (larger angles and finer image detail), the contrast inverts and oscillates. Uniform areas are therefore represented with similar intensity, while halos appear at the edges of dense structures and small features may appear bright or dark, depending on their size.
Basic microscope layouts for transmission electron microscopy (TEM) and scanning transmission electron microscopy (STEM). In TEM, as in a conventional light microscope, the sample is illuminated by an approximately parallel beam, and the image is formed on a camera by the objective. An objective aperture provides contrast by blocking scattered electrons. Specimens in cryo-EM normally lack metal stains, so the objective aperture is opened, and contrast is produced by phase interference between the scattered (red) and unscattered (green) waves. Generating useful contrast requires an additional phase shift, which can be produced with a phase plate, or more commonly by defocus; see Figure 2. In STEM, the microscope optics focus the illumination to a small probe spot that is scanned across the sample. The convergent cone (with semi-angle α) defines a bright-field (BF) disk on a detector below, while electrons scattered outside this cone arrive at an annular dark-field (ADF) detector. In practice, the detectors may not lie in the same plane, so the outer cutoff angle of the BF (θBF) and the inner cutoff of the ADF ( ${\rm{\theta }}_{\rm{i}}^{{\rm{DF}}}$) are not necessarily adjacent. The art of STEM lies largely in selecting collection angles, which may be varied using the diffraction projector lens (not shown) adjusting the “camera length.” Note that no optical image is formed, so the collection is primarily incoherent.Reference Kirchenbuechler, Mutsafi, Horowitz, Levin-Zaidman, Fass, Wolf and Elbaum58 Note:
 ${\rm{\theta }}_{\rm{o}}^{{\rm{DF}}}$, ADF outer cutoff angle.
Transmission electron microscope (TEM) phase contrast and scanning transmission electron microscope (STEM) optical transfer as functions of the spatial frequency, g. (a) Bright-field TEM (BF-TEM) contrast transfer functions (CTFs) (blue and green) for a thin-phase object and (b) incoherent STEM optical transfer function (OTF, red and orange) for a thin-amplitude object for the same spherical aberration, C s = 2.0 mm, at 200 kV. Fine lines in (a) show the transfer for an idealized fully coherent electron source, and bold lines include realistic source size broadening and partial spatial coherence (TEM: 0.2-mrad condenser half angle, 6-nm defocus spread; STEM: defocus ∆f = –81 nm, 0.5-nm geometric source full width at half maximum).Reference Kirkland79 In materials science, high-resolution images of thin samples are typically obtained with Scherzer transfer (blue and red) and large apertures. For TEM tomography of biological specimens, defocus values larger than ∆f = –1 μm (green) are used in order to obtain contrast at the relevant low spatial frequencies. For STEM tomography of thick biological samples, a smaller beam convergence (orange) is preferable for a better compromise between spatial resolution and depth of focus.

For macromolecular specimens, the CTF can be corrected computationally; information lost at spatial frequencies having zero contrast can be filled in by averaging multiple images recorded under different defocus conditions. Note that biological phase-contrast cryo-EM is similar to the practice of high-resolution TEM in materials science, except that much larger defocus values are typically employed in order to increase the contrast within the “low-frequency gap” of the CTF. For thicker specimens, the CTF correction is a major challenge in reaching high resolution in phase-contrast tomography.Reference Bharat, Russo, Löwe, Passmore and Scheres26,Reference Philippsen, Engel and Engel59,Reference Zanetti, Riches, Fuller and Briggs60 One of the most exciting developments is the introduction of phase plates that allow for imaging in focus by adding an additional 90° phase shift, similar to Zernike’s phase-contrast light microscope.Reference Zernike61 Practical phase plates are now entering the arena of biological electron microscopy with great success.Reference Nagayama62–Reference Mahamid, Pfeffer, Schaffer, Villa, Danev, Cuellar, Förster, Hyman, Plitzko and Baumeister65 However, the requirement for phase coherence imposes stringent constraints, as discussed.
STEM offers an alternative solution to the CTF problem by focusing and scanning a small probe spot on the specimen and then collecting the scattered and unscattered electrons separately, without recombining them into an image. Typically an on-axis disk detector collects the forward-scattered electrons, and an annular detector collects scattered electrons between some inner and outer cutoff angle (Figure 1). This detection scheme is primarily incoherent because adjacent points are not illuminated simultaneously. (Phase contrast can be produced when the on-axis detector outer cutoff angle or the inner cutoff angle of the annular detector is small compared with the incident-beam convergence angle α, or by more sophisticated schemes.)Reference Ophus, Ciston, Pierce, Harvey, Chess, McMorran, Czarnik, Rose and Ercius66 The image is created by representing the point-by-point measurements. As seen in the equivalent incoherent optical transfer function (Figure 2b), STEM retains information from the low spatial frequencies and avoids the contrast reversals in the CTF at high frequencies. Moreover, the optical transfer function is robust against partial spatial and temporal coherence. As most biological specimens are noncrystalline, they show no Bragg diffraction. To a good first approximation then, the intensity of the bright-field signal represents the unscattered electron flux, and the dark-field signal represents the total scattering by the elements encountered along the beam path, integrated from inner to outer cutoff angles. This makes quantitative interpretation of the image contrast relatively easy.
A particular distinction of biological tomography is that the probe beam can be optimized for depth of field rather than for ultimate resolution.Reference Hyun, Ercius and Muller67,Reference Biskupek, Leschner, Walther and Kaiser68 This is opposite the typical trend in materials science. Optimizing depth of field implies a shallow convergence cone and a large probe diameter according to simple diffraction:  ${d_{{\rm{probe}}}} = {{\rm{\lambda }} \over {\rm{\alpha }}},$
where λ is the de Broglie wavelength and α is the semiconvergence angle.
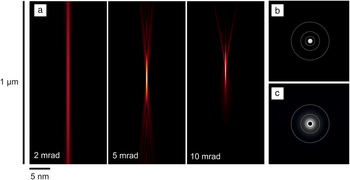
The depth of field is approximately  $2{\rm{\lambda }}/{{\rm{\alpha }}^2}$. At 200 kV, acceleration λ = 2.51 pm. Figure 3 shows simulated profiles of the beam divergence in vacuum for the Tecnai F20 TEM with “Twin” lens configuration. The tradeoffs among convergence angle, depth of field, and resolution can be tuned to suit the sample at hand. Following the simple diffraction relations with a semiconvergence angle of 2 mrad, the depth of field is 1.25 μm; for a 10-mrad angle, the depth of field is only 50 nm. Accounting for lens aberrations, at 2-mrad semiconvergence, 68% of the electrons remain concentrated in a beam diameter of 1.2 nm over a depth of 1 μm, while at 10 mrad, this diameter expands to more than 5 nm. A small convergence angle also allows for collection of low-angle scattering, which is especially advantageous for the light elements that dominate the composition of biological materials.
Scanning transmission electron microscope beam profiles. (a) The intensity distribution of the probe beam is shown for several semiconvergence angles α, for 200-kV acceleration and spherical aberration C s = 2.0 mm. Resolution is limited primarily by the spot size at focus. For semiconvergence angles smaller than ∼10 mrad, the spot size is diffraction-limited and scales as the wavelength λ = 2.51 pm over the angle α. The depth of field scales as λ/α2, so a small compromise in resolution brings great advantage in tomography of thick specimens. Dynamic focusing compensates additionally for specimen tilt. (b–c) The complete diffraction pattern can be recorded on a charge-coupled device camera. (b) With the sample removed, the flux is confined to the bright-field disk, whose diameter reflects the angle α and the camera length. (c) With a sample in place, there is a significant flux outside the bright-field disk, which is masked for visibility. Fine white rings delimit scattering angles of 5, 10, 20, and 40 mrad in order from innermost to outermost rings.

Advantages of STEM for cryo-tomography
The major benefit of STEM for cryo-tomography is the accessible sample thickness. In the ideal approximation, the interferometric nature of phase contrast records the electron wave amplitude, whereas incoherent scattering records its square (i.e., the intensity). For a weak-phase object, the linear amplitude signal will always be stronger than the quadratic. This suggests that in-focus STEM contrast is necessarily inferior to that of defocus TEM for imaging of organic matter, such as proteins in an aqueous medium. However, the benefits of phase contrast are largely lost in thick samples.Reference Rez69 Phase contrast requires phase coherence. Incoming electrons interact with the specimen either elastically or inelastically. Inelastic collisions involve a loss of energy and, therefore, a change in wavelength that suppresses interference contrast in the image. Resolution is also reduced owing to the chromatic aberration of the imaging lens.Reference Rose70 To remove the haze resulting from different electron energies coming to focus at different image planes, cryo-tomography is normally done in an energy-filtered mode using a spectrometer to keep only the elastically scattered, or so-called “zero-loss” electrons. The practical sample thickness limitation relates fundamentally to the mean free path (MFP) for inelastic scattering, at which point half the signal is lost. For vitrified water, this is about 250 nm at 200 kV (or 280 nm at 300 kV), and 200–300 nm thickness is indeed the typical target range for electron cryo-tomography.Reference Villa, Schaffer, Plitzko and Baumeister23,Reference Mahamid, Pfeffer, Schaffer, Villa, Danev, Cuellar, Förster, Hyman, Plitzko and Baumeister65 Thicker specimens can be imaged, but the signal-to-noise ratio will suffer and sample damage will be exacerbated.
The incoherent collection of STEM circumvents this phase-coherence requirement. The upper-thickness limit comes instead from multiple elastic scattering.Reference Rose70 The ratio between elastic and inelastic MFPs depends on the atomic number (Z), roughly as 20/Z, so for carbon, nitrogen, and oxygen, the elastic MFP is approximately 3× the inelastic value.Reference Engel and Hawkes39 By this argument, we can expect cryo-scanning transmission electron tomography (CSTET) to generate useful contrast up to a scale of at least 750 nm, and likely beyond. Because of the raster-scanning mode, the focus can be maintained dynamically across the entire field of view, even when the specimen is tilted to high angles, and at least where beam exposure permits. Focal series tomograms can also be combined to further increase accessible depth.Reference Trepout, Messaoudi, Perrot, Bastin and Marco71 Altogether, then, we direct attention to specimens in the “dark zone” of energy-filtered TEM, between 250 nm and 1 µm thickness, where STEM can make more efficient use of the electron dose for image formation.
A more subtle advantage of STEM for thick specimens centers on interpretability. Tomography rests on a number of assumptions.Reference Frank1 Foremost, the intensity (or darkness) of a pixel in a projection image should depend linearly on the parameter to be represented in the reconstruction. X-ray tomography maps the absorption coefficient, for example. In TEM, phase contrast in the image varies sinusoidally with material density in the specimen. When the phase differences between object and background are small, as they are for isolated macromolecules, the sine function is approximately linear. Cellular specimens are not truly weak-phase objects, however. To the extent that STEM is incoherent, by simply counting atoms along the beam path, the projection assumption is fulfilled.
Demonstrations
In the following, we demonstrate the capabilities of CSTET imaging for two common biological specimens: bacteria and mammalian tissue culture cells.
CSTET and Z contrast in bacteria
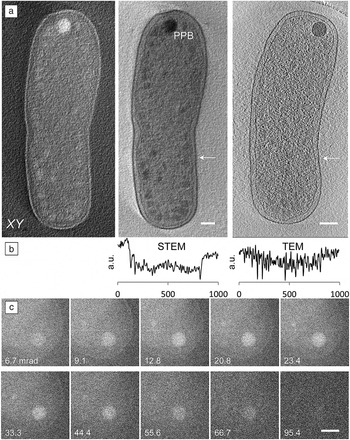
Agrobacterium tumefaciens is a common soil bacterium that is widely used in genetic engineering of plants. The rod-shaped bacterium is approximately 600–800 nm in diameter. Figure 4aReference Wolf, Houben and Elbaum32 shows sections through reconstructed volumes from bright- and dark-field STEM tomograms, along with a section through a TEM reconstruction. The sharp contrast in the TEM reconstruction is due to prominent Fresnel fringes—each dark line is surrounded by a thin white halo. This bipolar ringing effect is easy to see in a line profile (Figure 4b) and is, in fact, an artifact of the imaging process. The STEM reconstruction shows a unipolar contrast that gives a more realistic representation of the mass density.
Cryo-scanning transmission electron tomography of Gram-negative bacteria. (a) Central planar (XY) sections of 20-nm thickness through (left) dark and (center) bright-field tomographic reconstructions show membranes, chromatin, cytoplasmic condensations, and a large polyphosphate body (PPB) at the cell pole. (right) By comparison, contrast is poor in a central section similarly reconstructed from TEM data. Scale bars are 200 nm. (b) Line profiles show scaled intensities across the center and right panels (indicated by white arrows), and reveal the retention of contrast at low spatial frequencies in STEM, as well as the ringing effect of Fresnel fringes. Horizontal scale indicated in nm.Reference Wolf, Houben and Elbaum32 (c) A series of dark-field images taken with increasing annular dark-field inner cutoff angles show elemental sensitivity (Z contrast, where Z represents the atomic number) at the PPB. Scale bar is 200 nm.Reference Wolf, Rez and Elbaum73

An important issue in producing useful contrast is the electron dose required and the inevitable damage it causes to the specimen. High-resolution features suffer at low doses, whereas the lower resolution detail seen in tomography is more forgiving. A limit on the order of 100 electrons/Å2 has emerged for energy-filtered TEM tomography of whole cells.Reference Comolli and Downing72 We find that CSTET reconstructions with useful contrast can be acquired within such limits, and indeed under stricter conditions. In comparison with TEM, there is no loss of image signal to the energy filter. A systematic study of the damage threshold showed that for the same total dose, there is an advantage to rapid scanning with relatively strong illumination.Reference Wolf, Houben and Elbaum32 Presumably, incipient damage may heal as the beam moves to a new spot on the microsecond time scale.
The most prominent features in the bacterial cells in Figure 4 are large spherical bodies with strong contrast. Bacteria contain a number of dense internal bodies, including carboxysomes, glycogen, and polyphosphate bodies (PPBs). Phosphorus would scatter more strongly than carbon by virtue of its higher atomic number. This is the basis for the “Z contrast” familiar in materials science STEM. By scanning the STEM probe locally, we could detect phosphorus using EDXS, thus confirming the identification as a PPB.Reference Wolf, Rez and Elbaum73 (Bacterial PPBs were first identified in A. tumefaciens).Reference Seufferheld, Vieira, Ruiz, Rodrigues, Moreno and Docampo74 The strong exposure required for EDXS damages the sample locally, but the rest of the grid remains intact.
As a complement to EDXS, the scattering can be quantified by recording a series of annular dark-field images with increasing inner cutoff angles (Figure 4c). Comparison between the excess scattering over the spot and the ratio of scattering cross sections of phosphorus and carbon at high cutoff angles provided an estimate for the excess atomic composition of phosphorus.Reference Wolf, Rez and Elbaum73 While the Z-contrast cannot identify the heavier element specifically, context or prior information makes it useful for mapping the distribution with relatively little added dose.
CSTET of fibroblast cells
Eukaryotic cell biology benefits greatly from cryo-TEM imaging and tomography, but the requirement for thin specimens is a severe restriction. Even if judicious choice of the cell system can make an important contribution to productive imaging,Reference Medalia, Weber, Frangakis, Nicastro, Gerisch and Baumeister18,Reference Faas, Avramut, van den Berg, Mommaas, Koster and Ravelli75,Reference Gan, Ladinsky and Jensen76 most cells of interest are simply much thicker than 300 nm. A method that relaxes the thickness constraint by a factor of two or three would expand the realm of scientific questions addressable by cryo-tomography without the need for cryogenic sectioning.
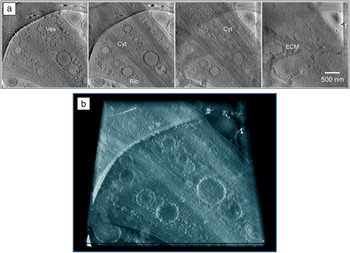
Figure 5a shows a series of tomographic slices through a CSTET reconstruction of a cultured human fibroblast (connective tissue cell, type: WI-38).Reference Kirchenbuechler, Mutsafi, Horowitz, Levin-Zaidman, Fass, Wolf and Elbaum58 Numerous cellular features are visible, including internal membranes, the cytoskeleton, ribosomes, and the extracellular matrix. Because of the small convergence angles and incoherent imaging, the pixel intensity in the bright-field reconstruction is a good measure of the electrons not scattered. Ribosomes, recognized by size and shape, appear dark due to the abundant phosphorus content of the RNA. Thus the pixel intensity carries significant information, recalling the quantitative power of soft x-ray tomography. Figure 5b shows a depth view through the same volume represented in the slices in Figure 5a. The mapping of density to brightness and sparsity to transparency (as opposed to darkness) is inherent in a volume-density representation. As in fluorescence light microscopy, the key to producing an effective volume representation is unipolar contrast (i.e., bright spots on a dark background). After inversion of the contrast, the CSTET reconstruction suits this purpose perfectly.
Cryo-scanning transmission electron tomography of mammalian fibroblasts. (a) A series of sections through a bright-field tomographic reconstruction of a cultured fibroblast cell. Features include abundant membrane vesicles (Ves), cytoskeleton (Cyt), ribosomes (Rib, small dark spots), and extracellular matrix (ECM). The spacing between successive sections is 100 nm and the scale bar indicates 500 nm. (b) Because of the quantitative contrast formation, dense areas can be shown as bright in a volume representation, with sparse areas shown transparent. Thus with “x-ray vision,” objects of interest can be observed through the depth of sparse regions.Reference Kirchenbuechler, Mutsafi, Horowitz, Levin-Zaidman, Fass, Wolf and Elbaum58

Conclusion and prospects
This article addressed a few of the potential advantages of STEM for cryo-tomography of biological subjects. None of this is to question the dramatic progress in 3DEM using conventional methods, but rather, the aim is to extend the range of cryo-electron microscopy to new areas.Reference Romero-Brey and Bartenschlager77 One of the unanticipated advantages of STEM is in visualization; the retention of low spatial frequencies allows us to peer through a sparse medium in order to see the denser structures within. Retaining low-frequency information has also been an incentive in the development of phase plates for TEM-based tomography. Volume visualization obviates much of the need for tedious segmentation to delineate surfaces, and opens the way for virtual reality visualizations of the cell interior.
To date, our cryo-STEM tomography studies have been made entirely on an instrument equipped with accessories intended for other purposes. There is plenty of room for improvement in reconfiguring the detector hardware for more efficient or more informative data collection. The most obvious is simultaneous collection of bright- and dark-field signals. Attention to theory of image formation will provide new scanned-imaging modalities and may further extend the specimen thickness limits.
Quantitative interpretation of image contrast in terms of material properties is a more subtle prospect than thickness, but no less powerful. It remains to be seen whether STEM-based imaging will ever match the few Angstrom resolution now achieved for protein structures by TEM using direct-detecting cameras. We are cautiously pessimistic in this regard. On the other hand, the prospect for detection of trace metals or incipient mineralization would appear to be better in STEM than in TEM. Trace metals play essential roles in many aspects of biological chemistry. STEM detection of even single atomsReference Colliex, Gloter, March, Mory, Stéphan, Suenaga and Tencé37,Reference Crewe, Wall and Langmore78 might be extended to the delicate samples of cellular cryo-tomography. The bacterial PPB already demonstrates detection of a few atomic percent of the heavier element. The sensitivity of dark-field STEM to heavy elements on a lighter organic background also provides a promising route to molecular labeling using heavy-metal atoms. This would tap the power of fluorescence microscopy for molecular specificity within the context of cellular ultrastructure in vitrified samples.