Introduction
Motivated by recent experimental observations showing that on electrochemical cycling, metallic lithium can propagate through the oxide garnet commonly known as LLZO, global research efforts are underway to better understand the complex coupling that exists between electrochemical cycling conditions and the state of stress at the lithium/solid electrolyte interface [Reference Sharafi, Meyer, Nanda, Wolfenstine and Sakamoto1, Reference Sharafi, Haslam, Kerns, Wolfenstine and Sakamoto2, Reference Cheng, Sharafi and Sakamoto3, Reference Cheng, Chen, Kunz, Persson, Tamura, Chen and Doeff4, Reference Tsai, Roddatis, Chandran, Ma, Uhlenbruck, Bram, Heitjans and Guillon5, Reference Yu and Siegel6, Reference Yu, Schmidt, Garcia-Mendez, Herbert, Dudney, Wolfenstine, Sakamoto and Siegel7, Reference Porz, Swamy, Sheldon, Rettenwander, Frömling, Thaman, Berendts, Uecker, Carter and Chiang8, Reference Herbert, Hackney, Dudney, Thole and Phani9, Reference Herbert, Hackney, Dudney, Thole and Phani10, Reference Swamy, Park, Sheldon, Rettenwander, Porz, Berendts, Uecker, Carter and Chiang11, Reference Wang, Wolfenstine and Sakamoto12, Reference LePage, Chen, Kazyak, Chen, Sanchez, Poli, Arruda, Thouless and Dasgupta13, Reference Masias, Felten, Garcia-Mendez, Wolfenstine and Sakamoto14]. Of particular interest is developing an understanding of how and why on electrochemical cycling a small volume of metallic lithium, which has an elastic modulus, E, of ∼9 GPa and a bulk yield strength, σy, of ∼0.5 MPa, is physically capable of locally infiltrating and propagating completely through the solid-state electrolyte (SSE) separator LLZO, which has an elastic modulus of ∼150 GPa (17 times higher than polycrystalline lithium) and a bulk plane strain fracture toughness, K Ic, of ∼1.25 MPa m1/2, indicating a normal stress of 315 MPa is required to propagate a surface crack with a length of 5 μm (assuming Y = 1.0) [Reference Yu, Schmidt, Garcia-Mendez, Herbert, Dudney, Wolfenstine, Sakamoto and Siegel7, Reference Porz, Swamy, Sheldon, Rettenwander, Frömling, Thaman, Berendts, Uecker, Carter and Chiang8, Reference Wang, Wolfenstine and Sakamoto12, Reference Schultz15].
Among the recent studies addressing this issue, Porz et al., Herbert et al., Wang et al., and Swamy et al. have independently proposed hypotheses that consider the relationship between stress intensification and local variations in the current density at the lithium/SSE interface [Reference Porz, Swamy, Sheldon, Rettenwander, Frömling, Thaman, Berendts, Uecker, Carter and Chiang8, Reference Herbert, Hackney, Dudney, Thole and Phani9, Reference Herbert, Hackney, Dudney, Thole and Phani10, Reference Swamy, Park, Sheldon, Rettenwander, Porz, Berendts, Uecker, Carter and Chiang11, Reference Wang, Wolfenstine and Sakamoto12]. Particularly relevant to these hypotheses, macroscopic tensile experiments recently performed on lithium at high homologous temperatures show that dynamic recovery and creep dominate over a wide range of battery-relevant conditions [Reference LePage, Chen, Kazyak, Chen, Sanchez, Poli, Arruda, Thouless and Dasgupta13, Reference Masias, Felten, Garcia-Mendez, Wolfenstine and Sakamoto14]. Of specific concern, however, is the mechanical behavior of lithium at length scales commensurate with defects at the lithium/SSE interface. Through micropillar and nanoindentation experiments performed on lithium and many other metals, it is now well documented that strength scales inversely with the dimensions of the stressed volume, giving rise to the common expression, ‘smaller is stronger.’ [Reference Herbert, Hackney, Dudney, Thole and Phani9, Reference Xu, Ahmad, Aryanfar, Viswanathan and Greer16, Reference Kraft, Gruber, Mönig and Weygand17, Reference Nix and Gao18, Reference Pharr, Herbert and Gao19, Reference Phani, Johanns, George and Pharr20] Based on these observations, we submit the potential coupling between stress intensification, and failure of the SSE must be considered in the context of diminished capacity to enable dislocation-mediated flow at relevant length scales. To that end, the proposed hypotheses and results from bulk tension and compression experiments are examined here in light of nanoindentation studies performed in high-purity vapor-deposited lithium films at indentation depths less than 1 μm. Collectively, these experimental studies provide new insight into how lithium responds to stress and stress gradients at length scales and strain rates (current densities) commensurate with SSE failure.
Based on the findings from recent nanoindentation studies and bulk tensile experiments performed on lithium, we present a mathematically tractable and transparent model that relates a two-dimensional (2D) state of stress at the lithium/SSE interface to the average current density, the length scale of an interfacial defect, and lithium diffusional creep and/or dislocation plasticity stress relaxation mechanisms. These factors and the elastic modulus of lithium are combined into a new deformation mechanism map covering a wide range of defect geometries and operating conditions. The proposed analysis presents a common framework to compare and contrast the most recent hypotheses of SSE stress development and potential failure. As such, the model addresses interfacial defects in the form of local deviations from a flat interface (nonplanar) and local variations in the overpotential and/or exchange current density (planar interface).
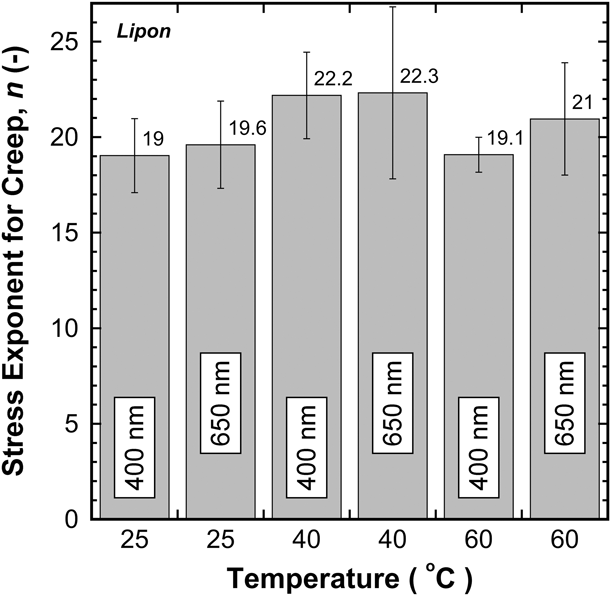
Through this simple elastic perturbation model, we describe a defect length scale that is too large for effective Nabarro–Herring diffusional creep relaxation (diffusion length is too long), but too small for efficient dislocation multiplication (insufficient room to physically operate the source), suggesting the possibility of large, deleterious stresses at the lithium/SSE interface. In this instance, the properties of the SSE may become critical in relieving pressure and mitigating the stress intensification enabling mode I or mixed-mode fracture of the SSE. Such concerns have motivated a nanoindentation creep study of the SSE LiPON. The indentation study shows that LiPON does have a stress relaxation process with a stress exponent, n, of ∼20, which is found to be effectively independent of temperature and length scale over the respective ranges of 25–60 °C and 400–650 nm of indentation depth. To accommodate a wide range of readers with electrochemical and mechanics backgrounds, the units of each variable are specified throughout the article.
Model development
In congruence with the hypotheses recently proposed by Porz, Herbert, Wang, and Swamy, and the recent experimental observations of LePage and Masias, a novel 2D continuum elasticity model is presented that describes the state of stress at the lithium/SSE interface during charging [Reference Porz, Swamy, Sheldon, Rettenwander, Frömling, Thaman, Berendts, Uecker, Carter and Chiang8, Reference Herbert, Hackney, Dudney, Thole and Phani9, Reference Herbert, Hackney, Dudney, Thole and Phani10, Reference Swamy, Park, Sheldon, Rettenwander, Porz, Berendts, Uecker, Carter and Chiang11, Reference Wang, Wolfenstine and Sakamoto12, Reference LePage, Chen, Kazyak, Chen, Sanchez, Poli, Arruda, Thouless and Dasgupta13, Reference Masias, Felten, Garcia-Mendez, Wolfenstine and Sakamoto14]. As per the proposed hypotheses, the model is based on the point effect of diffusion, which is a concept used to describe dendrite growth at both solid–liquid (Mullins & Sekerka) and solid–solid or solid–state (McCarty & Hackney) interfaces [Reference Mullins and Sekerka21, Reference Mullins and Sekerka22, Reference McCarty and Hackney23]. Physically, the point is taken to be any region of the lithium/SSE interface wherein a local increase in the current density deposits lithium into a small volume at the interface to a greater extent than the adjacent interface areas. As suggested by Porz, Herbert, and Wang, the point could physically be any lithium-filled defect or disruption from a planar interface such as, but not limited to, a pore, microcrack, grain boundary, grain boundary groove, surface roughness, or mere undulations in the surface of the SSE. Alternatively, Wang and Swamy have suggested the point could also be physically represented by a local, but otherwise planar region of the interface wherein the local increase in current is driven by perturbations in the exchange current density and/or the overpotential. Either way, the key outcome is localized stress intensification due to the preferential diffusion and plating of metallic lithium into a small volume at the lithium/SSE interface. Because both conditions (nonplanar and planar point effect of diffusion) are plausible, the model is developed for both cases, thus providing a common framework to compare and contrast the most recent hypotheses for stress development at the lithium/SSE interface.
Informed guidance from nanoindentation, past and future
Drawing from the previous nanoindentation studies, here we present a brief review of the key experimental observations that directly inform the proposed model [Reference Herbert, Hackney, Dudney, Thole and Phani9, Reference Herbert, Hackney, Dudney, Thole and Phani10, Reference Herbert, Hackney, Dudney and Phani24]. Of particular interest is the hypothesized relationship between the velocity of the indenter tip and a localized change in the current density at the lithium/SSE interface, which is presented in Eq. (4b) below [Reference Herbert, Hackney, Dudney, Thole and Phani9].
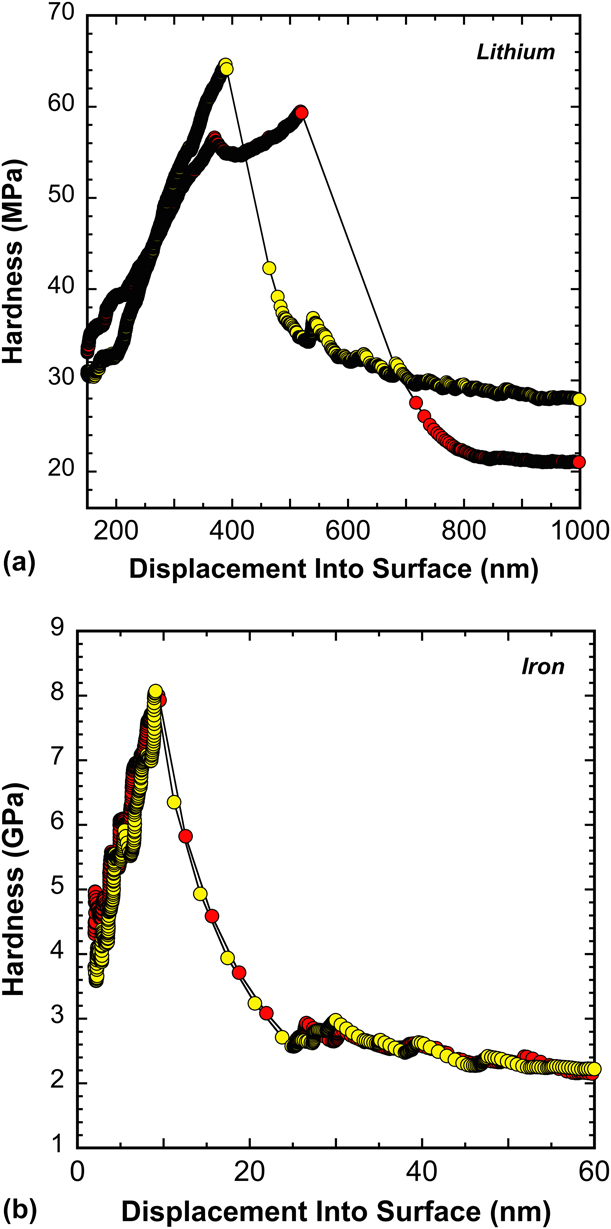
As previously reported and illustrated by the representative data shown in Fig. 1(a), at indentation depths below ∼1 μm, the mean pressure or hardness, H (Pa or J/m3), lithium is capable of supporting is strongly dependent on length scale [indentation depth, h (m)]. Although not explicitly shown in Fig. 1(a), it is well documented that H also depends strongly on the indentation strain rate,  ${{\dot{h}} / h}\;\left( {{{\rm{s}}^{ - 1}}} \right)$ [Reference Herbert, Hackney, Dudney, Thole and Phani9]. At the experimentally observed strain rate limits of 1.4 and 7.5 × 10⁻³ s−1, the measured H ranges from 175 to 40 MPa at corresponding indentation depths of 40 and 350 nm, respectively [Reference Herbert, Hackney, Dudney, Thole and Phani9]. At these ‘small’ length scales and corresponding strain rates, the mean pressure lithium is capable of supporting ranges from ∼350 to 80 times the yield strength of bulk, polycrystalline lithium (σy = ∼0.5 MPa) [Reference Herbert, Hackney, Dudney, Thole and Phani9]. Immediately following the experimentally observed peak in H, the precipitous drop in pressure represents a stress relief mechanism hypothesized to be an activated multiplication source that, once triggered, produces a dislocation avalanche, as the peak stress immediately before the avalanche does not appear to reach the level required for ex nihilo dislocation nucleation (section “Vacancy annihilation and non-equilibrium vacancy concentrations”) [Reference Herbert, Hackney, Dudney, Thole and Phani9, Reference Herbert, Hackney, Dudney, Thole and Phani10].
Representative hardness versus depth data for high purity, BCC (a) lithium and (b) iron.

The representative data presented in Fig. 1(a) have been interpreted using the many studies showing that ‘smaller is stronger’ because of the inhibition of dislocation plasticity within a ‘small’ stressed volume [Reference Kraft, Gruber, Mönig and Weygand17, Reference Phani, Johanns, George and Pharr20]. Moreover, the relationship between the indentation strain rate and the depth dependent H before the sudden drop in pressure has been rationalized using the concepts of diffusional creep (stress exponent, n = 1) [Reference Herbert, Hackney, Dudney, Thole and Phani9]. Based on that foundation (detailed in Reference Herbert, Hackney, Dudney, Thole and PhaniRefs. 9 and Reference Herbert, Hackney, Dudney, Thole and Phani10), we propose the variation in H due to Nabarro–Herring creep at the relevant indentation strain rate is determined as
 $${{\dot{h}} \over h} = {1 \over {{C_{{\rm{dl}}}}}}{{D\Omega H} \over {{k_{\rm{B}}}T{h^2}}}\quad ,$$
where C dl is a scaling factor that relates h to the diffusion length, D is the self-diffusion coefficient of lithium (m2/s), Ω is the atomic volume (m3/atom), k B is the Boltzmann constant (J/(atom K)), and T is the absolute temperature (K). Equation (1) was developed in Ref. Reference Herbert, Hackney, Dudney, Thole and Phani9 and is re-derived in Appendix A using the expanding cavity model (ECM).
Subject to a number of experimental constraints, for well-annealed (low dislocation density), high-purity metallic test specimens at a low homologous temperature, the initiation of dislocation-mediated plasticity under a Berkovich indenter tip is frequently observed at h = ∼10–50 nm, as illustrated by the high purity iron data shown in Fig. 1(b). By comparison, the distinctive transition observed in lithium occurs at h > 300 nm and, although not explicitly shown here, with significant variation in h as a function of the strain rate [Reference Herbert, Hackney, Dudney, Thole and Phani9]. Using a statistical analysis technique similar to a three-term Weibull distribution, the precipitous drop in H shown in Fig. 1(a) has been correlated with the product of the average hardness,  $\bar{H}$, and average depth,
 $\bar{h}$, at the onset of the dislocation avalanche [Reference Herbert, Hackney, Dudney, Thole and Phani10]. Under the experimental conditions and strain rates described in Refs. Reference Herbert, Hackney, Dudney, Thole and Phani9 and Reference Herbert, Hackney, Dudney, Thole and Phani10, the product of
 $\overline {Hh}$ at the onset of the transition is given by
 $$\overline {Hh} = {{Gb\left( {{{0.885} \over {{L_{{\rm{ave}}}}}} + {{{\lambda _{\rm{o}}}^{{1 / 3}}} \over {{\delta _{\rm{L}}}}}} \right)} \over {{\lambda _{\rm{o}}}^{{1 / 3}}}}\sim19.3\;{{\rm{N}} / {\rm{m}}}\quad ,$$
where  $\overline {Hh}$ is the product of the Weibull mean value and the average of the corresponding depth, G is the shear modulus of lithium (GPa), b is the magnitude of the Burgers vector (m), L ave is the average length (m) in the L distribution of dislocation pinning point spacing (Frank–Read or other dislocation bow out type source), λo is the volumetric number density of dislocation sources (m−3), and δL = L max/h (−) with L max being the maximum possible pinning point spacing (m) allowed for the complete operation of the loop multiplication process [Reference Herbert, Hackney, Dudney, Thole and Phani10]. We further note the observed length scale–dependent strength of lithium is not unique to nanoindentation, as Eq. (2) is found to be generally consistent with the lithium micropillar compression experiments performed by Xu et al. [Reference Xu, Ahmad, Aryanfar, Viswanathan and Greer16] Accordingly,
 $\bar{h}$ is taken to be representative of a critical length scale required to enable the operation of a dislocation multiplication source contained within the stressed volume of lithium.
By relating Eqs. (1) and (2), the relationship for the indentation velocity at the transition point between diffusion- and dislocation-mediated flow is given as
 $$\dot{h} = {{G\beta b\left( {0.885{\delta _{\rm{L}}} + {L_{{\rm{ave}}}}{\lambda _{\rm{o}}}^{{1 / 3}}} \right)} \over {{L_{{\rm{ave}}}}{\delta _{\rm{L}}}{\lambda _{\rm{o}}}^{{1 / 3}}{h^2}}}\sim19.3\;\left( {{{\rm{N}} / {\rm{m}}}} \right)\;{\beta / {{h^2}}}\quad ,$$
where β = (DΩ)/(k BT). The utility of Eq. (3) is that it provides a description of the conditions where dislocation plasticity may contribute to stress relaxation at the SSE interface. It is expected that L ave and  ${\lambda _{\rm{o}}}^{{1 / 3}}$ are inversely related and, thus, the dependence of the transition from diffusion- to dislocation-mediated flow on dislocation density is very weak, but the dependence on the length scale, h, is quite strong. The indentation displacement rate,
 $\dot{h}$, in Eqs. (1) and (3) is of particular interest to any stress-related lithium/SSE interface failure because many studies have attributed the SSE failure to a local increase in lithium current density, i local (A/m2), relative to the average current density, i (A/m2), at the lithium/SSE interface [Reference Porz, Swamy, Sheldon, Rettenwander, Frömling, Thaman, Berendts, Uecker, Carter and Chiang8, Reference Swamy, Park, Sheldon, Rettenwander, Porz, Berendts, Uecker, Carter and Chiang11, Reference Wang, Wolfenstine and Sakamoto12, Reference LePage, Chen, Kazyak, Chen, Sanchez, Poli, Arruda, Thouless and Dasgupta13, Reference Masias, Felten, Garcia-Mendez, Wolfenstine and Sakamoto14, Reference Dudney25]. The physical connection between
 $\dot{h}$ and i can be developed by considering the constraints imposed by the combination of a high modulus SSE (analogous to a nearly rigid boundary similar to that of a diamond indenter tip) and continuity across the lithium/SSE interface, which gives the maximum displacement of lithium, h max because of a local variation in current density as the integral
 $${h_{\max }} = \int_0^t {{{\left| {{i_{{\rm{local}}}}} \right| - \left| i \right|} \over q}} \Omega {\rm{d}}\tau \quad ,$$
where q is the charge on a lithium ion (C/ion) and h max is taken to be directly analogous to the indentation depth, h. Assuming the time derivative of Eq. (4a) is of the same order as the indentation rate,  $\dot{h}$, leading to Eq. (4b), then the nanoindentation technique can provide additional insight into the mechanical response of lithium at the lithium/SSE interface at the micron to submicron defect length scale, as
 $$\dot{h}\;\sim\;{{\left| {{i_{{\rm{local}}}}} \right| - \left| i \right|} \over q}\Omega \quad ,$$
where it is further noted that because (|i local| − |i|)/q is the net lithium ion flux at the lithium/SSE interface and Ω is the inverse of the lithium metal atomic concentration, then Eq. (4b) has the form of the Stefan boundary condition for a moving interface, with  $\dot{h}$ representing the interface velocity [Reference Zener26, Reference Stefan27].
Beyond the displacement analogy between the indentation rate and lithium displacement rate due to a localized variation in current density at the SSE interface, the resulting state of stress for |i local| − |i| > 0 has further similarities, as may be considered through the ECM frequently used to describe indentation [Reference Bower28, Reference Johnson29]. Here, we note a localized increase in current density magnitude within a circular interface area will lead to a hemispherical compressive stress region similar to that of the ECM, especially when the indentation volume diameter correlates with the SSE interface defect length scale. Thus, Eq. (4b) initiates a discussion of how nanoindentation results can be used to analyze how the stress within a lithium-filled interface defect of limited length scale would respond to a given current density via diffusional creep relaxation as described in Eq. (1), and the transition to dislocation-mediated plasticity, which is given by Eq. (3).
It is within the context of Refs. Reference Herbert, Hackney, Dudney, Thole and Phani9, Reference Herbert, Hackney, Dudney, Thole and Phani10, and Reference Herbert, Hackney, Dudney and Phani24 and Eqs. (1)–(4) that we submit there is a critical length scale at which the absence of effective transport mechanisms promotes the development of a local stress concentration capable of reaching 350 times the yield strength of bulk polycrystalline lithium (Ref. Reference Herbert, Hackney, Dudney, Thole and Phani9). The compressive stress concentration in the lithium due to a local increase in current density is balanced by a tensile component in the SSE concentrated at the interface, potentially capable of causing catastrophic mode I or mixed mode fracture and failure of the SSE. As per the nanoindentation study, the maximum possible pressure sustainable by lithium depends on the strain rate, which is directly analogous to any local increase in the current density. Below the critical length scale, we submit that deleterious pressure is partially mitigated by a short diffusion length. Above it, we suggest the pressure is alleviated by dislocation-mediated flow [Eq. (3)]. In accordance with the nanoindentation study, the emerging hypothesis is the following: If a small volume (∼3.4 μm3, rationalized in section “direct comparisons between the leading hypotheses describing the state of stress at the lithium/SSE interface”) of metallic lithium is subjected to stress at a high homologous temperature (T H ≥ 0.6), then the stressed volume will support a pressure approaching the metal’s theoretical yield strength in a manner that depends directly on the strain rate (current density) and dislocation density because flow is controlled by Nabarro–Herring or Harper–Dorn type stress–directed diffusion mechanisms rather than dislocation glide. A central tenant of this hypothesis is that dislocation glide, the ultimate pressure release valve, requires not only a critical threshold in stress but also sufficient room for the dislocation multiplication/nucleation mechanism to physically operate. Not all locally stressed volumes at this length scale are expected to support abnormally high stresses, as the maximum possible pressure also depends on the probability of finding or not finding a dislocation source within close proximity to the critically stressed volume. Furthermore, as explained by Monavari, it is expected the source’s activation rate will be directly dependent on the motion of dislocations at a distance, as the stress at the source will be strongly influenced by local dislocation–dislocation interactions such as the back stress associated with previously emitted loops [Reference Monavari and Zaiser30].
Consistent with the collective works of Sharafi, Cheng, Tsai, and Basappa, Wang recently reported that the critical current density (CCD) is exponentially dependent on temperature [Reference Sharafi, Meyer, Nanda, Wolfenstine and Sakamoto1, Reference Sharafi, Haslam, Kerns, Wolfenstine and Sakamoto2, Reference Cheng, Sharafi and Sakamoto3, Reference Cheng, Chen, Kunz, Persson, Tamura, Chen and Doeff4, Reference Tsai, Roddatis, Chandran, Ma, Uhlenbruck, Bram, Heitjans and Guillon5, Reference Wang, Wolfenstine and Sakamoto12, Reference Basappa, Ito and Yamada31]. As hypothesized by Wang, one potential explanation for this observation is temperature-dependent dislocation motion [Reference Wang, Wolfenstine and Sakamoto12]. Alternatively, we note the exponential temperature dependence in the CCD could be rationalized by the temperature-dependent diffusion coefficient in Eq. (14) of Ref. Reference Herbert, Hackney, Dudney, Thole and Phani9. In this way, Wang’s experimental observations could be consistent with the hypothesis stated above.
The length scale effect described by Eqs. (1)–(3) is acutely relevant to the recent attempts at modeling lithium deformation at the SSE interface by Narayan et al. [Reference Narayan and Anand32] Capitalizing on the recent lithium nanoindentation work of Wang et al., finite element analysis (FEA) performed by Narayan uses a large deformation theory to model the flow of lithium, assuming its mechanical behavior is accurately described by an isotropic elastic-viscoplastic constitutive law [Reference Narayan and Anand32, Reference Wang and Cheng33]. Over experimental strain rates (ratio of loading rate to load,  ${{\dot{P}} / P}$) ranging from 0.1 to 1.0 s−1 and constant
 $\dot{P}$ experiments ranging from 0.196 to 3.92 mN/s (corresponding maximum indentation depths of ∼4.5–11 μm), the proposed model reproduces the measured P–h curves with reasonable accuracy. We note, however, the continuum approach used by Narayan uses a deformation gradient decomposition, F = FeFp, that, according to Mesarovic, relies on the relative motion of adjacent lattice points (shear mediated flow) and, therefore, ignores the possibility of Nabarro–Herring or Harper–Dorn type diffusional creep [Reference Mesarovic34]. As such, the proposed model may accurately predict stresses within an interfacial defect, but only in the limit that the dominant deformation mechanism is shear-driven dislocation plasticity. This constraint may, therefore, preclude accurate analysis of the stress dependence of the creep rate within lithium-filled defects at the critical length scale required to potentially cause failure. Future adaptations could correct this deficiency by implementing the continuum analysis developed by Mesarovic, which incorporates diffusional creep reminiscent of the original Herring analysis [Reference Mesarovic34].
A physical and mathematical description of the coupling between current density and the state of stress at the lithium/SSE interface
The analysis presented here describes the lithium plating process with respect to deviations from the ideal conditions of a stress-free, planar deposition of lithium (no interface stress relief required). When these conditions breakdown or cannot be met, the proposed model uses a hypothesized competition between stress-directed diffusive flow (creep exponent, n = 1) and dislocation-mediated plasticity to describe stress relief within ‘small’ volumes at the lithium/SSE interface, where the probability of finding a mobile dislocation or an operable dislocation source can be low. Only the key elements of the derivation are presented here. Additional details are available in Appendix B. Table I summarizes the stress relief mechanisms, the interface shapes, relevant boundary conditions, and their related references. For the sake of simplicity, we initially consider 2D variations in the current density at the interface between a pure lithium metal electrode (the anode) and a nonplanar SSE interface. The geometric origin of the spatial variation in current density is examined using a 2D undulating boundary that fits the function
 $$y = \Delta \;\cos \left( {\omega x} \right)\quad ,$$
where y and x are the vertical and horizontal positions of the boundary (m), respectively, Δ is the amplitude of the lithium-filled undulation (m), and ω is the spatial frequency (cycles/m) of the undulation in the x direction. Consistent with the concepts proposed by Porz, Herbert, Wang, Swamy, LePage, and Narayan, it is assumed that interfacial defects are filled with lithium either by the application of an externally applied compressive stack pressure or through electrodeposition or a combination thereof [Reference Porz, Swamy, Sheldon, Rettenwander, Frömling, Thaman, Berendts, Uecker, Carter and Chiang8, Reference Herbert, Hackney, Dudney, Thole and Phani9, Reference Herbert, Hackney, Dudney, Thole and Phani10, Reference Swamy, Park, Sheldon, Rettenwander, Porz, Berendts, Uecker, Carter and Chiang11, Reference Wang, Wolfenstine and Sakamoto12, Reference LePage, Chen, Kazyak, Chen, Sanchez, Poli, Arruda, Thouless and Dasgupta13, Reference Narayan and Anand32]. The average current density, i, at the interface is considered in the two extremes of diffusion current control, i D, and drift current control, i μ, such that
 $$\left| {{i_{\rm{D}}}} \right| = D_{{\rm{Li}}}^{{\rm{SSE}}}\left| {{G_{{\rm{Li}}}}} \right|q\quad ,$$
and
 $$\left| {{i_\mu }} \right| = \mu {C_{{\rm{Li}}}}\left| {{G_{\rm{e}}}} \right|q\quad ,$$
where  $D_{{\rm{Li}}}^{{\rm{SSE}}}$ is the diffusion coefficient of lithium in the SSE (m2/s), G Li is the average gradient in lithium ion concentration at the interface (ions/m4), μ is the ionic mobility (m2/(V s)), C Li is the lithium ion concentration (ions/m3) in the SSE when the drift current dominates, and G e is the average electric field gradient at the interface (V/m).
Summary of the stress mechanisms and boundary conditions.

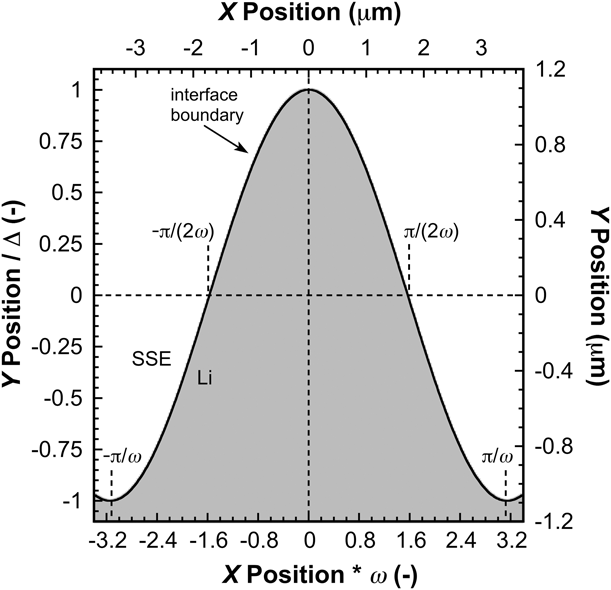
The point effect of diffusion or electric field (Appendix B) will influence the flux of lithium ions to the undulating interface such that convex portions of the interface with a negative second derivative of Eq. (5) [Fig. 2, y > 0 and −π/(2ω) ≤ x ≤ π/(2ω)] will have an increase in current density relative to the average current density, whereas concave sections of the interface (Fig. 2, y < 0 and −π/ω ≤ x ≤ π/ω) will have a reduced ion flux relative to the average current density. Accordingly, the normal elastic displacement in the y-direction, u y, at the apex, and root of the undulation are equal in magnitude but opposite in sign,
 $${u_y}\left( {x = 0} \right) = - \delta \quad ,$$
and
 $${u_y}\left( {x = {\pi \over \omega }} \right) = \delta \quad ,$$
where δ is the elastic displacement imposed by plating lithium at the interface.
The undulating interface modeled by the proposed 2D elastic perturbation solution. The average position of the interface is taken to be at y = 0. This particular geometry represents the minimum ratio of wavelength to amplitude (2π) the model’s small strain assumptions will allow in order to reliably estimate stress at the interface as a function of electrochemical cycling conditions.

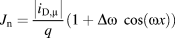
To first order in the product Δω, the flux normal to the interface, J n [ions/(m2 s)], is found to be
 $${J_{\rm{n}}} = {{\left| {{i_{{\rm{D}},\mu }}} \right|} \over q}\left( {1 + \Delta \omega \cos \left( {\omega x} \right)} \right)\quad .$$
Based on Wang’s argument (and inferred by Swamy), we also consider activation control spatial variation in one dimension on a planar interface [Reference Swamy, Park, Sheldon, Rettenwander, Porz, Berendts, Uecker, Carter and Chiang11, Reference Wang, Wolfenstine and Sakamoto12]. In this case, the mechanism results in nonuniform lithium plating but does not require a physical defect. The Butler–Volmer equation with a small spatial variation in activation control is
 $$\left| i \right| = \left| {{i_{\rm{o}}}} \right|\left( {1 + {\Delta _{{\rm{o,a}}}}\cos \left( {\omega x} \right)} \right)\exp \left( {{{\vartheta F} \over {RT}}\left| \eta \right|} \right)\quad ,$$
where i o is the exchange current density (A/m2), ϑ is the unitless charge transfer coefficient, F is the Faraday constant (C/mol), R is the universal gas constant (J/(mol K)), and η is the overpotential (V). The unitless Δo,a corresponds to the magnitude of a first order perturbation parameter in either the overpotential (as argued by Wang) or exchange current density. For a spatial variation in overpotential of magnitude ηo (V) at a constant exchange current density,
 $${\Delta _{\rm{o}}} = {{\vartheta F} \over {RT}}\left| {{\eta _{\rm{o}}}} \right|\quad .$$
For a spatial variation in the exchange current density at a constant overpotential with the magnitude in spatial variation of activation energy, Q o (J/mol),
 $${\Delta _{\rm{a}}} = {{{Q_{\rm{o}}}} \over {RT}}\quad .$$
Equation (10) can now be rewritten in terms of the spatial variation in J n(x) relative to the average value of J n at an undulating interface as described in Eq. (10) or at a flat interface as
 $${J_{\rm{n}}}\left( x \right) = {{\left| i \right|} \over q}\left( {1 + {\Delta _{{\rm{o,a}}}}\cos \left( {\omega x} \right)} \right)\quad ,$$
where |i| is the absolute value of the average current density. Whether considering Eq. (10) or (14), the elastic displacement as lithium is plated to the anode at the SSE interface is a function of x and will result in a nonuniform state of stress.
The Marguerre displacement function is used to examine the spatial dependence of the stresses associated with the spatial dependence of the lithium plating rate at the interface. Although the Marguerre approach gives a 2D elasticity solution, it can be used to provide a reasonable first order approximation of the stresses potentially associated with failure at the SSE interface. The simplest form of the Marguerre displacement function required to meet the displacement conditions at the SSE interface is
 $$\Psi = \left( {A\left( \omega \right) + B\left( \omega \right)y} \right)\cos \left( {\omega x} \right)\exp \left( {\omega y} \right)\quad ,$$
where A(ω) (m3) and B(ω) (m2) are determined by the imposed boundary conditions, x (m) is the horizontal position along the interface relative to the epicenter of the point effect of diffusion (x = 0), and y (m) is the vertical position above or below the average position of the interface (y = 0). As previously noted, the peak elastic displacement imposed by plating lithium at the interface, δ, occurs at x = 0. By adopting the Marguerre solution, the compatibility conditions for displacement and strain are inherently satisfied, along with the conditions for stress component equilibrium. However, the approximations [Eqs. (B14) and (B15)] used to develop the simple analytical model restrict the final solutions to first order in Δω. Accordingly, accurate estimates of the 2D elastic stresses along the interface are limited to small deviations from the average position of the interface and small elastic perturbations. These limitations impose two important constraints: the amplitude of the lithium-filled undulation, Δ ≤ 1/ω and the elastic perturbation imposed by plating lithium, δ ≤ ∼0.01Δ. Assuming the SSE is made well (flat, smooth surface), these restrictions are generally consistent with relevant operating conditions.
In accordance with Fig. 2, the proposed solution is specifically developed to match the interface boundary conditions for u y specified in Eq. (B16). A second boundary condition will be cast in two forms to match first the conditions specified by Porz and second the conditions specified by Wang [Reference Porz, Swamy, Sheldon, Rettenwander, Frömling, Thaman, Berendts, Uecker, Carter and Chiang8, Reference Wang, Wolfenstine and Sakamoto12]. Alternatively, Porz seems to be using a zero displacement condition for the u x along the wall of the undulation, which in this model would be described by the interface boundary condition u x = 0 at x = ±π/(2ω) [Reference Porz, Swamy, Sheldon, Rettenwander, Frömling, Thaman, Berendts, Uecker, Carter and Chiang8]. Note the coordinate system adopted here is opposite to that of Porz (the x and y axes are swapped) [Reference Porz, Swamy, Sheldon, Rettenwander, Frömling, Thaman, Berendts, Uecker, Carter and Chiang8]. Subject to the boundary conditions stated earlier and assuming Poisson’s ratio, ν = 1/3 and y ≤ Δ, the position-dependent stress components at the interface, to zero order in δΔω2, predicted by this elastic, 2D analytical solution are found to be
 $${\sigma _{xx}}\left( {{\rm{interface}}} \right) = - {{3E\omega \delta \;\cos \left( {\omega x} \right)} \over {16}}\quad ,$$
 $${\sigma _{yy}}\left( {{\rm{interface}}} \right) = {{{\sigma _{xx}}} \over \nu } = - {{9E\omega \delta \;\cos \left( {\omega x} \right)} \over {16}}\quad ,$$
and
 $${\tau _{xy}}\left( {{\rm{interface}}} \right) = {{3E\omega \delta \;\sin \left( {\omega x} \right)} \over {16}}\quad .$$
This result is consistent with the boundary conditions used by Porz with the caveat that the assumed defect geometry was a slit rather than a small amplitude undulation, and it was considered that the x direction was associated with the largest lithium flux–induced displacement [Reference Porz, Swamy, Sheldon, Rettenwander, Frömling, Thaman, Berendts, Uecker, Carter and Chiang8].
Wang suggests the occurrence of local “hot spots” of increased current density at the lithium/SSE interface leads to an increase in the hydrostatic stress compared with the more uniform stack pressure [Reference Wang, Wolfenstine and Sakamoto12]. The pure hydrostatic stress in the local “hot spot” argued by Wang would be best modeled in the 2D solution with the alternative interface boundary condition, σyy = σxx at x = 0 [Reference Wang, Wolfenstine and Sakamoto12]. Based on these boundary conditions and subject to the constraints stated previously and taking ν = 1/3 and y ≤ Δ, the position-dependent stress components at the interface, to zero order in δΔω2 are found to be
 $${\sigma _{yy}}\left( {{\rm{interface}}} \right) = {\sigma _{xx}}\left( {{\rm{interface}}} \right) = - {{E\omega \delta \;\cos \left( {\omega x} \right)} \over 2}\quad ,$$
and
 $${\tau _{xy}}\left( {{\rm{interface}}} \right) = 0\quad .$$
Equations (16)–(20) satisfy the equilibrium equations for plane strain and produce the expected local increase in hydrostatic compressive stress at x = 0 and an increase in tensile hydrostatic stress (decrease in pressure) at x = ±π/ω. In the case of the Wang boundary conditions, the deviatoric stress component is zero at the interface, but the spatial variation in hydrostatic stress does correlate with the geometry of the undulating interface. We note there is also a significant dependence of the shear stress on the magnitude of the interface undulation, as it is apparent that
 $${{{\rm{d}}{\tau _{xy}}\left( {{\rm{interface}}} \right)} \over {{\rm{d}}\Delta }} = - {{E{\omega ^2}\delta \sin \left( {\omega x} \right)\left( {\cos \left( {\omega x} \right) - 1} \right)} \over 2}\quad ,$$
to first order in the product δΔω2 for ν = 1/3, indicating the zero interface shear stress result will only apply for very small Δ. As implied by Wang, the stress at the SSE interface could develop at a flat section of the interface if the local current density varied about the average current density, without dependence on an interface defect or undulation [Reference Wang, Wolfenstine and Sakamoto12]. In this case, the interface is considered to lie at y = 0 with the same boundary conditions used to determine Eqs. (19)–(21). The 2D elastic solution at the flat interface (y = 0) has the same form as that in Eqs. (19) and (20), but without the interpretive restriction limiting solutions to zero order in δΔω2 as imposed by the interface undulation linearization. Thus, for the flat interface, it is possible to determine the depth for the maximum amplitude of the shear stress in the lithium as 1/ω.
Results and discussion
Using the proposed 2D elastic perturbation model describedpreviously, here, we compare and contrast the state of stress at the interface in a manner that is consistent with the hypotheses presented by Porz, Herbert, Wang, and Swamy [Reference Porz, Swamy, Sheldon, Rettenwander, Frömling, Thaman, Berendts, Uecker, Carter and Chiang8, Reference Herbert, Hackney, Dudney, Thole and Phani9, Reference Herbert, Hackney, Dudney, Thole and Phani10, Reference Swamy, Park, Sheldon, Rettenwander, Porz, Berendts, Uecker, Carter and Chiang11, Reference Wang, Wolfenstine and Sakamoto12]. To that end, we first consider the potential effects of three contributing factors: high homologous temperatures, the application of an externally applied stack pressure, and the availability of vacancies in a nonuniform hydrostatic stress field. Within that collective framework, the steady-state value of the maximum elastic displacement at x = 0 is determined as a function of the average current density at the interface. Additional insight from nanoindentation experiments is presented to further elucidate the significance of length scale and the viability of local stress relief by self-diffusion in the presence of a spatially varying hydrostatic compressive stress field. These insights directly enable identification of the critical defect dimensions potentially associated with mechanical failure of the SSE. A direct outcome of the presented analysis is the prospect of additional interfacial stress relief provided by the time-dependent properties of the SSE. Examining that possibility, preliminary measurements of the stress exponent for creep in the glass electrolyte LiPON are presented and rationalized. LiPON, rather than LLZO, was selected for this preliminary investigation because of its well-documented ability to provide long and efficient cycling of lithium in thin film batteries [Reference Bates, Dudney, Neudecker and Evans35, Reference Dudney36].
Effects of a high homologous temperature, T H
At room temperature, 22 °C, lithium is at a T H of 0.65. Sustained at T ≥ 22 °C, lithium is in a continuous state of annealing, reducing its dislocation density and increasing its average grain size. At these temperatures, lithium is also within the hot-working regime, where recovery processes occur simultaneously during plastic deformation. The net effect is that at T ≥ 22 °C lithium can sustain large plastic strains with little or no significant strain hardening. The mechanism by which softening simultaneously takes place in most body-centered cubic (BCC) metals is dynamic recovery, which occurs by the formation of well-developed, fine (approximately 1–10 μm) subgrain dislocation structures enabled by accelerated diffusion processes. Specifically, it is the ease of cross slip, climb, and dislocation unpinning that enables the annihilation of dislocation pairs during deformation and the creation of the recovery substructure. At a fixed temperature, the driving force for the diffusive recovery of pure metallic lithium is the amount of stored strain energy. Although the recovery rate depends primarily on temperature and the amount of strain, the strain rate can be a contributing factor as well. As recently reported by LePage, data from tensile experiments performed at temperatures ranging from 198 to 398 K (0.44 ≤ T H ≤ 0.88) and strain rates spanning from 4 × 10⁻⁵ to 2 × 10⁻² s−1 clearly illustrate the effects of temperature, strain rate, and dynamic recovery in bulk lithium [Reference LePage, Chen, Kazyak, Chen, Sanchez, Poli, Arruda, Thouless and Dasgupta13]. Only at the lowest temperature, strain hardening is observed. In addition, Masias et al. have reported similar experimental observations from recent tensile tests performed on lithium at room temperature [Reference Masias, Felten, Garcia-Mendez, Wolfenstine and Sakamoto14]. Whereas the uniaxial compression data presented by Masias does show work hardening, it is not immediately clear to what extent the experimental observation may be controlled by the effect of friction at the interface between the test specimen and the compression platens [Reference Masias, Felten, Garcia-Mendez, Wolfenstine and Sakamoto14].
In the context of high T H and dynamic recovery, two important outcomes arise from the LePage and Masias results in relation to the stress-directed flow of lithium in a battery [Reference LePage, Chen, Kazyak, Chen, Sanchez, Poli, Arruda, Thouless and Dasgupta13, Reference Masias, Felten, Garcia-Mendez, Wolfenstine and Sakamoto14]. First, it is expected that the dislocation density in both the bulk lithium and lithium-filled defects at the SSE interface is quite low, regardless of the strain required to accommodate any shape change associated with initially filling an interfacial defect with metallic lithium. At sustained T ≥ 22 °C, continuous annealing will further diminish the dislocation density and effectively eliminate any potential strain rate effects. The important implication is that at T ≥ 22 °C, deformation mechanisms that rely on dislocation glide at the interface or within an interfacial defect may not be an effective means of alleviating pressure, particularly at small length scales where the probability of finding a dislocation may be quite low.
Effects of an externally applied compressive stack pressure, σsp
An externally applied σsp (nominally ∼7σy for bulk polycrystalline lithium when it is initially applied) is often used to promote adhesion and mitigate the formation of voids at the lithium/SSE interface [Reference Wang, Wolfenstine and Sakamoto12, Reference Dudney25]. Although σsp can clearly drive the flow of metallic lithium, it does so only to the extent that friction at the interface and the equilibrium aspect ratio a/t will allow, where a is the radius of contact between a flat circular SSE disk and the lithium source layer (anode) and t is the thickness of the lithium layer [Reference Dieter37]. Explicit assessment of the most deleterious stress conditions are directly enabled by the hot-forming literature, which provides a relevant source for considering the macroscopic aspects of this large length scale deformation process without requiring detailed knowledge regarding how the stack pressure is physically applied [Reference Dieter37].
As pointed out by Wang, a natural consequence of σsp is a zone of hydrostatic compression within the lithium anode [Reference Wang, Wolfenstine and Sakamoto12]. Accurate analytical descriptions of the resulting state of stress at the interface are illusive, as the stress components depend significantly on the friction conditions (Coulombic, sticking or an interface shear strength or a combination thereof) and the ratio of a/t. Factors such as, but not limited to, physical lateral constraints and the elastic properties of the SSE and current collectors may further complicate the analysis as well. Despite these complexities, important observations regarding the effects of stack pressure can be made subject to a number of simplifying assumptions. Here, we assume the SSE and the current collector on opposite sides of the lithium anode behave as rigid compression platens, that the metallic lithium mirrors the axial symmetry of the SSE disk and that under σsp, if the metallic lithium plastically deforms, it does so homogeneously by a combination of dislocation glide and climb through intragranular dislocation mechanisms with a stress exponent n ≥ 3. Under these conditions, the compressive principal stresses in the metallic lithium are σz and σr = σθ (due to axial symmetry), where the subscripts z and r denote, respectively, the direction normal to the lithium/SSE interface and the radial direction, r, outward from the axis of symmetry (σr is a compressive hoop stress due to the friction at the interface). It follows then that at equilibrium the average value of σz = σsp (energy balance) and the radially dependent hydrostatic stress, σH = (σz + 2σr)/3. Before electrochemical cycling, an equilibrium ratio of a/t is established in a manner that reflects balancing between the externally applied stack pressure and friction at the interface. Stresses in the lithium at the outer edge of the anode (radial position, r = a) are σz ∼ σy, σr ∼ 0, and σH ∼ σy/3, where σy = ∼0.5 MPa. At the center of the disk (r = 0), σz, σr, and σH peak in a manner that depends significantly on the friction conditions and the equilibrium aspect ratio of a/t [Reference Dieter37].
If application of the external stack pressure initiates plasticity, then t naturally decreases and conservation of volume forces the radial outward flow of lithium until the drop in pressure is balanced by friction at the interface, at which point the equilibrium value of a/t is established. Under subsequent electrochemical cycling, the required force balance only permits the compressive stack pressure to drive the flow of metallic lithium when a/t is less than the equilibrium value. Assuming the friction conditions do not change, the magnitude of a will reach a steady-state value that is determined by the maximum amount of lithium ever plated to the anode during cycling. Assuming t max is not exceeded with further cycling, then the steady-state value of a is fixed (a max) and although a max/t increases and decreases with cycling, the ratio never dips below the equilibrium value. Subject to these constraints, once the equilibrium value of a max/t is achieved, the resultant compressive stack pressure is not capable of driving dislocation-mediated flow or creep in lithium with a stress exponent n ≥ 3. The magnitude of the individual stress components σz, σr, and σH will change with radial position, but a basic energy balance (assuming equilibrium) dictates that the average value of σz = σsp regardless of a max/t, and, thus, the average values of σr and σH can never be more than σsp. The important implication is that as a max/t increases during discharge (the lithium anode becomes thin relative to the fixed contact radius, a max, with the SSE), the radially dependent values of σz, σr, and σH in the lithium anode will increase, but only in such a way that the gradients in each component result in an average σz = σsp and, therefore, an average σr and σH ≤ σsp. We also note that as the radially dependent values of σz, σr, and σH increase with a max/t, the average state of stress becomes increasingly hydrostatic as σr becomes similar in magnitude to σz.
Subject to the constraints and assumptions associated with the analysis described earlier, an important outcome is that the hydrostatic stress field in a lithium anode under an externally applied compressive stack pressure is not uniform. Moreover, the gradient in hydrostatic stress with radial position inherently increases with a max/t during electrochemical cycling. We also note that regardless of the changes in a max/t with cycling, the average hydrostatic stress will never be more than σsp, which is typically less than 5 MPa [Reference Dieter37]. As pointed out by Wang, significant decreases in the self-diffusion rates of sodium and indium have been experimentally observed under uniform hydrostatic compression ranging from 120 to 960 MPa [Reference Wang, Wolfenstine and Sakamoto12]. We note the self-diffusion coefficient of a pure metal subjected to a uniform hydrostatic stress decreases in a manner that reflects a concurrent drop in the equilibrium vacancy concentration, C veq, [Eq. (22)] and is estimated to have the form shown in Eq. (23),
 $${C_{{\rm{veq}}}} = {C_{{\rm{vo}}}}\exp \left( {{{\Omega {\sigma _{\rm{H}}}} \over {{k_{\rm{B}}}T}}} \right)\quad ,$$
 $$D = {D_{\rm{o}}}\exp \left( {{{\Omega {\sigma _{\rm{h}}} - {{{Q_{\rm{d}}}} / {{N_{\rm{A}}}}}} \over {{k_{\rm{B}}}T}}} \right)\quad ,$$
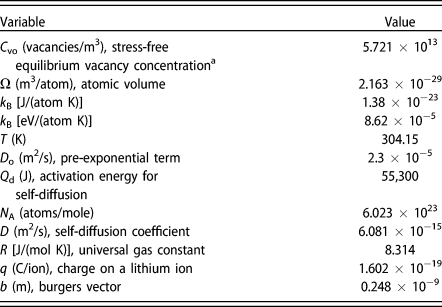
where C vo is the stress free equilibrium vacancy concentration (vacancies/m3), D o is the pre-exponential term (m2/s), Q d is the activation energy for self-diffusion (J/mol), and N A is Avogadro’s number (atoms/mol) [Reference Dieter37]. Based on the input values in Table II, the decrease in the self-diffusion coefficient associated with a uniform hydrostatic compressive stress of 5 MPa is 2.5%. As such, it seems unlikely that a nonuniform stress field with an average compressive σH ≤ 5 MPa will have a significant impact on the self-diffusion coefficient of lithium unless the vacancy concentration drops well below the equilibrium value defined in Eq. (22). It is important to note that if the equilibrium vacancy concentration within a hydrostatic stress gradient is maintained via the action of vacancy sources, such as the incoherent lithium/SSE boundary, grain boundaries and/or dislocations, then the local flux of lithium is driven solely by the chemical potential gradient of the lithium atoms [Reference Larche and Cahn38, Reference Suezawa, Saitoh, Kojima and Kasuya39, Reference van Loo, Pieraggi and Rapp40]. The details of lithium diffusional creep with the relevant stress gradient length scale under discussion has been described in Ref. Reference Herbert, Hackney, Dudney, Thole and Phani9 and Reference Herbert, Hackney, Dudney, Thole and Phani10 and found to predict the observed length scale (indentation depth) and strain rate–dependent hardness of lithium.
Variables and values.

a Activation energy for vacancy formation = 0.9 eV/atom and density = 0.534 g/cm3 [Reference Suezawa, Saitoh, Kojima and Kasuya39].
Vacancy annihilation and nonequilibrium vacancy concentrations
In an attempt to rationalize the experimentally measured current densities at the point of SSE failure (short circuiting) in a symmetric lithium/LLZO/lithium cell, it was recently suggested that regardless of the type or chemistry of the SSE, the self-diffusion of lithium may be the controlling mechanism in determining the CCD at which failure of the SSE occurs [Reference Wang, Wolfenstine and Sakamoto12]. As argued by Wang, the flux of vacancies to the lithium/SSE interface may be insufficient to meet the demand of incoming lithium ions (particularly at high current densities), thereby enabling localized, nonplanar lithium plating to occur above the average plane of the lithium/SSE interface [Reference Wang, Wolfenstine and Sakamoto12]. We further note that Krauskopf et al. have recently considered the role of diffusional creep in determining the morphology of the lithium/SSE interface as well, but their analysis is applied to the process of stripping rather than plating [Reference Krauskopf, Hartmann, Zeier and Janek41].
As pointed out by Wang, regardless of whether the point effect of diffusion occurs at an interface defect or at a flat region of the interface or whether σsp ≥ 0, gradients in the hydrostatic stresses will influence the flux of vacancies [Reference Wang, Wolfenstine and Sakamoto12]. What is not immediately clear, however, is to what extent the lithium deposition at the interface diminishes the concentration of vacancies. Wang appears to argue that the vacancy concentration drops well below the equilibrium value defined in Eq. (22) based on the kinetics of vacancy annihilation as the lithium is plated at the lithium/SSE interface [Reference Wang, Wolfenstine and Sakamoto12]. However, most studies into the electromigration phenomenon, which has similar physics, have argued that the vacancy concentration is close to the equilibrium concentration [Eq. (22)] [Reference Blech42, Reference Blech and Herring43, Reference Shatzkes and Lloyd44, Reference Kirchheim and Kaeber45, Reference Clement and Lloyd46, Reference Tu47, Reference Ross48, Reference Kirchheim49, Reference Korhonen, Borgesen, Tu and Li50]. To address the efficacy of diffusion-based stress relaxation under conditions of a local increase in hydrostatic stress confined to small volumes, we submit the discussion should refer to relevant experimental results and applicable findings from the field of electromigration.
As previously described, nanoindentation experiments provide a unique and direct opportunity to consider the possibility of small length scale diffusional relaxation of a local hydrostatic stress in lithium at a rigid interface. As revealed by both analytical and numerical approximations such as the ECM and FEA, both spherical and pyramidal indentation of elastic and elastic plastic solids creates a zone of hydrostatic compression directly beneath the indenter tip [Reference Bower28, Reference Zarudi, Zhang, Cheong and Yu51]. According to FEA, the decay length of the hydrostatic stress field is approximately on the order of the indentation depth [Reference Zarudi, Zhang, Cheong and Yu51]. In this way, the indentation experiments provide a unique opportunity to examine how stress in the lithium could relax by diffusive flow under conditions of a local hydrostatic stress gradient at a nearly rigid interface. In relation to the operation of a battery, the indentation displacement rate, dh/dt, would be analogous to the local increase in the lithium plating rate at the SSE interface because of the point effect of diffusion [Eq. (4)], whereas the mean pressure the lithium surface can support is simultaneously measured through the hardness.
At small length scales (h ≤ ∼350 nm), the nanoindentation observations of Herbert et al. reveal the physics of lithium stress relaxation scale with the indenter tip velocity, which is taken to be analogous to the lithium displacement rate at a local “hot spot” at the lithium/SSE interface [Eq. (4)] [Reference Herbert, Hackney, Dudney, Thole and Phani9]. From the experimental study in Ref. Reference Herbert, Hackney, Dudney, Thole and Phani9, at h = 350 nm, the measured tip velocity dh/dt = 2.6 nm/s. The analogy with the local increase in current density through Eq. (4) gives |Δi| = |i|(Δo,a) = 1.9 mA/cm2. Under these conditions, the mean pressure supported by lithium is measured at ∼40 MPa, which is nearly two orders of magnitude greater than σy for bulk lithium (∼0.5 MPa), indicating that dislocation plasticity is not operating under these conditions.
Although indeed a relatively large pressure, the measured H of 40 MPa only corresponds to at most 14% of the theoretical shear strength of lithium (rigid slip, i.e., ex nihilo dislocation nucleation). This observation assumes the shear stress, τ, required to initiate rigid slip ranges from G/(2π) to G/30, where the shear modulus, G = 4.25 GPa, τmax = σy/2 (Tresca’s yield criteria), H = Cσy, and the constraint factor, C = 1. In addition, we note 40 MPa is 18 times lower than the minimum elastic stress limit predicted by Sneddon’s theoretical load–displacement relationship, thus negating the possibility of elastic stress relaxation [Reference Sneddon52]. This observation assumes a rigid indenter tip, E = 9 GPa, Poisson’s ratio, ν = 0.362, the equivalent cone angle, ψ = 70.32°, and the contact depth, h c = h. The apparent paradox of insignificant dislocation-mediated plasticity at small length scales was resolved in Ref. Reference Herbert, Hackney, Dudney, Thole and Phani9 by correlating the H–h behavior at low indentation depths to the self-diffusion length scale and an analogue of the Nabarro–Herring creep mechanism (volume diffusion to the free surface).
Through the representative H–h data presented in Figs. 1(a) and 1(b), two distinctly different mechanisms of stress development are revealed as a function of h. At small length scales, H increases with depth in a manner that has been rationalized by atomic diffusion analogous to Nabarro–Herring creep, with an effective ‘grain size’ given by the contact radius (∼2.8h for the equivalent cone). As previously noted, H peaks at a value significantly greater than σy for bulk lithium, but much lower than the stress corresponding to either the theoretical shear strength or the pressure associated with purely elastic deformation. The precipitous drop in H immediately following the peak stress signals a distinct transition to a second deformation mechanism, hypothesized to be dislocation-mediated flow enabled by the operation of a dislocation multiplication source. Interpretation of the H–h behavior observed in BCC lithium is aided by direct comparison to the H–h behavior observed in BCC iron, which is shown in Fig. 1(b). As both figures show, the general trend in H versus h between lithium and iron is quite similar. Whereas the difference in stress is nominally expected, the difference in length scales (indentation depth) at the sudden decrease in H is astonishing. Interpretation of the H–h behavior of iron [Fig. 1(b)] is well documented [Reference Pharr, Herbert and Gao19, Reference Soman, Herbert, Aifantis and Hackney53]. In broad brushstrokes, the initial build up of pressure at small depths is uniquely related to the elastic properties of iron and the effective radius of the Berkovich indenter tip. The peak in H is representative of the onset of plastic flow, either by dislocation nucleation or propagation of existing dislocations. Immediately after the abrupt drop in pressure, the more gradual decrease in H with increasing depth is a phenomenon known as the indentation size effect, which is rationalized in the context of a strain gradient imposed by the indenter tip geometry. Although Herbert et al. have interpreted lithium’s H peak and subsequent depth dependence in a similar manner, the dramatic increase in the h/H ratio for the transition to dislocation-mediated flow in lithium is rationalized in the context of high T H deformation, specifically diffusion creep stress relaxation (n = 1) at indentation depths below the sudden decrease in H [Reference Herbert, Hackney, Dudney, Thole and Phani9]. The point to be emphasized here is that the transition to dislocation-mediated flow as a stress relief mechanism in lithium can be frustrated if the stressed volume is ‘small’ in relation to the proximity of existing dislocations or a dislocation source.
Perhaps the simplest argument to demonstrate this concept is that of a pre-existing dislocation source threading through a constrained spherical volume in which a nonuniform internal shear stress is elevated relative to the surrounding volume. The existing dislocation can only bow out and multiply to relieve the localized pressure if τ > ∼3 Gb/R sv, where R sv is the radius of the spherical volume [Reference Kraft, Gruber, Mönig and Weygand17]. Note that because of the nonuniform stress field, the shear stress criteria require the separation distance between the dislocation pinning points (the dislocation line length) to be expressed as a fraction of R sv, as the multiplication process requires sufficient room to physically operate. Here, we generously estimate the separation distance to be 2/3R sv. If R sv is analogous to a hemispherical cap enclosing a residual hardness impression, then the equivalent cone gives the radius of the spherical volume as h tan ψ. Assuming 350 nm represents the depth required to initiate the multiplication process, then R sv = 978.6 nm. This suggests a pre-existing dislocation density greater than 3.3 × 10¹¹ m−2 (a moderately cold worked metal) is required to provide a high probability that a dislocation is available for dislocation glide/climb–induced stress relief within the stressed volume. Similarly, El-Awady has proposed that the minimum shear stress for plasticity within a confined volume of 1 µm in diameter will correspond to a dislocation density on the order of 1012 m−2 [Reference El-Awady54]. At sustained T ≥ 22 °C, these dislocation densities in pure lithium are highly unlikely given the continuous annealing and recovery process that takes place at T H ≥ 0.65.
The nanoindentation results suggest that diffusion creep via self-diffusion of lithium is active at small length scales although the displacement rate and stress are ‘large.’ However, as the length scale of the local deformation and strain rate continues to increase, so does the hydrostatic stress, at least until local dislocation plasticity is activated. Nevertheless, the indentation results can be rationalized through a simple increase in diffusion length rather than a dramatic decrease in the availability of vacancies, suggesting that diffusional creep remains a viable stress relief mechanism for lithium at room temperature even in the presence of a high frequency spatial variation in the hydrostatic stress.
The depletion of vacancies in a local region of hydrostatic compression has also been considered in some detail by the electromigration/line stress community beginning in the 1990s [Reference Blech42, Reference Blech and Herring43, Reference Shatzkes and Lloyd44, Reference Kirchheim and Kaeber45, Reference Clement and Lloyd46, Reference Tu47, Reference Ross48, Reference Kirchheim49]. Although there are some differences in the geometry and origin of the stress development between electromigration and lithium deposition under a rigid electrolyte, the physics are directly relevant to the lithium/SSE interface. A quantitative argument related to vacancy supply can be developed by considering a locally increased hydrostatic pressure developed at x = 0 having a hydrostatic stress variation about a local region of length scale, L, such that an equilibrium vacancy concentration varies with position as
 $${C_{{\rm{veq}}}}\left( x \right) = {C_{{\rm{veq}}}}\left( \infty \right)\exp \left( {{{\Omega {\sigma _{{\rm{H}}\;{\rm{max}}}}} \over {{k_{\rm{B}}}T}}\exp \left( { - {x \over {2L}}} \right)} \right)\quad ,$$
where C veq(∞) is the equilibrium concentration of vacancies (vacancies/m3) far from x = 0 and σH max is the hydrostatic stress at x = 0. The detailed derivation of Eq. (24) is available in Appendix C. Taking C veq(∞) = 5.7 × 10¹³ vacancies/m3 at T = 304.15 K and σH max = −50 MPa, Eq. (24) predicts the decrease in vacancy concentration at x = 0 to be ∼23%. Here, it is assumed σH max is 10 times the maximum average hydrostatic stress, noting the actual magnitude is unknown because of its dependence on the friction conditions and the ratio of a max/t, 50 MPa corresponds to the upper limit of the maximum H measured by nanoindentation where the Nabarro–Herring type diffusional creep can still be used to rationalize the experimental observations.
Wang further suggests there is a deviation in vacancy concentration from the equilibrium distribution due to the plating of lithium at the lithium/SSE interface [Reference Wang, Wolfenstine and Sakamoto12]. This general idea has also been considered in the electromigration field where the vacancy annihilation correlates with electromigration-induced atomic fluxes into constrained volumes. However, Korhonen has suggested the stress effects on diffusivity are very limited in the electromigration phenomena [Reference Korhonen, Borgesen, Tu and Li50]. That is, electromigration would not be a problem plaguing the electronics industry if there were no vacancies because of rapid annihilation and, thus, no atomic substitutional diffusion. For a vacancy source such as a dislocation, grain boundary, surface, or interface at a distance d from the increase in local hydrostatic stress, with d > L, the following expression gives a linear approximation to the vacancy flux [vacancies/(m2 s)] to the stressed volume,
 $$\eqalign{{J_{{\rm{Vacancy}}\;{\rm{supply}}}} \cr= M\left[ {{k_{\rm{B}}}T\left( {{{{C_{{\rm{veq}}}}\left( d \right) - {C_{\rm{V}}}\left( 0 \right)} \over d}} \right) - {C_{\rm{V}}}\left( 0 \right)\Omega {{{\sigma _{{\rm{H}}\;{\rm{max}}}}} \over L}} \right]\quad ,$$
where M is the mobility of vacancies, M = D/(k BT) [(m2 atom)/(J s)], C veq(d) is the equilibrium concentration of vacancies at position d (vacancies/m3), and C V(0) is the nonequilibrium vacancy concentration (vacancies/m3) at x = 0 (see Appendix C). As per Eq. (25), even as C V(0) goes to zero (which would violate the laws of thermodynamics), there is still a flow of vacancies coming to (and atom flow away from) the stressed volume with a local increase in hydrostatic pressure. Although the complex relationship between σH max and L is not addressed here, Eqs. (24) and (25) indicate that flux increases significantly with large gradients in stress produced by the combination of a large magnitude of σH max and a small length scale over which the stress acts. In the cases of indentation and lithium plating, we also note the presence of the incoherent lithium/indenter and lithium/SSE interface provides an efficient source of vacancies such that the vacancy concentration remains close to that predicted by equilibrium [Reference Gleiter55]. Collectively, these observations suggest the supply of vacancies to ‘small’ stressed volumes at the lithium/SSE interface will not be significantly diminished by the local hydrostatic stress imposed by the compressive stack pressure, the higher levels of stress in locally deformed lithium as measured by nanoindentation or the deposition of lithium. In addition to bulk self-diffusion, the presence of the incoherent lithium/SSE interface must also be considered as a diffusion path. In this case, any atomic ledges of lithium at the interface provide unique pathways for pipe diffusion, which can be a conservative process that does not require vacancies and, thus, creates a fast transport path for the self-diffusion of lithium away from regions of relatively high stress at the interface [Reference Swinburne, Arakawa, Mori, Yasuda, Isshiki, Mimura, Uchikoshi and Dudarev56, Reference Liu, Li, Shao, Gong, Wang, McCabe, Jiang and Tomé57].
Elastic displacement at the epicenter for the point effect of diffusion (δ at x = 0)
As per Eqs. (8) and (9), it is apparent that all the stress components defined in Eqs. (16)–(20) depend linearly on the elastic normal displacement at the interface, δ. We now use the typical approach to diffusional creep that considers the difference in displacement velocity across a boundary to give the elastic displacement at the boundary. For a slowly changing chemical potential field,
 $${\nabla _{x,x}}{\theta _{\rm{a}}} + {\nabla _{y,y}}{\theta _{\rm{a}}} = 0\quad ,$$
and
 $${\theta _{\rm{a}}} = {\mu _{\rm{a}}}\left( {x,y} \right) - {\mu _{{\rm{ao}}}}\quad ,$$
with θa defined in Eq. (27) as the relative chemical potential, μa(x, y) as the spatial dependence of the lithium chemical potential due to a nonuniform stress, and μao as the chemical potential of the lithium in a uniform (stress) system, all in units of J/atom. The solution consistent with the interface symmetry used here is
 $${\theta _{\rm{a}}} = \alpha \cos \left( {\omega x} \right)\exp \left( {\omega y} \right)\quad ,$$
where the boundary condition on the undulating interface is from Eq. (17) (Porz boundary condition)
 $${\mu _{\rm{a}}}\left( {{\rm{interface}}} \right) - {\mu _{{\rm{ao}}}} = - \Omega {\sigma _{yy}}\left( {{\rm{interface}}} \right) = \Omega {{9E\omega \delta } \over {16}}\quad ,$$
giving
 $$\alpha = \Omega {{9E\omega \delta } \over {16}}\quad ,$$
or similarly for the Wang [Reference Wang, Wolfenstine and Sakamoto12] boundary condition [Eq. (17)]
 $$\alpha = \Omega {{E\omega \delta } \over 2}\quad ,$$
where α is the magnitude of the chemical potential increase (J/atom) due to the elastic displacement, δ, as may be discerned by examining Eqs. (27) and (28). The flux of atoms normal to the surface on the lithium side of the boundary at the interface is
 $${J_{\rm{n}}}\left( {{\rm{Li}}} \right) = {M \over \Omega }\left( {{{{\rm{d}}{\theta _{\rm{a}}}\left( {{\rm{interface}}} \right)} \over {{\rm{d}}y}}} \right) = - {D \over {\Omega {k_{\rm{B}}}T}}\alpha \omega \;\cos \left( {\omega x} \right)\quad .$$
The flux of atoms normal to the surface on the SSE side of the boundary is given by either Eq. (10) or (14). Now, we can solve for the elastic displacement, δ, specifically at x = 0 on the undulating interface due to diffusional creep,
 $${{{\rm{d}}\delta } \over {{\rm{d}}t}} = \Omega {{\left| i \right|} \over q}\Delta \omega - {D \over {{k_{\rm{B}}}T}}\alpha \omega \quad .$$
It is then recognized that the magnitude of all the stress components depends on δ:
 $$\delta = {{16{k_{\rm{B}}}T\left| i \right|\Delta } \over {9DE\omega q}}\left[ {1 - \exp \left( { - {{9E\Omega D{\omega ^2}} \over {16{k_{\rm{B}}}T}}t} \right)} \right]\quad .$$
Under steady-state conditions (rate of lithium ions arriving at the interface equals the rate of lithium atoms diffusing away), the steady-state value of δ can be determined by replacing α in Eq. (33) with Eq. (30) or (31) and setting Eq. (33) equal to zero or by letting t go to infinity in Eq. (34). In this way, the derivation presented here provides an explicit description of the steady-state elastic displacement of lithium (at x = 0) created by the point effect of diffusion in relation to the average current density and the diffusional creep relaxation process. As per the proposed model, this elastic displacement is the physical source of the localized stress intensification acting at the lithium/SSE interface during plating.
Direct comparisons between the leading hypotheses describing the state of stress at the lithium/SSE interface
As pointed out by Swamy, the equilibrium state of electrochemically generated stress within a lithium-filled defect at the interface has an upper bound that, here, we describe in relation to the average current density at the interface [Reference Swamy, Park, Sheldon, Rettenwander, Porz, Berendts, Uecker, Carter and Chiang11]. From Eq. (34), it is apparent that after sufficient time is allowed to achieve equilibrium conditions at a fixed temperature, the steady-state elastic displacement, δSS, at the apex of the defect (x = 0) is uniquely related to the defect geometry (Δ and ω), the average current density at the interface, and the elastic modulus of the lithium-filled defect.
By relating Δ and ω to  $\bar{h}$ and the maximum shear stress controlled by Nabarro–Herring creep to
 $\bar{H}$, Eq. (2) gives the critical elastic deflection, δcritical, at the transition point from diffusion- to dislocation-mediated flow. Details of this derivation are provided in Appendix D. The enabling analogy is that 1/4 of the defect wavelength (π/(2ω), which corresponds to the defect geometry that is under compression, represents the indentation contact radius at the transition point. Using the equivalent cone geometry for the Berkovich indenter (ψ = 70.32°), the contact radius is 2.8h and, thus,
 $\bar{h} = {{\left( {2\pi } \right)} / {\left( {11.2\omega } \right)}}$. Because the constraint factor relating H and the flow stress is taken to be 1 (as per our hypothesis, there is no plastically deformed volume of material beneath the indenter i.e., elastically constrained), then the maximum shear stress required to initiate the transition is taken to be H/2 (Tresca’s maximum shear stress yield criterion), which is given by Eq. (18) when x = 0, and, therefore, H = 6/16Eωδ. Substituting for
 $\bar{H}$ and
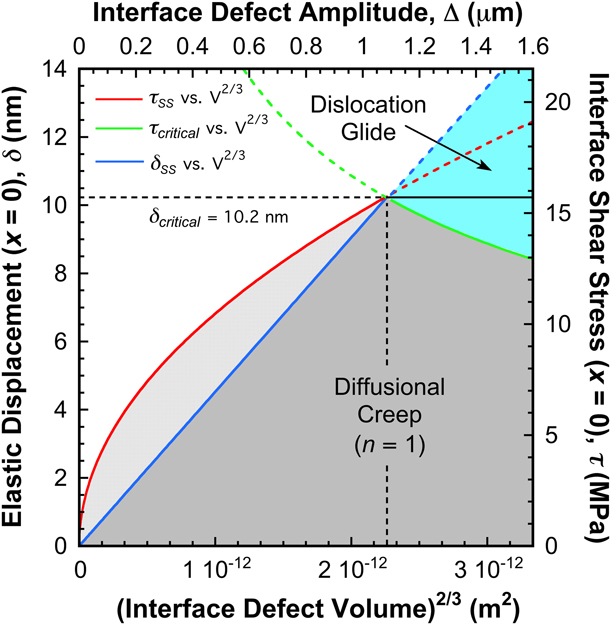
 $\bar{h}$ in Eq. (2), δ then becomes the critical elastic deflection at the transition point from diffusion- to dislocation-mediated flow, giving δcritical = 91.7/E. Derived in this way, δcritical is expressed as a unique function of E because its dependence on the average current density at the interface is inherently incorporated through Eq. (2) and the constant term, 19.3 N/m. As such, the derivation is limited to the operating temperature of 31 °C. Given lithium’s large shear anisotropy factor (A = 8.4), 3 ≤ E ≤ 21 GPa, and, thus, δcritical ranges from ∼30.6 to 4.4 nm depending on the crystallographic orientation of the lithium within the defect.
For the illustrative purposes of Fig. 2, here, we take the average planar current density to be 1 mA/cm2 (a commonly observed CCD that causes failure), assume the sharpest defect geometry the model’s small strain assumption will allow (Δ = 1/ω and the ratio of defect wavelength to amplitude, N = λ/Δ, is minimized at 2π), and set δ = δcritical = 10.2 nm (this assumes E = 9 GPa). In doing so, the defect geometry becomes fixed through Eqs. (D1) and (D2) such that ω = 9.124 × 10⁵ m−1 and Δ = 1.096 × 10⁻⁶ m. Assuming  $\bar{h}$ is representative of the critical length scale required to make the transition from diffusion- to dislocation-mediated flow, a rough estimate of the least volume required to activate the dislocation multiplication/nucleation mechanism is the smallest hemispherical cap that encloses the residual hardness impression at
 $\bar{h}$. Ignoring the strain rate effects and taking
 $\bar{h} = 350\;{\rm{nm}}$, the minimum activation volume is 1.3 μm3. By comparison, the fraction of defect under compression (−π/(2ω) ≤ x ≤ π/(2ω)) has a volume of (π3Δ)/(12ω2) = 3.4 μm3, which is ∼2.6 times larger than the smallest hemispherical cap enclosing a residual hardness impression at the average depth corresponding to the hypothesized transition from diffusion- to dislocation-mediated flow.
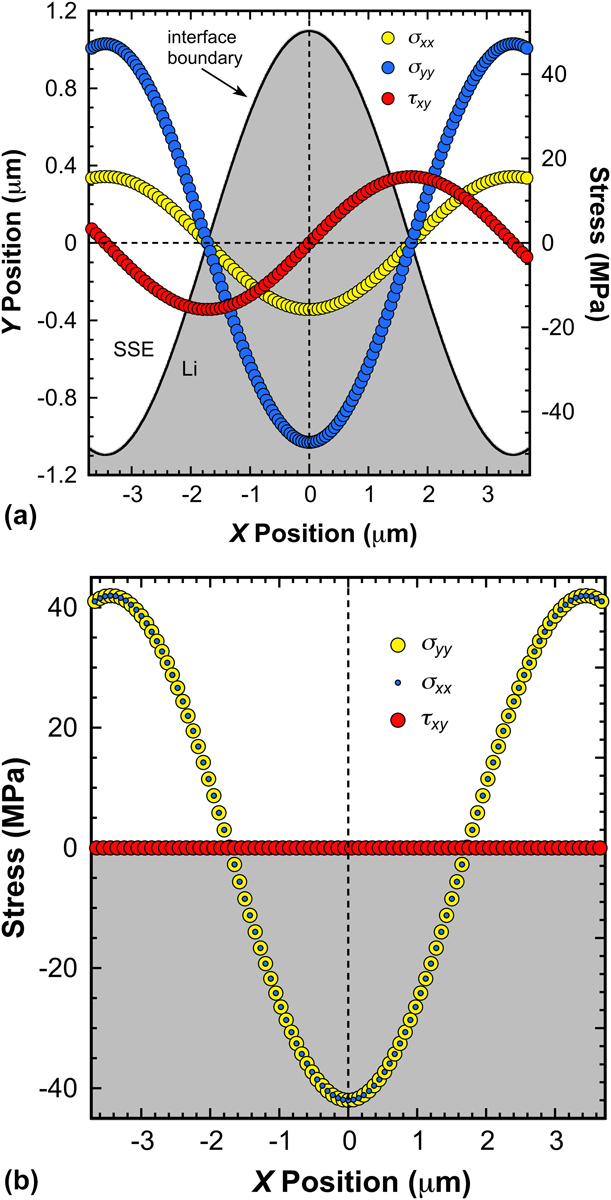
As predicted by Eqs. (16)–(20), Figs. 3(a) and 3(b) directly compare the elastic stress distribution at the interface in a manner that reflects several leading hypotheses for SSE failure. Figure 3(a) shows stresses consistent with the hypotheses and boundary conditions proposed by Porz, Herbert, and Wang for a lithium-filled defect at the interface [Reference Porz, Swamy, Sheldon, Rettenwander, Frömling, Thaman, Berendts, Uecker, Carter and Chiang8, Reference Herbert, Hackney, Dudney, Thole and Phani9, Reference Herbert, Hackney, Dudney, Thole and Phani10, Reference Swamy, Park, Sheldon, Rettenwander, Porz, Berendts, Uecker, Carter and Chiang11]. The defect geometry is that of Fig. 2, which is described earlier. Figure 3(b), on the other hand, shows stresses representative of the hypotheses and boundary conditions proposed by Wang for a flat interface [Reference Wang, Wolfenstine and Sakamoto12]. We note the SSE failure conditions described by Swamy are generally consistent with Wang’s flat interface hypothesis as well [Reference Swamy, Park, Sheldon, Rettenwander, Porz, Berendts, Uecker, Carter and Chiang11, Reference Wang, Wolfenstine and Sakamoto12]. For Figs. 3(a) and 3(b), the battery-relevant conditions yielding the predicted stresses are |i| = 1 mA/cm2, E = 9 GPa, and T = 304 K.
The predicted 2D stress components at (a) an undulating and (b) flat interface. For (a), the defect geometry is that of Fig. 2. For both (a) and (b), the elastic modulus of lithium and the average current density at the interface are taken to be 9 GPa and 1 mA/cm2, respectively.
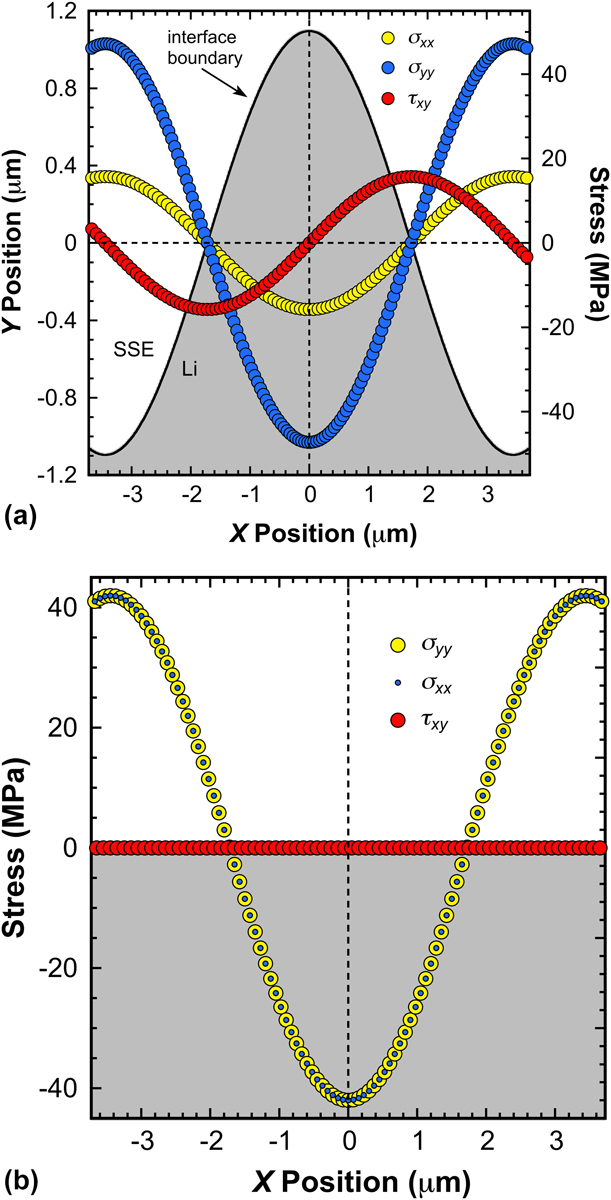
As Figs. 3(a) and 3(b) show, much of the predicted stress is well above σy for bulk polycrystalline lithium (∼0.5 MPa). Recalling the previously reported nanoindentation and micropillar experiments, both of which reveal lithium’s unexpectedly high strength at small length scales and high T H, we submit the predicted stresses can be achieved on the basis of the hypothesis presented in section “Informed guidance from nanoindentation, past and future”, which in broad brushstrokes states that within a ‘small’ volume of lithium (∼3.4 μm3) at the lithium/SSE interface (nonplanar or planar), an increase in pressure due to preferential plating approaches the theoretical strength limit of lithium because diffusive flow mechanisms limit stress relief when the probability of finding a mobile dislocation or operable dislocation source within the locally stressed volume is low [Reference Herbert, Hackney, Dudney, Thole and Phani9, Reference Herbert, Hackney, Dudney, Thole and Phani10, Reference Xu, Ahmad, Aryanfar, Viswanathan and Greer16]. Of significant importance, we note that Fig. 3(a) indicates the possibility of dislocation-mediated flow outside the apex of the undulation, as the xy shear stresses reach a maximum between the apex and root of the undulation (x = ±π/(2ω)). At the apex (x = 0), it is apparent there is a significant deviatoric stress component in an orientation other than principal coordinate system of Fig. 2. The predicted gradients in stress also provide ample driving force for the self-diffusion of lithium away from the compressively stressed regions of the interface (−π/(2ω) ≤ x ≤ π/(2ω)). Across the interface, the corresponding stress in the SSE at the apex (x = 0) is a mode I tensile stress equal in magnitude to σxx. Figure 3(b), on the other hand, shows that for the elastic displacement imposed here, δcritical, the resulting stress at the flat interface is entirely hydrostatic, indicating dislocation-mediated flow within the critically stressed volume at a flat interface is significantly more limited. The gradient in hydrostatic stress, however, still provides ample driving force for the diffusive flow of lithium away from the compressively stressed regions of the interface. As with the defect (nonplanar) interface, the corresponding stress in the SSE at the epicenter for the point effect of diffusion (x = 0) is a mode I tensile stress equal in magnitude to σxx, which for the flat interface is ∼2.7 times larger than that of the nonplanar interface.
Although the predicted stresses in Figs. 3(a) and 3(b) are quite large relative to σy, we note the small strain assumption imposed by the analysis method limits the model’s applicability to defects with a ratio of wavelength to amplitude, N = λ/Δ ≥ 2π [for Figs. 3(a) and 3(b), N = 2π]. As N decreases below this limit, the defect becomes sharper and, thus, it is expected that smaller aspect ratios will result in significantly higher magnitudes of σxx, σyy, and τxy. The significant outcome is that for sharper defects (smaller N), the mode I tensile stress acting in the SSE at the apex of the undulation could be considerably higher than the stress presented in Figs. 3(a) and 3(b). However, as previously noted, not every defect of this volume is necessarily subjected to such deleterious stresses. As per the hypothesis stated in section “Informed guidance from nanoindentation, past and future” and summarized previously, for a fixed current density, the pressure within a ‘small’ volume at the lithium/SSE interface could be alleviated by dislocation-mediated flow, as the stress relief will inherently depend on the probability of finding or not finding a mobile dislocation or dislocation source within close proximity to the stressed volume.
We further note that during charging, there is, of course, a thermodynamic limit to the magnitude of stress that can be generated in the lithium anode by an applied voltage above the equilibrium voltage, ΔV. The increase in equilibrium voltage due to stress is on the order of ΔV = (ΩσH max)/q. As observed here, the maximum stress set by diffusional creep and dislocation plasticity is ∼50 MPa, thus, the corresponding ΔV = 6.7 mV.
Deformation mechanism map and the critical defect length scales corresponding to the maximum build-up of stress at the lithium/SSE interface
For the nonplanar interface defects, the culmination of the proposed analysis is the deformation mechanism map presented in Fig. 4, which is expressed for the following conditions: |i| = 1 mA/cm2, N = 2π, E = 9 GPa, and T = 304 K. We note the maps recently reported by Barai et al. are similar in nature, but they are based on the bulk properties of lithium and, therefore, do not consider the length scale effects described here or the possibility of diffusional creep as the dominant stress relief mechanism [Reference Barai, Higa and Srinivasan58]. Nevertheless, the maps may be directly applicable to the previously described analysis of Narayan [Reference Narayan and Anand32].
Deformation mechanism map and the corresponding shear stress within lithium filled defects at the lithium/SSE interface. The map is based on the following conditions: (1) the defect’s aspect ratio of wavelength to amplitude is 2π; (2) the average current density at the interface is 1 mA/cm2; (3) the elastic modulus of the lithium within the defect is 9 GPa; (4) the absolute temperature is 304 K.
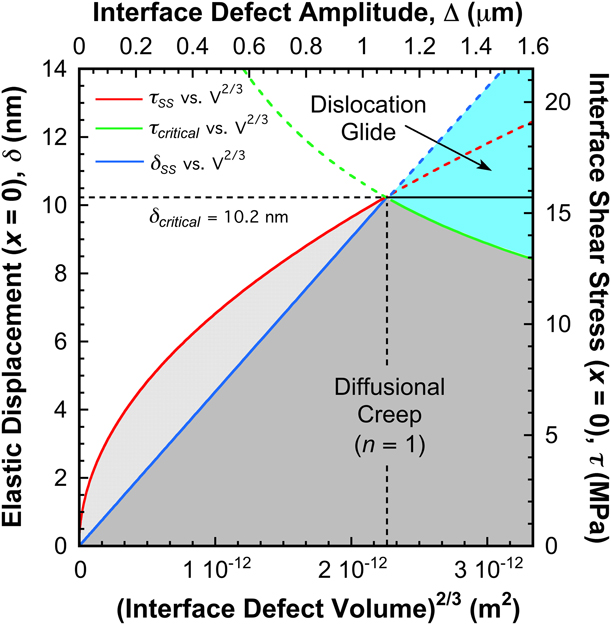
The proposed map presented in Fig. 4 does not capture the element of time, rather it assumes sufficient time has elapsed such that δ is either δSS or δcritical depending on the volume of the defect that is under compression. Details of the plot development are provided in Appendix D. The intersection of the δcritical horizontal line with the linear function of δSS with V 2/3 defines the defect volume that produces the maximum elastic displacement at the apex of the undulation and, thus, the greatest potential danger to interface failure by mode I or mixed mode fracture of the SSE. Based on the specified conditions, the volume of the defect under compression (−π/(2ω) ≤ x ≤ π/(2ω)) is ∼3.4 μm3, which is represented by the vertical dashed line. As previously described, the driving force for potential mode I failure of the SSE is the normal tensile stress balancing the compressive stress in lithium at the apex of the undulation, i.e., σxx = −15.7 MPa at x = 0, which is shown in Fig. 3(a).
The magnitudes of τSS and τcritical [Eqs. (D3) and (D4)] are presented on the 2nd y-axis. The steady-state shear stress, τSS, can alleviate pressure within the defect by driving dislocation plasticity, but only if there is a mobile dislocation contained within the stressed volume or an active source that has sufficient room to physically operate (note the shear stress plotted in Fig. 4 does not occur in the same coordinate system as that depicted in Fig. 2). Alternatively, if the only means of stress relief within the defect is diffusion-mediated flow with a stress exponent n ≤ 3, then the magnitude of τSS at x = 0 is predicted on the 2nd y-axis. The intersection of the τSS and τcritical curves show the most dangerous defect volume, as the intersection represents the defect volume at which the maximum stress occurs because of the kinetic limitations of diffusional creep relaxation. Increasing the defect volume beyond the intersection point, the predicted shear stress becomes τcritical, as it denotes the shear stress required to trigger the transition from diffusion to dislocation-mediated flow. As indicated by the solid green line, τcritical decreases with increasing volume, as given by
 $${\tau _{{\rm{critical}}}} = 2.361 \times {10^{ - 5}}{\left( {{V^{{2 / 3}}}} \right)^{{{ - 1} / 2}}}\quad .$$
In broad terms, the results presented in Fig. 4 illustrate that the length scale inhibition to dislocation plasticity revealed in Eq. (3) limits the possible stress relief mechanism to diffusional creep. The diffusion creep mechanism becomes less efficient as the defect size increases because of the increasing diffusion length, causing a larger mode I tensile stress in the SSE. Although there is a limitation to this effect in that increasing stresses will eventually lead to dislocation plasticity, the stress at which dislocation plasticity can alleviate pressure at small defect length scales may not fall below the threshold in stress required to cause brittle failure of the SSE.
As the aspect ratio N increases, the defect geometry changes such that the amplitude decreases and/or the wavelength increases. Regardless, the defect becomes more blunt. Under these conditions, the volume of the defect at the intersection point is independent of N. The key outcome is that both the maximum stress required to trigger the transition to dislocation-mediated flow [it now follows a different relation that that of Eq. (35)] and the maximum normal crack opening stress, −σxx, are lower and, thus, the probability of failure by fracture of the SSE is reduced as N increases. Accordingly, the most dangerous defects for a given |i| and E are relatively sharp defects, with small values of N. Considering the same values of |i| and N, a change in E brings a proportional change in δcritical (section “Direct comparisons between the leading hypotheses describing the state of stress at the lithium/SSE interface”) such that for the same defect volume, a higher E requires less elastic displacement to trigger the transition to dislocation-mediated flow. At the intersection point, the magnitudes of τcriticcal and −σxx are the same although less elastic displacement was required to reach these same levels of stress. Accordingly, the same size defect filled with lithium of a higher index of crystallographic orientation (higher E) will tolerate less elastic displacement before triggering the transition or potentially initiating fracture. Finally, for the same E and N, an increase in |i| shifts the defect danger zone to smaller volume defects. Under these conditions, the compressively stressed volume requires a higher shear stress to initiate the transition to dislocation-mediated plasticity and the lithium supports a higher magnitude of σxx, thus, increasing the risk of fracturing the SSE.
Interfacial stress relief from the SSE
Because the outcome of both interface conditions (flat versus undulating) is a mode I tensile stress acting at x = 0 in the SSE, it is clear the time- and potentially length scale–dependent properties of the SSE could contribute significantly to stress relief at the lithium/SSE interface. At present, very little is known about the time- and length scale–dependent properties of relevant SSEs. Interestingly, previous indentation experiments performed in LiPON indicate it has a significant propensity for time-dependent deformation [Reference Herbert, Tenhaeff, Dudney and Pharr59]. Motivated by LiPON’s well-documented ability to provide long and efficient cycling of lithium in thin film batteries and the potential role of the SSE in mitigating pressure at the interface, preliminary indentation creep experiments have been performed in a 20 μm-thick LiPON film at indentation depths of 400 and 650 nm and temperatures of 25, 40, and 60 °C [Reference Bates, Dudney, Neudecker and Evans35, Reference Dudney36]. Over a 60 s hold period at each depth and temperature, Fig. 5 shows the measured stress exponent for creep, n, as defined by the constitutive creep relation  $\dot{\varepsilon } = A{\sigma ^n}$, is found to be ∼20 and independent of length scale and temperature over the ranges examined. Details of the experimental method used to determine n are described in the section “Experimental methods”. The implemented methodology is nearly identical to that previously reported by Berla et al., who examined the creep behavior of lithiated silicon and found n to be near 20 as well [Reference Berla, Lee, Cui and Nix60]. Significant test method refinements are currently under development in hopes of improving the precision of future measurements and, thus, more precise estimates of n. Regardless, the uncommonly high magnitude of n suggests that rather than the transport of individual atoms, molecular units of LiPON (3 Li+ and a unit of PO4−3) are capable of local rearrangement by short-range diffusion and, thereby potentially capable of contributing directly to stress relief at the interface. Following the analysis proposed by Berla, the stress exponent of 20 corresponds to an activated volume of 112 Å3, whereas a molecular unit of LiPON would occupy 81 Å3 in the fully dense glass [Reference Lacivita, Westover, Kercher, Phillip, Yang, Veith, Ceder and Dudney61]. This suggests the diffusive flow occurs on a length scale that is similar to that of a molecular unit of LiPON. Moreover, it suggests the properties of LiPON may be critical in relieving pressure at the lithium/SSE interface. By contrast, the substantially higher elastic modulus of ceramic SSEs (E LLZO = ∼150 GPa versus E LiPON = ∼77 GPa) suggests a combination of strong ionic and covalent bonding such that room temperature creep is less favorable and, therefore, the ceramic SSEs may be more susceptible to fracture than LiPON [Reference Yu, Schmidt, Garcia-Mendez, Herbert, Dudney, Wolfenstine, Sakamoto and Siegel7, Reference Herbert, Tenhaeff, Dudney and Pharr59]. Accordingly, the time-dependent behavior observed in LiPON may be one reason why the cyclability of the thin film SSE significantly outperforms both polycrystalline and single crystal superionic conductors such as LLZO.
Lipon, the stress exponent for creep, n, as a function of temperature and length scale as determined by nanoindentation. The distances specified in each column indicate the indentation depth at which n was measured.

Conclusions
Through the findings of recently reported nanoindentation studies and tensile experiments performed on high purity lithium, a mathematically tractable and transparent model is presented that relates a 2D state of stress at the lithium/SSE interface to the average current density, the length scale of an interfacial defect and lithium diffusional creep, and/or dislocation plasticity stress relaxation mechanisms. The proposed model addresses interfacial defects in the form of local deviations from a flat interface (nonplanar) and local variations in the overpotential and/or exchange current density (planar interface). The key outcome is quantification of the localized stress intensification due to the preferential diffusion and plating of metallic lithium into a small volume at the lithium/SSE interface. Through this simple elastic perturbation model, a defect length scale is described that is too large for effective Nabarro–Herring diffusional creep relaxation (diffusion length is too long), but too small for efficient dislocation multiplication (insufficient room to physically operate the source), suggesting the possibility of large, deleterious stresses at the lithium/SSE interface capable of producing mode I or mixed mode fracture of the SSE. For the operating conditions examined here, |i| = 1 mA/cm2, E = 9 GPa, and T = 304 K, the proposed model predicts the maximum elastic deflection of lithium at the epicenter for the point effect of diffusion (x = 0) is 10.2 nm. Subject to the constraint N = λ/Δ = 2π (the highest aspect ratio the model will allow), the most deleterious state of stress for a planar interface is found to be σxx = σyy = −42.0 MPa (principal coordinate system). For a nonplanar interface, the values of σxx and σyy are found to be −15.7 and −47.2 MPa, respectively. This state of stress corresponds to a lithium-filled interface defect with an amplitude of 1096 nm and a wavelength of (2π)/ω = 6.9 μm. The volume of lithium under compression is ∼3.4 μm3. Across the interface, the stress is balanced in the SSE by stress components with the same magnitude but opposite sign, thus, the SSE experiences tensile stresses that promote mode I or mixed-mode fracture. As the interface defects become sharper (N < 2π), the magnitude of stress is expected to increase significantly.
At temperatures ≥ ∼22 °C, the high homologous temperature promotes continuous annealing and recovery such that the stress relief mechanisms in small volumes of lithium at the interface may be limited to diffusional creep mechanisms, as the low dislocation density severely limits the possibility of glide. For externally applied compressive stack pressures of 5 MPa or less, the self-diffusion coefficient of lithium decreases by ∼2.6%, indicating no significant change in the transport capability of lithium away from a stressed interface. Furthermore, relevant nanoindentation results and applicable findings from the electromigration field indicate the supply of vacancies to ‘small’ stressed volumes at the lithium/SSE interface may not be significantly reduced by the externally applied stack pressure or the localized deposition of lithium.
For nonplanar interface defects, the proposed analysis culminates in a new deformation mechanism map that graphically predicts the stress and deformation mechanism within an interfacial defect as a function of the average current density at the interface, the elastic modulus of the lithium within the defect, and the defect geometry. In this context, the map predicts the critical defect length scale associated with the highest probability of chemomechanically induced failure of the SSE. Based on preliminary measurements, the stress exponent for creep in LiPON is found to be ∼20, which suggests the amorphous SSE may be capable of providing stress relief at the interface and, therefore, is perhaps less susceptible to failure by fracture than ceramic SSEs.
Experimental methods
Nanoindentation creep experiments were performed on a 7.6 μm-thick LiPON film using a diamond Berkovich indenter tip and a Nano Flip (Nanomechanics, Inc., Oak Ridge, Tennessee). Twenty experiments (5 × 4 arrays with 20 μm spacing in the x and y directions) were performed on each specimen at the aforementioned indentation depths and temperatures. Loading was controlled such that the loading rate divided by the load was held constant at 0.1 s−1. On reaching the targeted indentation depth, the applied load was held constant for 60 s. In addition to the normal load, a 2 nm (root-mean-square value) harmonic oscillation was superimposed on the normal load at a fixed drive frequency of 100 Hz. Load, P, displacement, h, elastic contact stiffness, S, and time, t, data were recorded during the 60 s hold and then subsequently used to calculate the indentation strain rate,  ${{\dot{h}} / h}$, and stress, H, where H = P/A and A is the projected contact area, defined by a previously determined area function,
 $$A = {C_1}{h_{\rm{c}}}^2 + {{\left( {{C_1}{h_{\rm{c}}}^2 + {C_2}{h_{\rm{c}}}} \right)} \over 2}\quad ,$$
where the magnitude of C 1 and C 2 were found to be 13.939 and 573.34, respectively, and the contact depth, h c, was determined using the Oliver–Pharr model [Reference Oliver and Pharr62]. The percent relative error of this area function (((A curve fit − A actual)/A actual) × 100) was found to be within ±1% over 50 ≤ h c ≤ 290 nm. The area function also extrapolates in a smooth continuous fashion to the maximum indentation depth achieved in LiPON. The stress exponent for creep, n, was determined from power-law fits to  ${{\dot{h}} / h}$ versus H. The temperature was controlled using a custom-built environmental enclosure using liquid cooling and a Peltier heating system. The accuracy and stability of the temperature system are ±0.5 and 0.05 °C, respectively. The experiments were performed only after the measurement system and test specimen equilibrated at the test temperature for a minimum of 12 h before testing. Both the experimental technique and analysis method used here have been well documented elsewhere [Reference Berla, Lee, Cui and Nix60, Reference Su, Herbert, Sohn, LaManna, Oliver and Pharr63, Reference Bower, Fleck, Needleman and Ogbonna64].
To mitigate the detrimental effects of thermal drift, we adopted the same experimental approach previously implemented by Berla et al., who used the aforementioned dynamic nanoindentation technique to measure the stress exponent for creep in lithiated silicon [Reference Berla, Lee, Cui and Nix60]. Accordingly, the change in h during the 60 s hold was determined from the measured S and the universal stiffness equation rather than the measured displacement, which is potentially polluted by thermal drift. The measured S is related to A through the fundamental equation of nanoindentation,
 $${E_{\rm{r}}} = {{\sqrt \pi } \over 2}{1 \over \beta }{S \over {\sqrt A }}\quad ,$$
where the correction factor β is taken to be 1.05 and
 $${E_{\rm{r}}} = {\left( {{{1 - {\nu _{\rm{i}}}^2} \over {{E_{\rm{i}}}}} + {{1 - {\nu _{\rm{s}}}^2} \over {{E_{\rm{s}}}}}} \right)^{ - 1}}\quad ,$$
where Poisson’s ratio for the diamond indenter tip and the test specimen (LiPON) are νi = 0.07 and νi = 0.26, respectively [Reference Oliver and Pharr62, Reference Oliver and Pharr65]. The elastic modulus of the diamond indenter tip and LiPON were taken to be E i = 1141 GPa and E s = 77 GPa, respectively [Reference Herbert, Tenhaeff, Dudney and Pharr59]. The projected contact area, A, was determined as a continuous function of depth through the measured S and the calculated value of E r through Eq. (38). Solving Eq. (36) for h c gives
 $${h_{\rm{c}}} = {{\sqrt {24A{C_1} + {C_2}^2} - {C_2}} \over {6{C_1}}}\quad ,$$
and, thus, the displacement into the surface of specimen,
 $$h = {h_{\rm{s}}} + {h_{\rm{c}}} - {h_{{\rm{td}}}} - {h_{{\rm{lf}}}} = \varepsilon \;{P / S} + {h_{\rm{c}}} - 0 - 0\quad ,$$
where the elastic deflection of the surface, h s, was determined by the Oliver–Pharr model, the indenter geometry specific constant, ε, was taken to be 0.75, the displacement due to thermal drift, h td, was taken to be zero at the drive frequency of 100 Hz, and no additional correction for the displacement into the load frame, h lf, was made because the required correction was previously made in calculating the elastic contact stiffness, S, through the relation
 $$S = {\left( {{1 \over {{S_{{\rm{measured}}}}}} - {1 \over {{K_{{\rm{lf}}}}}}} \right)^{ - 1}}\quad ,$$
where K lf is the stiffness of the load frame [Reference Oliver and Pharr62, Reference Oliver and Pharr65].
Acknowledgments
This research was sponsored jointly by the U.S. Department of Energy, Office of Energy Efficiency and Renewable Energy’s Advanced Battery Materials Research program (managed by Tien Duong), and by TARDEC, the U.S. Army Tank Automotive Research Development and Engineering Center. E.G.H. is grateful for start-up funding from the Department of Materials Science and Engineering at Michigan Technological University. M.R.‘s contributions were financially supported through the MSE department’s Barbara Stoyack Link Undergraduate Research Internship program.
Appendix A: stress derivation utilizing the ECM
Electrolyte failure is not observed under a particular stack pressure if no current is flowing, |i| = 0, as there is no deposition of lithium at the electrolyte interface. Thus, the stress analyzed here is relative to the stress state induced by the stack pressure for a spatially uniform current density. With this caveat, we extend the analogy between a local hydrostatic stress at the lithium/SSE interface and the nanoindentation experiments using the ECM to define the maximum hydrostatic stress under the indenter [Reference Bower28]. Considered in Ref. Reference Herbert, Hackney, Dudney, Thole and Phani9, a slightly different derivation of the expressions relating hardness to strain rate under creep conditions is presented here in order to satisfy all limiting conditions. The elastic radial displacement from the elastic solution of a pressurized sphere, u rr, is
 $${u_{rr}} = - \left( {{{{\sigma _{{\rm{H}}\;{\rm{max}}}}\left( {1 + \nu } \right){a^3}} \over {{r^2}}}{1 \over {2E}}} \right)\quad ,$$
where a is the contact radius (m) under load and r is the radial position (m) from the point of contact. In the limit of an elastic contact with a conical indenter tip, a = ∼2.8h (radius of the smallest sphere that encloses the contact in the plane of the surface), and when r ∼ a, Eq. (A1) gives the maximum hydrostatic stress as
 $${\sigma _{{\rm{H}}\;{\rm{max}}}} = - {{2.8E{u_{rr}}} \over {h\left( {1 + \nu } \right)}}\quad .$$
Assuming H is directly proportional to the radial stress component balancing the hydrostatic core of the ECM, then
 $$H = {\varepsilon _{\rm{o}}}\left( { - {\sigma _{{\rm{H}}\;{\rm{max}}}}} \right) = {{{\varepsilon _{\rm{o}}}E{u_{rr}}} \over h}\quad ,$$
where εo is the characteristic strain imposed by the indenter tip geometry [Reference Bower28]. The magnitude of εo is determined using the condition that when u rr = h, then Eq. (A3) must give the Sneddon elastic solution for a rigid cone [Reference Sneddon52]. Utilizing this relationship between the u rr and h along the path laid out by Herbert et al. and Oyen et al., it is possible to relate the radial elastic displacement to the plastic strain, εrr, over the time, t, of the indentation through the integral equation
 $${u_{rr}}\left( t \right) = h\left( t \right) - \int_0^t {{{{\rm{d}}{\varepsilon _{rr}}} \over {{\rm{d}}\tau }}h\left( \tau \right){\rm{d}}\tau } \quad ,$$
where τ is an integration dummy variable [Reference Herbert, Hackney, Dudney, Thole and Phani9, Reference Oyen and Cook67]. From Eq. (A3), u rr = (H(t)h(t))/(Eεo) and, thus, Eq. (A4) becomes
 $$H\left( t \right) = {\varepsilon _{\rm{o}}}E\left( {1 - {1 \over {h\left( t \right)}}\int_0^t {{{{\rm{d}}{\varepsilon _{rr}}} \over {{\rm{d}}\tau }}h\left( \tau \right){\rm{d}}\tau } } \right)\quad ,$$
which is the same form previously developed by Herbert et al. [[Reference Herbert, Hackney, Dudney, Thole and Phani9] Eq. (9)] except for the modified utilization of εo. The elastic limiting condition satisfied by Eq. (A5) is that when the integral term is zero, H will be Sneddon’s elastic solution [Reference Sneddon52]. The plastic limiting condition satisfied by Eq. (A5) is when the integral term is h(t), then the elastic stress is completely relaxed and H = 0. This equation was studied in some detail in Ref. Reference Herbert, Hackney, Dudney, Thole and Phani9, where connections were made to the physics based indentation creep analyses of Oyen and Bower [Reference Bower28, Reference Oyen and Cook67]. Utilizing the integral term, the experimental observation of depth and strain rate dependent H was correlated with a self-diffusion length scale and indentation rate consistent with Nabarro–Herring and Harper–Dorn type diffusional creep mechanisms when h ≤ ∼350 nm. As previously noted, shear based mechanisms that would be correlated with thermally activated dislocation glide and climb mechanisms were discounted at these small depths because the measured H exceeds σy (∼0.5 MPa) by a factor of ∼80–350 in a manner that depends on the indentation strain rate. Moreover, the sudden drop in pressure shown in Fig. 1(a) is observed over depths ranging from 200 to 500 nm, again depending on the indentation strain rate. Rationalized as the transition from diffusion to dislocation-mediated flow, the sudden pressure drop is associated with a rapid reduction in H and a significant increase in the indentation strain rate.
Appendix B: development of the 2D continuum elasticity model
In the case of diffusion current density control, determination of the position dependent flux in 2D [Eq. (10)] requires solving the Laplace equation in concentration. If the average interface position lies parallel to the  $xy$ plane at y = 0, the concentration of the diffusing species will satisfy (for diffusion current)
 $${{{{\rm{d}}^2}{C_{{\rm{Li}}}}} \over {{\rm{d}}{x^2}}} + {{{{\rm{d}}^2}{C_{{\rm{Li}}}}} \over {{\rm{d}}{y^2}}} = 0\quad .$$
With the boundary condition for discharge (G Li positive) specific to Δω ≤ 1,
 $${C_{{\rm{Li}}}}\left( {y = 0} \right) = {C_{{\rm{Li}}}}\left( {y = \Delta \;\cos \left( {\omega x} \right)} \right) - \Delta \;\cos \left( {\omega x} \right){G_{{\rm{Li}}}}\quad .$$
Introducing the perturbation expansion,
 $${C_{{\rm{Li}}}}\left( {x,y} \right) = {C_{\rm{o}}} + \Delta \omega {C_1}\left( {x,y} \right)\quad ,$$
this redefines Eq. (B2) as
 $${C_{\rm{o}}}\left( {y = 0} \right) = {C_{\rm{e}}}\quad ,$$
where C e is the local equilibrium lithium ion concentration in the electrolyte for the specific applied potential and
 $${C_1}\left( {y = 0} \right) = {{ - \cos \left( {\omega x} \right)} \over \omega }{G_{{\rm{Li}}}}\quad .$$
The Laplace equation providing a solution for the undulating interface relative to the average (planar interface) reference state is
 $${{{{\rm{d}}^2}{C_1}} \over {{\rm{d}}{x^2}}} + {{{{\rm{d}}^2}{C_1}} \over {{\rm{d}}{y^2}}} = 0\quad .$$
The general solution to Eq. (B6) is
 $${C_1} = {A_{\rm{D}}}\;\cos \left( {\omega x} \right)\exp \left( { - \omega y} \right)\quad ,$$
with the integration constant  ${A_{\rm{D}}}$ (atoms/m3) determined as
 $${A_{\rm{D}}} = - {{{G_{{\rm{Li}}}}} \over \omega } = - {{\left| i \right|} \over {\omega Dq}}\quad .$$
In the case of drift current control of lithium ion current density at the undulating interface, then we may consider that the potential in the lithium is a constant value, causing a point effect of potential distribution within the SSE. In this case, the potential, ϕ, can be expanded as a first order perturbation series as
 $$\phi \left( {x,y} \right) = {\phi _{\rm{o}}} + \Delta \omega {\phi _1}\left( {x,y} \right)\quad ,$$
so that ϕ0 is the potential as a function of y for a flat interface, while ϕ1 is the deviation from the average potential due to small undulations at the interface. An equilibrium solution for the perturbed potential in 2D satisfies
 $${{{{\rm{d}}^2}{\phi _1}} \over {{\rm{d}}{x^2}}} + {{{{\rm{d}}^2}{\phi _1}} \over {{\rm{d}}{y^2}}} = 0\quad ,$$
With the boundary condition,
 $${\phi _1}\left( {y = 0} \right) = {{ - \cos \left( {\omega x} \right)} \over \omega }{G_{\rm{e}}}\quad ,$$
giving the general solution,
 $${\phi _1} = {A_{\rm{e}}}\cos \left( {\omega x} \right)\exp \left( { - \omega y} \right)\quad ,$$
and
 $${A_{\rm{e}}} = - {{{G_{\rm{e}}}} \over \omega } = - {{\left| i \right|} \over {\omega \mu q{C_{{\rm{Li}}}}}}\quad .$$
Equations (B9)–(B13) describe a drift current density at the lithium/SSE interface with the same spatial frequency as the interface undulation. As in the case of diffusion current control, the spatial variation of current density then induces local variations in material displacement relative to the average displacement expected for a flat interface with uniform current density. The spatial dependence of the stress free displacement normal to the interface is, thus, proportional to the spatial dependence of the flux normal to the interface. The 2D, stress free displacement vector,  ${\hat{d}_{{\rm{Stress}}\;{\rm{free}}}}$, relative to the average displacement is, thus, proportional to the dot product of the spatially dependent 2D flux vector at the lithium/SSE interface,
 ${\hat{J}_1}$, with the 2D normal unit vector,
 $\hat{n}$, of the undulating interface, or (Ref. Reference Urazgil’dyaev, Cheberyak, Chubok and Shishkin68)
 $${\hat{J}_{{\rm{1normal}}}} = {\hat{J}_1} \cdot \hat{n}\quad ,$$
where the ij components of  ${\hat{J}_1}$ and
 $\hat{n}$ are defined
 $${\hat{J}_1} = - D\left( {\matrix{ {\Delta {\omega ^2}{A_{{\rm{D,e}}}}\sin \left( {\omega x} \right)\exp \left( {\Delta \omega \;\cos \left( {\omega x} \right)} \right)} \cr {\Delta {\omega ^2}{A_{{\rm{D,e}}}}\cos \left( {\omega x} \right)\exp \left( {\Delta \omega \;\cos \left( {\omega x} \right)} \right)} \cr} } \right)\quad ,$$
 $$\hat{n} = \left( {\matrix{ {{{ - \Delta \omega \;\sin \left( {\omega x} \right)} \over {\sqrt {1 + {{\left( {\Delta \omega \;\sin \left( {\omega x} \right)} \right)}^2}} }}} \cr {{1 \over {\sqrt {1 + {{\left( {\Delta \omega \;\sin \left( {\omega x} \right)} \right)}^2}} }}} \cr} } \right)\quad .$$
The result to first order in Δω is an x-dependent function that is proportional to  ${\hat{d}_{{\rm{Stress}}\;{\rm{free}}}}$,
 $${\hat{d}_{{\rm{Stress}}\;{\rm{free}}}}\left( x \right) \propto {\hat{J}_{{\rm{1normal}}}} = {{\left| i \right|} \over q}\Delta \omega \;\cos \left( {\omega x} \right)\quad .$$
If the SSE is comparatively stiff and the material at the interface is continuous, then the stress free displacement is inhibited and the lithium displacement at the interface is the negative of the stress free displacement, or  $\delta (x) = - {\hat{d}_{{\rm{Stress}}\;{\rm{free}}}}\left( x \right)$. Then Eq. (B17) describes the x-dependence of the y-displacement (u y) for the lithium/SSE boundary condition at the undulating interface, or
 $${u_y}\left( {{\rm{interface}}} \right) = - \delta \;\cos \left( {\omega x} \right)\quad ,$$
where δ is the magnitude of the y-displacement undulation. The dependence of δ on time, geometry and current density is described in the main text.
Regarding the Marguerre displacement function [Eq. (15)], the x component of the displacement for ν = 1/3 is
 $$\eqalign{ {u_x} = {{ - \left( {1 + \nu } \right)} \over {1 - \nu }}{\nabla _{x,y}}\cr \Psi = 2\omega \;\exp \left( {\omega y} \right)\sin \left( {\omega x} \right)\left( {B\left( \omega \right) \left + \omega A\left( \omega \right) + \omega yB\left( \omega \right)} \right)\quad .$$
Porz suggests the boundary conditions at the lithium/SSE interface as u x = 0 at x = π/(2ω), then A(ω) = −B(ω)/ω [Reference Porz, Swamy, Sheldon, Rettenwander, Frömling, Thaman, Berendts, Uecker, Carter and Chiang8]. For the y component of the displacement for ν = 1/3,
 $$\eqalign{{u_y} = {2 \over {1 - \nu }}{\nabla _{x,x}}\Psi + {\nabla _{y,y}}\cr\Psi = - 2\omega \exp \left( {\omega y} \right)\cos \left( {\omega x} \right)\left( {\omega A\left( \omega \right) - B\left( \omega \right) + \omega yB\left( \omega \right)} \right)\quad .$$
If u y = −δ cos(ωx), then B is determined to zero order in δΔω2 on the undulating interface or at y = 0 for the flat interface as B(ω) = −δ/(4ω) and then, A(ω) = δ/(4ω2). The components of the stress (ν = 1/3) are thus
 $$\eqalign{{\sigma _{xx}} = {E \over {1 - {\nu ^2}}}\left( { - {\nabla _{x,x,y}}\Psi + \nu {\nabla _{y,y,y}}\Psi } \right) \cr= - {{3E\omega \delta \;\exp \left( {\omega y} \right)\cos \left( {\omega x} \right)\left( {2\omega y + 1} \right)} \over {16}}\quad ,$$
 $$\eqalign{{\sigma _{yy}} = {E \over {1 - {\nu ^2}}}\left( {\left( {2 + \nu } \right){\nabla _{x,x,y}}\Psi + {\nabla _{y,y,y}}\Psi } \right) \cr= - {{3E\omega \delta \;\exp \left( {\omega y} \right)\cos \left( {\omega x} \right)\left( {3 - 2\omega y} \right)} \over {16}}\quad ,$$
 $$\eqalign{{\tau _{xy}} = {E \over {1 - {\nu ^2}}}\left( {{\nabla _{x,x,x}}\Psi - \nu {\nabla _{x,y,y}}\Psi } \right) \cr= - {{3E\omega \delta \;\exp \left( {\omega y} \right)\sin \left( {\omega x} \right)\left( {2\omega y - 1} \right)} \over {16}}\quad .$$
Considering Wang et al., again an undulating displacement at the interface as u y = −δ cos(ωx) may be considered as one boundary condition, but Wang implies a different additional boundary condition than Porz, namely σyy = σxx at x = 0, y = Δ [Reference Porz, Swamy, Sheldon, Rettenwander, Frömling, Thaman, Berendts, Uecker, Carter and Chiang8, Reference Wang, Wolfenstine and Sakamoto12]. This alternative boundary condition gives the solution for the stresses as
 $${\sigma _{yy}} = - {{E\omega \delta \;\exp \left( { - \Delta \omega } \right)\exp \left( {\omega y} \right)\cos \left( {\omega x} \right)\left( {\Delta \omega - \omega y + 1} \right)} \over 2}\quad ,$$
 $${\sigma _{xx}} = - {{E\omega \delta \;\exp \left( { - \Delta \omega } \right)\exp \left( {\omega y} \right)\cos \left( {\omega x} \right)\left( {\omega y - \Delta \omega + 1} \right)} \over 2}\quad ,$$
 $${\tau _{xy}} = - {{E{\omega ^2}\delta \;\exp \left( { - \Delta \omega } \right)\exp \left( {\omega y} \right)\sin \left( {\omega x} \right)\left( {\Delta - y} \right)} \over 2}\quad .$$
Appendix C: derivation of the vacancy flux, Eq. (24)
Consideration of the vacancy migration/flux in a hydrostatic stress gradient in one dimension can be approximated using the chemical potential gradient from the definition of the vacancy chemical potential, μV (J/vacancy), which is expressed as
 $${\mu _{\rm{V}}}\left( x \right) = {\mu _{{\rm{OV}}}} + {k_{\rm{B}}}T\;\ln \left( {{C_{\rm{V}}}\left( x \right)\Omega } \right) - {\sigma _{\rm{H}}}\left( x \right)\Omega \quad ,$$
where μOV is the formation energy of a vacancy (J/vacancy), C V(x) is the concentration of vacancies (vacancies/m3), Ω is the atomic vacancy volume (m3/vacancy) and σH(x) is the position dependent hydrostatic stress (Pa) [Reference Christensen and Newman69, Reference Christensen and Newman70, Reference Zhang, Shyy and Sastry71, Reference Zhang, Sastry and Shyy72, Reference Verbrugge and Cheng73, Reference Golmon, Maute, Lee and Dunn74, Reference Lim, Yan, Yin and Zhu75, Reference Malave, Berger, Zhu and Kee76, Reference Song, Lu, Ji and Zhang77, Reference Song, Shao, Guo and Zhang78, Reference Purkayastha and McMeeking79, Reference Deshpande, Qi and Cheng80]. The vacancy flux, J v (vacancies/(m2 s)), is then found to be
 $${J_{\rm{v}}} = {C_{\rm{V}}}\left( x \right)M\left( {{{{\rm{d}}{\mu _{\rm{V}}}\left( x \right)} \over {{\rm{d}}x}}} \right) = {C_{\rm{V}}}\left( x \right)M\left( {{k_{\rm{B}}}T{{{{{\rm{d}}{C_{\rm{V}}}\left( x \right)} \over {{\rm{d}}x}}} \over {{C_{\rm{V}}}\left( x \right)}} - \Omega {{{\rm{d}}{\sigma _{\rm{H}}}\left( x \right)} \over {{\rm{d}}x}}} \right)\quad ,$$
where M is the mobility (m2/(J s)). The equilibrium distribution of vacancies can then determined from Eq. (C2) with J = 0 [Reference Blech42, Reference Blech and Herring43, Reference Shatzkes and Lloyd44, Reference Kirchheim and Kaeber45, Reference Clement and Lloyd46, Reference Tu47, Reference Ross48, Reference Kirchheim49]. Taking a locally increased hydrostatic pressure developed at x = 0 as σH max, the hydrostatic stress variation about the local region of length scale, L, can be approximated using Saint-Venant’s principle,
 $${\sigma _{\rm{H}}}\left( x \right) = {\sigma _{{\rm{H}}\;{\rm{max}}}}\exp \left( { - {x \over {2\pi L}}} \right)\quad ,$$
or
 $${{{{d{C_{{\rm{veq}}}}\left( x \right)} \over {{\rm{d}}x}}} \over {{\scriptstyle C_{{\rm{veq}}}}\scriptstyle\left( x \right)}} = {\Omega \over {{k_{\rm{B}}}T}}\left( { - {{{\sigma _{{\rm{H}}\;{\rm{max}}}}\exp \left( { - {x \over {2\pi L}}} \right)} \over {2\pi L}}} \right)\quad ,$$
where C veq is the equilibrium vacancy concentration. Integration of Eq. (C4) gives
 $$\ln \left( {{{{C_{{\rm{veq}}}}\left( x \right)} \over {{C_{{\rm{veq}}}}\left( \infty \right)}}} \right) = {{\Omega {\sigma _{{\rm{H}}\;{\rm{max}}}}\exp \left( { - {x \over {2\pi L}}} \right)} \over {{k_{\rm{B}}}T}}\quad ,$$
and, thus, the equilibrium vacancy concentration varies with position as
 $${C_{{\rm{veq}}}}\left( x \right) = {C_{{\rm{veq}}}}\left( \infty \right)\exp \left( {{{\Omega {\sigma _{{\rm{H}}\;{\rm{max}}}}} \over {{k_{\rm{B}}}T}}\exp \left( { - {x \over {2L}}} \right)} \right)\quad .$$
Appendix D: construction of the deformation mechanism map
The purpose of this Appendix is to review the algebra used to construct the graph in Fig. 4. The idea is to convert the steady state elastic displacement and the correlated maximum shear stress at the interface to a function of the interface defect volume, V, where the ratio of defect height and defect spatial frequency, Δ/ω, in Eq. (34) for the elastic displacement suggests a V 2/3 dependence. The aspect ratio of the interface defect is taken as a linear relation between the defect spatial frequency and the defect amplitude (2π)/ω = λ = NΔ such that N is an aspect ratio. Using the relation for the volume of a cone with height Δ and base radius of λ/4, a proportionality constant, a, can be determined through
 $${V^{{2 / 3}}} = {\left( {{{\pi {N^2}{\Delta ^3}} \over {48}}} \right)^{{2 / 3}}} \cdot a = {\Delta \over \omega } = {{N{\Delta ^2}} \over {2\pi }}\quad ,$$
which determines a = 0.98/N 1/3, giving the modified relation for the steady state elastic displacement (limited by diffusional creep) as
 $${\delta _{{\rm{SS}}}} = {{16{k_{\rm{B}}}T\left| i \right|} \over {9DEq}}{{0.98{V^{{2 / 3}}}} \over {{N^{{1 / 3}}}}}\quad .$$
Equation (D2) thus determines the linear relationship between the diffusional creep limited δSS and V 2/3 for a particular value of (k BT|i|)/(DEqN 1/3). It is noted that Eq. (D2) will also define the maximum values of the diffusional creep limited stress components defined in Eqs. (16)–(19). For the particular case defined by the Porz [Reference Porz, Swamy, Sheldon, Rettenwander, Frömling, Thaman, Berendts, Uecker, Carter and Chiang8] boundary conditions used in Fig. 4 plot, with (2π)/ω = λ = 2.48(VN)1/3
 $${\tau _{{\rm{SS}}}} = {3 \over {16}}E\omega {\delta _{{\rm{SS}}}} = {3 \over {16}}E\left( {{{2\pi } \over {2.48{{\left( {VN} \right)}^{{1 / 3}}}}}} \right){\delta _{{\rm{SS}}}}\quad .$$
Combining Eqs. (D2) and (D3) suggests that the shear stress associated with the steady state elastic displacement has a linear dependence on V 1/3. To consider if this stress can cause dislocation plasticity within the length scale provided by the defect volume, it is necessary to consider the analysis in Eq. (2) describing the nanoindentation results on lithium thin films. The result in Eq. (D3) is used to correlate the prior nanoindentation result for the initiation of dislocation plasticity  $\left( {\bar{H}\bar{h}} \right) = 19.3\;{{\rm{N}} / {\rm{m}}}$ (Ref. Reference Herbert, Hackney, Dudney, Thole and Phani10) to the present analysis through the relation λ/4 = 2.8h = π/(2ω). Taking the relevant value of the shear stress as H/2, the critical elastic displacement for dislocation plasticity is determined as
 $${\tau _{{\rm{critical}}}} = {3 \over {16}}E\omega {\delta _{{\rm{critical}}}} = {{19.3\left( {{{\rm{N}} / {\rm{m}}}} \right)} \over {2h}} = {{19.3\left( {{{\rm{N}} / {\rm{m}}}} \right)} \over 2}{{5.6\omega } \over \pi }\quad .$$
Equation (D4) shows δcritical to be independent of defect volume and appears as a horizontal line in Fig. 4. The intersection of the δcritical horizontal line with the linear function of δSS with V 2/3 defines the defect volume that will produce the maximum elastic displacement at the interface, and thus the greatest danger to interface failure. The compressive stress in the Li at the interface resulting a balancing tensile stress in the SSE and possible SSE mode I failure at the tip of the defect are determined by substitution of δSS and δcritical into Eqs. (16) and (19). The magnitudes of τSS and τcritical [Eqs. (D3) and (D4)] responsible for the initiation of dislocation plasticity in the lithium and possible alleviation of the stresses associated with mode I SSE failure are also plotted in Fig. 4. The intersection of the τSS and τcritical curves show the most dangerous defect volume and thus maximum stress build-up due to the kinetic limitations of diffusional creep relaxation. In broad terms, the results in Fig. 4 plot illustrate that the length scale inhibition to dislocation plasticity revealed in Eq. (2) limits the possible stress relief mechanism to diffusional creep. The diffusion creep mechanism becomes less efficient as the defect size increases due to increasing diffusion length, causing a larger mode I tensile stress in the SSE. Although there is a limitation to this effect in that increasing stresses will eventually lead to dislocation plasticity, the stress at which dislocation plasticity may occur at the small length scale of the defect may not fall below the stresses resulting in brittle failure of the SSE.