


Consider a successful corporation expanding into a new income stream. It is important that liability from the new stream not impact the old, so the new should be segregated into its own distinct legal entity. But capital and profit and loss (P/L) may need to flow between the old entity and the new, which is facilitated by making the old entity a partial owner of the new. Almost three decades after the mid-1990s wave of state-level limited liability company laws (Fox and Luna, Reference Fox and Luna2005), and the 1996 implementation of the “check-the-box” regulation that allowed entities to self-declare their type for tax purposes, the economy has increasingly become a modular network of such entities, with well-defined capital and P/L flows between them.
This article describes the network of links between U.S. domestic business entities (partnerships, S corporations, and C corporations), 2009–2021. In 2021 the network, setting aside human owners and out-of-US entities, included 2,230,248 nodes and 3,925,850 edges. The entity network is an ideal vehicle for understanding the process by which an economy builds itself, a record of both the social connections between businesspersons who make the deals and the operational considerations of entities expanding their lines of business.
This is the first article to describe the full network of ownership and P/L flows from the perspective of network topology. To date, characteristics of the full network have primarily been described in working papers with an eye toward tax policy rather than global characteristics of the network (Black et al., Reference Black, Hess, Lester, Goldin, Ho, Paul and Portz2023; Cooper et al., Reference Cooper, McClelland, Pearce, Prisinzano, Sullivan, Yagan, Zidar and Zwick2015). Love (Reference Love2025) includes a few basic facts about the network on the way to discussions of how and by whom carried interest and other exceptional tax situations are used, such as the size of the giant connected component (GCC) of the partnership-only network. Consistent with those results on who uses exceptional tax arrangement, the enlarged graph here (including S and C corporations) is also mostly very basic ownership patterns, with occasional knots of arbitrarily complex subgroups.
Although asset holdings are Lognormally distributed, this article shows that the network of entities forming the U.S. economy are consistent with a Power Law distribution of links, as is typical of scale-free networks. At the micro-scale, unlike common examples of Power Law networks like social ties or Internet links, the network is close to (but not exactly) a tree, in the sense that there is at most one path between (almost) any two nodes.
In 2017, the Tax Cuts and Jobs Act rewrote large parts of the tax code and changed a great many of the details of the incentives behind business structuring choices, but the fit to the Power Law model held fast and the coefficient of link concentration held relatively constant. With one salient exception discussed in Section 2.4.1, the same holds for graphs focusing on subindustries within the full economy.
Using the Power Law exponent as a measure of the concentration of capital links gives us a novel and useful tool for measuring an economy. How the concentration differs across contexts, such as different subsectors or in economies at different levels of development, may provide clues about what makes a growing, equitable, productive, or stable economy.
Market concentration is often measured by considering only the biggest players in an industry (concentration ratios) or using metrics which effectively ignore smaller values in a Power Law or exponential distribution (such as the Hirfendahl-Hirschman index), but there is benefit to a concentration measure that accommodates the full range of enterprises from small to large. For example, although there are tens of thousands of health care providers across the U.S., the likelihood that there is only one option for a given specialization in a given geographic area rises with industry concentration. Concentration ratios and the HHI focus on limits to competition from a small number of large players, and can easily miss reduced competition due to concentrated ownership of a large number of small players. The concern has been salient enough that, in 2024, a coalition of U.S. government agencies initiated an inquiry into the expansion of private equity acquisitions in health care, especially those acquisitions whose scale would be too small to require disclosure and review under current rules.Footnote 1
For tax policy and administration, examples exist where exceptionally complicated structures have been used to evade audit, but finding “abnormal” and abusive arrangements requires an understanding of what “normal” arrangements look like. This article reports findings from a project with that goal.
The macro-level results show that the overall distribution of links follows what some call a “law of nature” (Keller, Reference Keller2005), which may be impossible to substantially change with interventions—measures below are remarkably consistent, but the concentration of links, whether ownership tends more toward concentration or diffusion, can change over time.
Previous efforts at looking at, or even defining, the capital network of a domestic economy have focused on either financial flows only among banks and other finance-focused entities (Boss et al., Reference Boss, Elsinger, Summer and Thurner2004) or the largest (typically publicly traded) corporations and their boards of directors, what are sometimes described by the authors studying them as “élites” (Battiston and Catanzaro, Reference Battiston and Catanzaro2004; Corrado and Zollo, Reference Corrado and Zollo2006; Robins and Alexander, Reference Robins and Alexander2004). But the economy is far more than the largest thousand firms and their owners, and using the 12,051,041 legal entities and human owners with at least one connection in the 2021 entity network of 15,425,953 links offer a more comprehensive picture.
One might suspect that the number of owners or subsidiaries is simply another measure of firm size. Below, we will see that a single entity’s asset or payroll size is not well correlated to the number of subsidiaries it has and that assets and wages across all entities do not conform well to a Power Law. Axtell (Reference Axtell2001) found that the size of publicly traded C corporations does follow a Power Law; this will be re-evaluated in the context of the larger data set here in Section 2.5.2. Guerrero and Axtell (Reference Guerrero and Axtell2013) drew a network where nodes are Finnish firms and edges are workers changing jobs from one firm to another, and found evidence that the network has a Power Law distributed node distribution and a weakly small-world exponent (in the notation of Equation (1) below,
 $\gamma =3.19$
). The work here provides a capital-focused complement to that result about the labor network.
After discussion of the data in Section 1, Section 2 considers global characteristics of the network, such as parameters of the distribution of links, then Section 3 presents some local characteristics, focusing on the most common motifs among connected subgroups of five or fewer nodes. Section 4 redoes the analysis across twelve years and four different variants on the specification of the network, finding few qualitatively significant differences.
1. Data
Statistics regarding the networks for tax years 2009 to 2021 will be presented below, but the exposition will primarily use the 2021 network. The data set is a list of parent–child TIN or SSN (taxpayer ID number or Social Security number) pairs gathered from any report of ownership in either direction on forms filed with the U.S. Internal Revenue Service, covering the full population of these types of entity:
-
• S corporations are passthrough entities organized as per 26 U.S. Code §1(S), meaning that all profit and loss is allocated (“passed through”) to shareholders in the tax year in which they are incurred. The S corp itself pays no taxes when those transfers are made. S corps cannot be owned by a C or S corp or other passthrough. Links are taken from Form 1120S Schedule K-1 (listing parents of the filing S corp) and Schedule B (listing its children).
-
• Partnerships are also passthroughs in the same manner of income and losses going to owners, but with greater flexibility in allocations. The forms are analogous, with links on Form 1065 Schedules B and K-1.
-
• C corporations, organized as per 26 U.S. Code §1(C), are entities which can hold profits and losses, and pay taxed dividends to shareholders. Their stock can be publicly traded; those trades are mostly invisible on the tax forms used here, but if some party has amassed an ownership share of 20% or more, it must be reported on Form 1120 Schedule G.Footnote 2 Corporate affiliation links are listed on Form 851. Ownership over 20% either by the C corp or of the C corp is also listed on Form 1120 Schedule K.
-
• Real estate investment trusts (REITs) are entities whose sole interest is in owning real estate. Dividends are taxed but often at lower rates. They report links to parents and subsidiaries on 1120-REIT Schedule K.
There are a few mechanisms to improve robustness. These forms are usually prepared by professional preparers who could face penalties for misreporting. Some forms ask about parent-to-child links and some child-to-parent links, a redundancy which further lowers any chance of unreported links. Filings go through basic validity and consistency checks by the IRS, which also lower the chance of a link going unreported. Nonetheless, 0.68% (i.e., under 1%) of entries have a missing Employer ID Number (EIN) on the parent or child side of the link. It is unclear how many of these reported-but-invalid links are correctly reported via a redundant link elsewhere in the data.
Although business entities can own each other in almost any combination, people are always top nodes in the network, and it is reasonable to expect that an individual makes decisions differently from how decisions are made in a legal business entity. Links to out-of-U.S. entities are reported, but any links for those entities are invisible to the U.S. tax forms. Therefore, the main body of this article covers only the network with links between U.S. domestic business entities (also excluding non-REIT trusts, estates, nonprofits, and links to overseas entities). People and other non-businesses will be reinserted as a robustness check below.
If a partnership has income not from other partnerships, estates, or trusts or shows rental income or deductions from business activity, it is classed here as a trade or business (TB). Non-TB operations typically make money via passive income such as interest or rents from loaning capital or equipment to other entities, and it is a common form to split a single business enterprise into an active TB segment which borrows capital from a passive non-TB segment. In 2021, among all edges between domestic business entities, 24.3% of edges are between a TB and non-TB partnership, with a roughly even number of links where the TB partnership is parent and where the non-TB partnership is parent.
C corporations are taxed as distinct entities, while partnerships and S corporations pass through P/L without a taxation step at the partnership/S corp level. This makes C corps a disfavored choice as a node in the network: 49.6% of nodes with edges in the 2021 network are TB partnerships, 26.2% are non-TB partnerships, 15.5% are S corporations, and only 8.5% are C corporations.
1.1 Limitations
Non-U.S. entities may be nodes at the periphery of the network, but all links between two foreign nodes are missing from the data.
This data set excludes the large volume of capitalization via loans and not-substantial (
 $\lt 20\%$
ownership) public stock market purchases. This is perhaps beneficial, as the links used here are more focused on investors closely involved in day-to-day business or (literally and figuratively) heavily invested in the operation. From the perspective of a social network, loans and smaller purchases may not reflect close social ties.
Sole proprietorships are businesses with a single listed owner, and in 2015 they comprised 71.9% of non-farm business returns filed with the IRS, but only 3.8% of non-farm receipts. They are typically “disregarded entities,” meaning that their P/L is treated as earned by the sole owner. For example, a professional such as an independent lawyer or plumber may run their business affairs via a limited liability corporation, of which they are the sole employee and sole owner. We take at face value the assertion by their owners that a disregarded entity and its owner should be treated as a single unit of the owner’s type (typically a human), not as two nodes connected by an edge. The remaining 96.2% of the formal non-farm U.S. economy (by revenue, as of 2015) are nodes with edges in the network discussed in this article.
Along similar lines, in 2018, about 37,000 C corporations filed consolidated tax returns on behalf of themselves and about 176,000 subsidiaries. Each subsidiary has its own revenue stream, with capital and P/L flows like any standalone business, but we take at face value the claim that the subsidiary is effectively a department of the parent corporation that happens to have a distinct EIN and treat single-owner consolidations as a unit.
2. Global characteristics of the entity network
This section presents results regarding the overall shape of the distribution of link counts in the entity network and reports statistics about its overall shape. Because one might expect that entities with many links are simply larger firms, Section 2.5 compares the distribution of link counts to the differently shaped distributions of asset and payroll size.
2.1 Connected components
Unless otherwise noted, all statistics are regarding the U.S. domestic business entity-only network of 2021. In that network, 60.7% of the nodes are in a GCC, in which, treating links as undirected, there is a path from any node in the GCC to any other in the GCC.
After the GCC of 1,354,255 nodes, the largest connected subgraph is 330 nodes, with the great majority of the remainder of subgraphs consisting of five or fewer nodes.
2.2 Global shape
The distribution of outbound link densities conforms to a Power Law distribution remarkably well. Notate a Power Law distribution of link counts
 $n$
as
 \begin{equation} \log P(n) = -\gamma \log (n) + K, \end{equation}
where
 $P(n)$
is the likelihood that a node has
 $n$
links,
 $K$
is a scaling constant, and
 $\gamma$
is a coefficient calculable from the data. In the impossibly degenerate case where
 $\gamma =0$
, this would be a flat line and all link counts would be equally likely, but as
 $|\gamma |$
gets larger, the slope tilts toward smaller link counts being more common and hub nodes with very large link counts being less common. Using the method of Clauset et al. (Reference Clauset, Shalizi and Newman2009), including calculation of bootstrapped 95% confidence intervals, for outbound links
 $\gamma$
= 2.85
 $\pm$
0.07, and for inbound links
 $\gamma$
= 2.71
 $\pm$
0.01.Footnote
3
Left: the distribution of outbound parent-to-child links, 2020 network, log–log scale. Right: inbound child-from-parent links. The complementary cumulative distribution function is the percentage of the distribution over the given edge count. The best-fitting Power Law is shown as a dotted line.

Figure 1 shows how one minus the cumulative distribution function of link counts (the complementary CDF, or CCDF) has the hallmark linear shape on a log–log scale.Footnote 4
Clauset et al. (Reference Clauset, Shalizi and Newman2009) advises comparing the fit to a Power Law against the fit to a Lognormal distribution, especially given that the process by which the two types of distributions are generated are very different. A Lognormal distribution is easily generated by applying a sequence of independent and identically distributed (IID) multiplicative shocks to a population of initially identical firms.Footnote 5 The IID assumption thus provides a sort of null hypothesis in the case of networked data, stating that the likelihood of a new link being formed does not depend on the links already present. Conversely, Power Law distributions of link densities are often generated via preferential attachment, in which nodes of a network are added one by one and attach to extant nodes with a probability proportional to the number of links each node already has (Barabasi, Reference Barabasi2016).
Likelihood ratio tests comparing the Lognormal and Power Law models are inconclusive, finding neither model fitting better than the other with consistent statistical significance over years and network specifications. That is, a Power Law model fits the data well, but the possibility that other models also fit well is not rejected. Section 4 will do further robustness tests.
This article uses the notation of Power Laws over Lognormal distributions because of the clear interpretation of
 $\gamma$
as a measure of industry concentration. As a rule of thumb, graphs with
 $\gamma$
between two and three are “small world” networks, with a small number of hubs and a large number of nodes with only one or two links. Though this class of graphs gets its name from the short number of steps needed to hop between any two nodes (but see below regarding the surprisingly large diameter of the entity network), that property stems from the variation in link counts and the existence of hub nodes which connect a large number of nodes which would be otherwise distant in the graph. Graphs with
 $\gamma \leq 2$
are extremely densely packed around the hubs, and in the other direction, as
 $\gamma$
grows to three and above, a graph becomes increasingly like a diffuse random network with no small-world properties (Barabasi, Reference Barabasi2016). Such a network would have few hubs and more nodes with a link count close to the modal link count.
2.3 Other common measures
The Netzschleuder network catalog and repository includes, as of this writing, 286 networks studied in the literature, including biological, genetic, road, social, and economic networks, among abundant other categories (Peixoto, Reference Peixoto2020). Though there is no way to describe a random or “scientific” sample of the world’s networks, this broad variety of networks offers enough context to see where the business entity network is especially unusual.
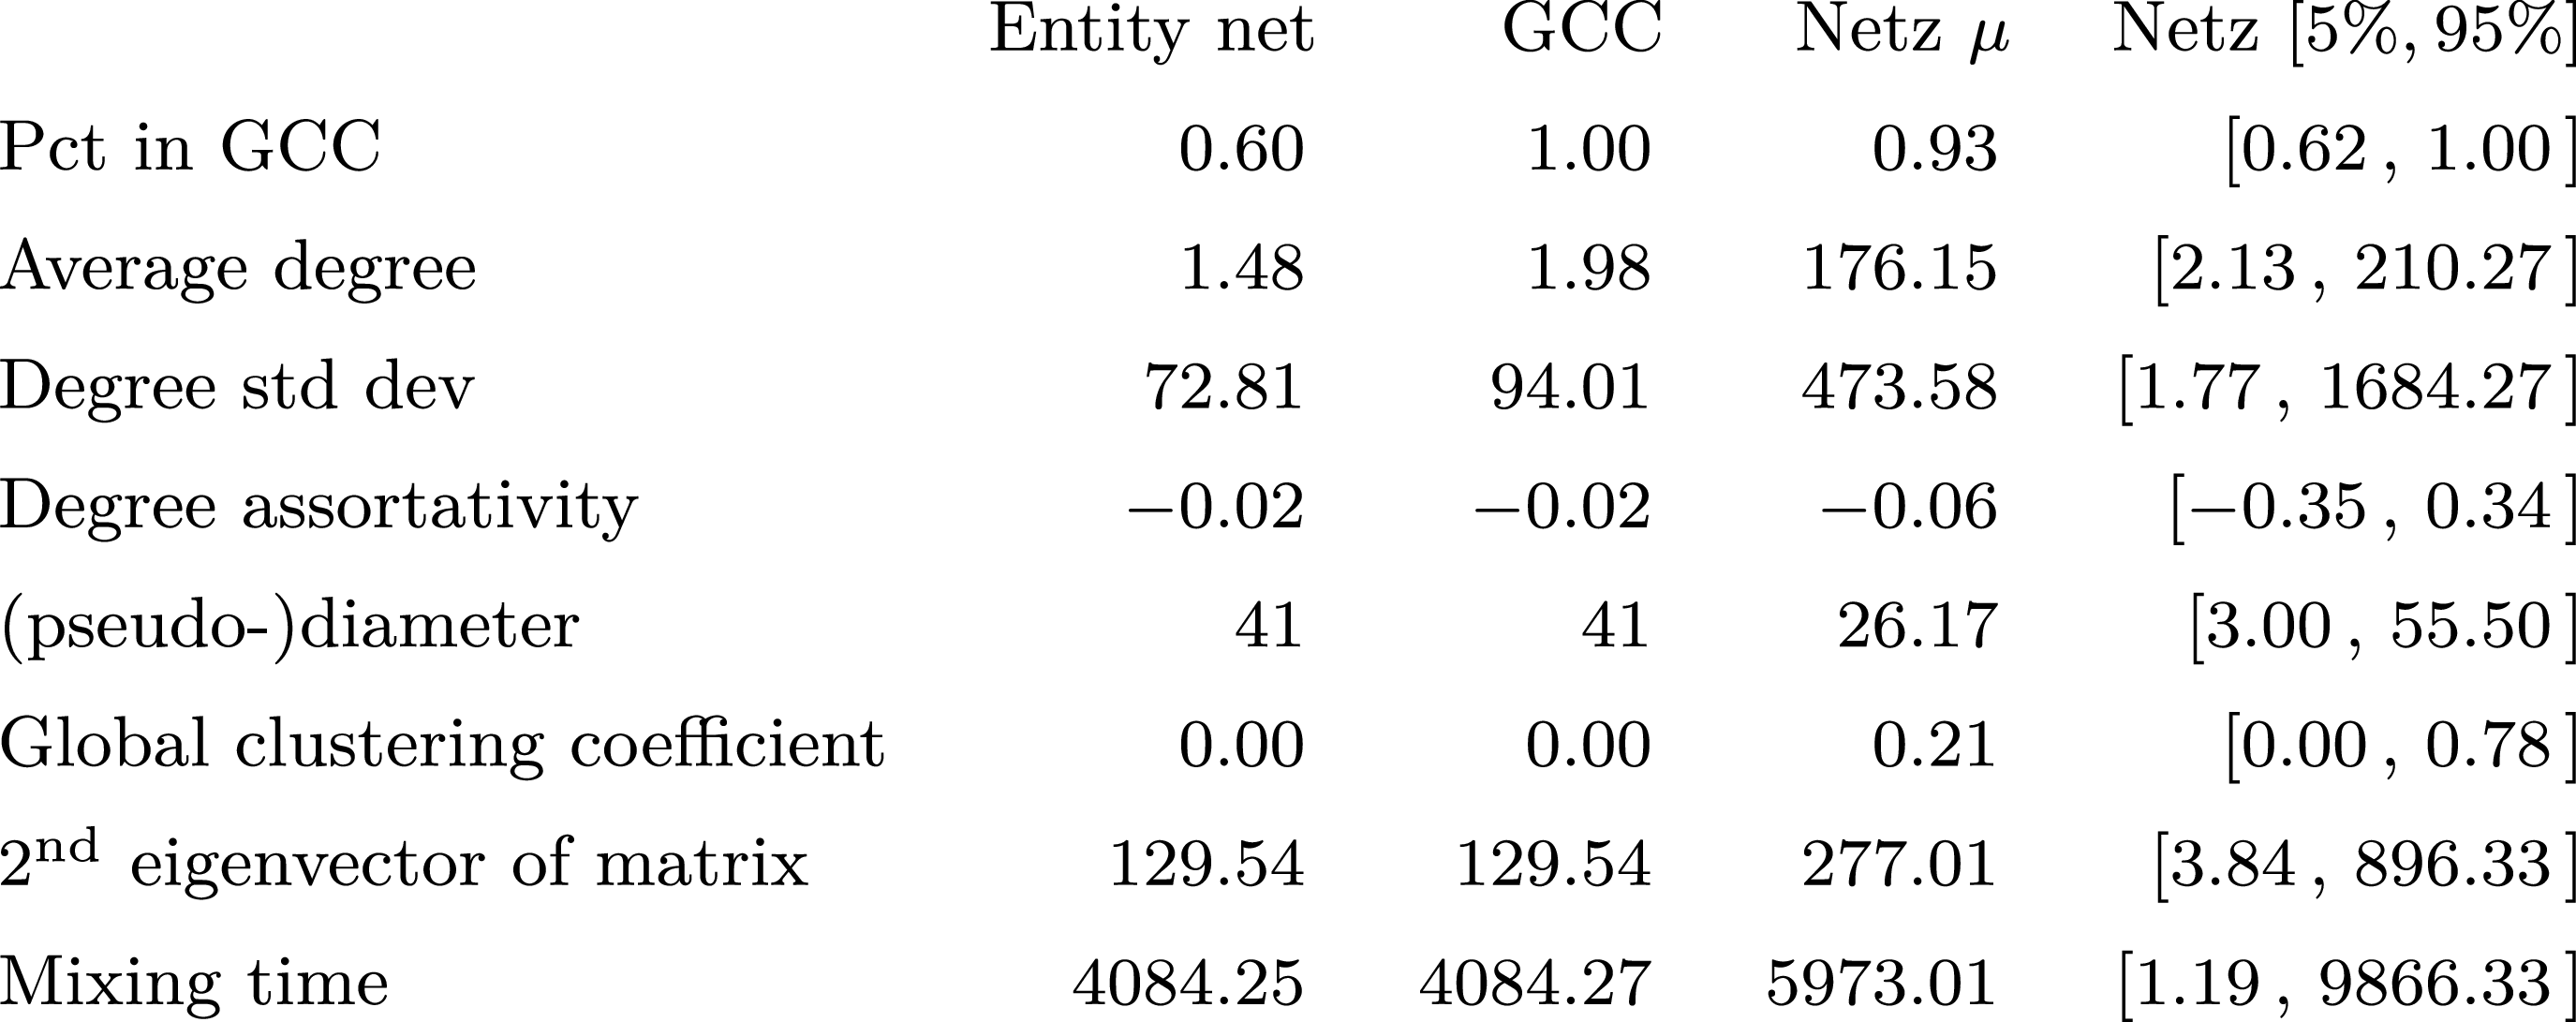
A set of statistics, in the entity network, the GCC of the entity network, and the mean and 90% range of the networks in the Netzschleuder repository of networks. The seven road networks in the database are excluded from the statistics, due to being outliers one some axes and having no real comparability to corporate networks. See text for discussion of the different measures.

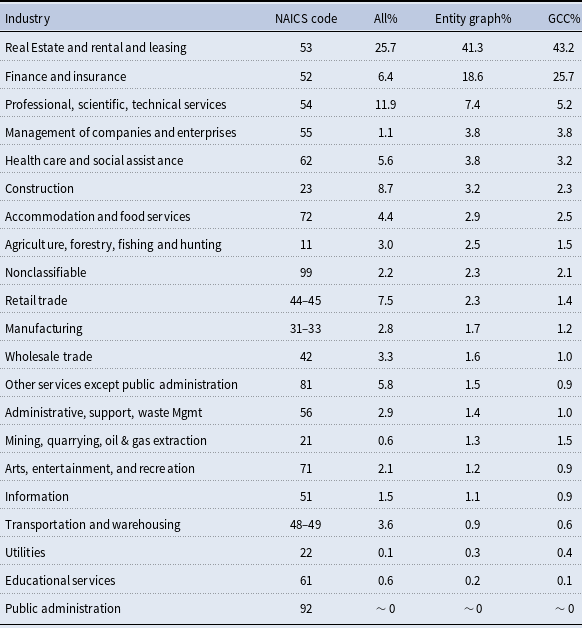
Percent of nodes in a given industry, for all registered EINs, the 2021 business-entity-only subnetwork, and the GCC of that subnetwork

Table 1 Long description
A table comparing the percentage of nodes in various industries across different categories. The table has 21 rows and 4 columns. The columns are labeled Industry, NAICS code, All percent, Entity graph percent, and GCC percent. The rows list different industries along with their corresponding NAICS codes and percentages. Row 1: Real Estate and rental and leasing, 53, 25.7 percent, 41.3 percent, 43.2 percent. Row 2: Finance and insurance, 52, 6.4 percent, 18.6 percent, 25.7 percent. Row 3: Professional, scientific, technical services, 54, 11.9 percent, 7.4 percent, 5.2 percent. Row 4: Management of companies and enterprises, 55, 1.1 percent, 3.8 percent, 3.8 percent. Row 5: Health care and social assistance, 62, 5.6 percent, 3.8 percent, 3.2 percent. Row 6: Construction, 23, 8.7 percent, 3.2 percent, 2.3 percent. Row 7: Accommodation and food services, 72, 4.4 percent, 2.9 percent, 2.5 percent. Row 8: Agriculture, forestry, fishing and hunting, 11, 3.0 percent, 2.5 percent, 1.5 percent. Row 9: Nonclassifiable, 99, 2.2 percent, 2.3 percent, 2.1 percent. Row 10: Retail trade, 44-45, 7.5 percent, 2.3 percent, 1.4 percent. Row 11: Manufacturing, 31-33, 2.8 percent, 1.7 percent, 1.2 percent. Row 12: Wholesale trade, 42, 3.3 percent, 1.6 percent, 1.0 percent. Row 13: Other services except public administration, 81, 5.8 percent, 1.5 percent, 0.9 percent. Row 14: Administrative, support, waste management, 56, 2.9 percent, 1.4 percent, 1.0 percent. Row 15: Mining, quarrying, oil and gas extraction, 21, 0.6 percent, 1.3 percent, 1.5 percent. Row 16: Arts, entertainment, and recreation, 71, 2.1 percent, 1.2 percent, 0.9 percent. Row 17: Information, 51, 1.5 percent, 1.1 percent, 0.9 percent. Row 18: Transportation and warehousing, 48-49, 3.6 percent, 0.9 percent, 0.6 percent. Row 19: Utilities, 22, 0.1 percent, 0.3 percent, 0.4 percent. Row 20: Educational services, 61, 0.6 percent, 0.2 percent, 0.1 percent. Row 21: Public administration, 92, 0 percent, 0 percent, 0 percent.
The statistics in the Netzschleuder repository were generated via the open-source Graph-tool package (Peixoto, Reference Peixoto2014), meaning the statistics for the entity network could be calculated using exactly the same code base, algorithms, and implicit assumptions.Footnote 6 Figure 2 summarizes statistics from 279 of the networks (road networks are excluded for being outliers with too little relation to business entities) and the same statistics for the entity network.
-
• The percentage of observations in the GCC is below the percentage for over 95% of networks in the Netzschleuder database. This is a reminder that, unlike many networked situations like socializing or transportation, networking is entirely optional. Many of the liability-limiting (and potentially tax-avoiding) methods discussed to this point, such as an equipment-holding LLC leasing to an operating LLC, do not require any further linking with other entities.
-
• The average degree of the entity-only network is smaller than over 95% of networks in the database. The rationale is likely along similar lines.
-
• The near-zero global clustering coefficient (
 $2.90e-4$
) is a reflection of the tree nature of the graph, with occasional pockets of linked organizations, explored in more detail in Section 3.
-
• Degree assortativity is near zero. Newman (Reference Newman2002) found that socially-driven networks like corporate director boards (
$\rho =0.276$
) and academic coauthors (
$\rho \in [0.12,0.36]$
) generally have positive assortativity, while mechanically driven networks like protein interactions (
$\rho =-0.19$
) and the marine food web (
$\rho =-0.25$
) have negative assortativity. By this measure, the financial network’s near-zero
$\rho$
falls between the two regimes, which is apt for a network built via social ties to execute the mechanics of business operations.





2.4 Subindustries
Table 1 gives the breakdown of nodes with edges in the graph by North American Industry Classification System (NAICS) code. NAICS codes are self-reported based on the filer’s description of the primary activity of the entity. Entities outside the U.S. are excluded, and the table presents statistics for all filing entities with an EIN including those with no network links, those in the subgraph consisting of linked business entities only, and those in the GCC of the same subgraph.
The Finance, Real estate/rental, and (of course) Management of Companies categories are over-represented in the ownership graph relative to the full population of registered EINs. Most notably, Finance and Insurance is 6.4% of EINs but 25.7% of nodes in the GCC. Correspondingly, most other industries are under-represented in the graph.
2.4.1 Link concentration per industry subnetwork
For a given NAICS code, we can build a subnetwork from the set of edges where either the parent or child has the given code by starting with the full network and removing all edges where neither side has the given NAICS code. This will be considered the network for that industry, though it will include many entities in other fields. For example, the health care and social assistance subnetwork has 37.8% of its nodes in health care/social assistance in 2018, and 13.5% in finance. In 2021, the portion of the network in health care/social assistance was almost identical at 38.2%, but the portion of the network in the finance industry expanded by just over a quarter, to 17.0% of the network.
Power Law coefficients across time and industry subclasses. A lower value of
 $\gamma$
indicates a more concentrated distribution of capital links. Entities classing themselves in finance and rental of equipment/real estate appear across the economy, but specialized fields have values of
 $\gamma$
which are lower and generally consistent. Values are horizontally jittered to improve visibility of error bars, showing the 95% confidence intervals.

Figure 3 Long description
A line graph showing Power Law coefficients across time and industry subclasses. The horizontal axis represents the years from 2009 to 2021. The vertical axis represents the Power Law coefficients, ranging from 2.0 to 3.0. The graph includes multiple lines, each representing a different industry subclass: Rental/leasing, Finance, Professional services, Oil/gas/mining, Management, Construction, Health care, Food & Hospitality, and Agriculture. Each line shows the trend of Power Law coefficients over time for the respective industry. The lines are color-coded and labeled accordingly. The data points are horizontally jittered to improve the visibility of error bars, which show the 95% confidence intervals. The Rental/leasing and Finance industries have higher and more consistent Power Law coefficients compared to other industries. Specialized fields like Oil/gas/mining, Management, Construction, Health care, Food & Hospitality, and Agriculture have lower and generally consistent values. The graph indicates that a lower value of the Power Law coefficient suggests a more concentrated distribution of capital links.
Top: the CCDF of outbound links in the health care and social services network, 2020 (left) and 2021 (right). Bottom: the CCDF of outbound links in the real estate and equipment rental network, 2020 and 2021.

Figure 4 Long description
The image contains four line graphs showing the complementary cumulative distribution function (CCDF) of outbound links in different networks for the years 2020 and 2021. Each graph has a logarithmic scale on both the x-axis and y-axis. The x-axis represents the count of outbound links, and the y-axis represents the CCDF. The red dashed line in each graph represents a reference or comparison line. Panel A: The top left graph shows the CCDF of outbound links in the health care and social services network for the year 2020. The blue line represents the actual data, and it follows a downward trend as the count of outbound links increases. Panel B: The top right graph shows the CCDF of outbound links in the health care and social services network for the year 2021. Similar to Panel A, the blue line represents the actual data and follows a downward trend. Panel C: The bottom left graph shows the CCDF of outbound links in the real estate and equipment rental network for the year 2020. The blue line represents the actual data and follows a downward trend. Panel D: The bottom right graph shows the CCDF of outbound links in the real estate and equipment rental network for the year 2021. The blue line represents the actual data and follows a downward trend. In all panels, the blue lines show a similar pattern of decline, indicating a consistent distribution of outbound links across the different networks and years.
Figure 3 shows the values of
 $\gamma$
for the nine industries with the largest presence in the GCC of the business entity network, 2009–2011. As a reminder, a lower
 $\gamma$
indicates a network with more nodes with higher link counts, and a higher
 $\gamma$
indicates a network where links are more evenly distributed. For some preferential attachment models of network generation,
 $\gamma =2$
is an impossible limiting value where link concentration is so dense that some nodes have infinite link density.
The industries neatly fall into two classes. The first, finance and rental of equipment/real estate, are industries with a lower concentration of links by the measure here. The great majority of businesses are located somewhere, so real estate arms of firms being distributed across the economy is no surprise; similarly, a great many firms have financial situations such that segregating financial affairs into a separate business entity makes sense.
The other industries, from accounting firms to oil and gas extraction, are less generalist and show remarkable consistency in values of
 $\gamma$
, both across time and across industries.
The point estimate of
 $\gamma$
falls for every industry from tax year 2020 to tax year 2021, a year into the COVID-19 pandemic, although with statistical significance in only some cases. The stand-out exception is Health Care and Social Assistance, which showed a statistically and possibly policy-significant increase in concentration of capital flows. Beyond major consolidations at the largest end of the distribution (Contreary et al., Reference Contreary, Chatrath, Jones, Cohen, Miller and Rich2023), industry statistics showed an “extraordinary” rise in mergers & acquisitions even among smaller health care practices in that year (Potter, Reference Potter2021). As noted above, the proportion of the health care network actually devoted to finance expanded noticeably from 2018 to 2021, and as discussed in the introduction, some observers have qualitatively observed an uptick in private equity consolidation. Other industries also showed statistically significant shifts, albeit less dramatic ones which reversed a slow trend toward decentralization.
Figure 4 shows the CCDFs of the distribution of outbound links and their corresponding model best fits for health care/social services and equipment rental/real estate for 2020 and 2021. The distribution of links in health care fits the straight line well from bottom to top, though the density of the complementary CDF at lower link counts grows from 2020 to 2021, meaning the smaller entities have relatively fewer links. The break in the rental industry link distribution indicates a bimodal distribution with the majority of firms being part of the smooth distribution of links below about a thousand links and a small percentage of entities with many thousands of links. That upper group grew larger in 2021, so a relatively small number of firms may have had a disproportionate effect on the model fit and change in
 $\gamma$
; this is reflected in the large error bars in Figure 3. These are two different stories of market consolidation. In one, the entire industry consolidates, as groups with any quantity of subsidiaries gained a few percent more; in the other, a relatively small number of firms gained a noticeable percentage of new subsidiaries. But note that the remainder of the line on the log–log scale for real estate remained a line and shifted in slope as the slope of the line for health care did, meaning an expansion at the large-count end of the scale was accompanied by shifts throughout the industry.
2.5 Firm size
We know that assets have a heavy-tailed distribution (Axtell, Reference Axtell2001); are all these results about subsidiary counts merely reflections of the asset size result? If a firm grows large enough, does it inevitably spawn off a few subsidiaries? This section checks the correlations between subsidiary counts and other measures of firm size. Assets are via Schedule L (“balance sheets per books”) of Forms 1120/1120S/1120REIT/1065, and wages and salaries (herein wages, excluding payments to partners) are as reported on page one of these forms.Footnote 7
2.5.1 Correlations
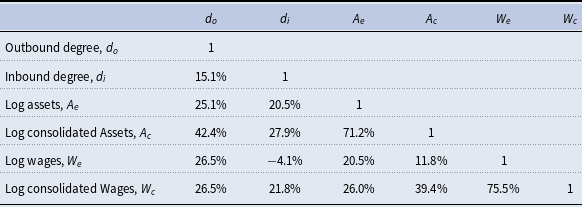
Table 2 presents the correlation matrix between six measures of size: log inbound link count, log outbound link count, log assets, and log wages, where the last two are measured first on the entity level, then at the consolidation level, assigning all subsidiaries’ assets and wages to parents in proportion to their ownership share. It shows that these three concepts of firm size (links, assets, wages) are loosely correlated, around 25% for most measures. Partially mechanically, the correlation between a firm’s outbound degree (child count) and consolidated asset or payroll size is higher than the correlation between a firm’s child count and its own size.
Matrix of correlation coefficients for several measures of firm size

Table 2 Long description
A table titled ‘Matrix of correlation coefficients for several measures of firm size’ with six rows and six columns. The table presents correlation coefficients between six measures of size: outbound degree, inbound degree, log assets, log consolidated assets, log wages, and log consolidated wages. The rows and columns are labeled with these measures. Each cell in the table contains a correlation coefficient value. Row 1: Outbound degree, d_o, 1, 15.1 percent, 25.1 percent, 42.4 percent, 26.5 percent. Row 2: Inbound degree, d_i, 15.1 percent, 1, 20.5 percent, 27.9 percent, -4.1 percent. Row 3: Log assets, A_e, 25.1 percent, 20.5 percent, 1, 71.2 percent, 20.5 percent. Row 4: Log consolidated Assets, A_c, 42.4 percent, 27.9 percent, 71.2 percent, 1, 11.8 percent. Row 5: Log wages, W_e, 26.5 percent, -4.1 percent, 20.5 percent, 11.8 percent, 1. Row 6: Log consolidated Wages, W_c, 26.5 percent, 21.8 percent, 26.0 percent, 39.4 percent, 75.5 percent, 1.
The measure of count of parents has some correlation with outbound degree, assets, consolidated assets, and consolidated wages (15.1%, 20.5%, 27.9%, and 21.8% correlations), but knowing how many parents an entity has tells us almost nothing about that single entity’s own payroll: holding corporations with hundreds of subscribers sometimes list zero employees; entities employing hundreds of employees often have no or few parent entities.
2.5.2 Distributions
The other indication that parent or child count is not a simple proxy for firm size is that assets and wages are closer to Lognormal than a Power Law. One means of checking this is against the distribution of assets or wages per entity; another is to follow ownership shares, consolidating subsidiaries’ assets and wages to parents as above. Figure 5 shows the distribution of assets and wages using both units of analysis and the best-fitting Lognormal and Power Law distributions. In all years, for both asset measures and entity-only wages, a likelihood ratio test indicates the Lognormal distribution is the more likely distribution with statistical significance beyond the 99.9% confidence level. To arrive at a Power Law distribution, the distributions of log size would need to be leptokurtic (have “fatter tails” at either end of the size distribution relative to a Normal distribution).
Top: the CCDF of assets at left and wages at right. Bottom: the distribution of consolidated assets at left and consolidated wages at right. The green curves are the best-fitting Lognormal distribution, the red lines the best-fitting Power Laws.

Figure 5 Long description
The image contains four graphs depicting the distribution of assets and wages, including consolidated assets and wages, with fitted lognormal and power law distributions. Panel A: The graph shows the complementary cumulative distribution function (CCDF) of entity assets. The x-axis represents entity assets in thousands of dollars, ranging from 10^5 to 10^12. The y-axis represents the CCDF, ranging from 10^0 to 10^-5. The blue line represents the actual data, the green dashed line represents the best-fitting lognormal distribution, and the red dashed line represents the best-fitting power law. Panel B: The graph shows the CCDF of entity wages. The x-axis represents entity wages in thousands of dollars, ranging from 10^5 to 10^11. The y-axis represents the CCDF, ranging from 10^0 to 10^-4. The blue line represents the actual data, the green dashed line represents the best-fitting lognormal distribution, and the red dashed line represents the best-fitting power law. Panel C: The graph shows the distribution of consolidated assets. The x-axis represents consolidated assets in thousands of dollars, ranging from 10^5 to 10^8. The y-axis represents the CCDF, ranging from 10^0 to 10^-5. The blue line represents the actual data, the green dashed line represents the best-fitting lognormal distribution, and the red dashed line represents the best-fitting power law. Panel D: The graph shows the distribution of consolidated wages. The x-axis represents consolidated wages in thousands of dollars, ranging from 10^5 to 10^7. The y-axis represents the CCDF, ranging from 10^0 to 10^-2. The blue line represents the actual data, the green dashed line represents the best-fitting lognormal distribution, and the red dashed line represents the best-fitting power law.
The figures do show, however, that the consolidated wage CCDF is relatively flat, not far from a straight-line Power Law. Axtell (Reference Axtell2001) used a sample of employee counts based on consolidation reports, an exercise most comparable to this figure, and found that subset to be closer to a Power Law distribution.
3. Local shape
To this point, we have looked at statistics of the overall distribution and aggregate statistics for the network; at the local level, what sort of patterns appear in the ownership structures? This section is primarily an accounting of what any given set of three, four, or five nodes looks like. It was implemented using a custom motif counter in plain C, using a Berkeley key-value store to encode graphs, and a Lua wrapper for scripting, intended to be extensible to other types of network analysis (Klemens, Reference Klemens2024).Footnote 8
The overall network is mostly a directed acyclic graph (DAG) and mostly a tree. It is difficult to economically rationalize entities that eventually own themselves, but cycles do exist in the entity network, with 16,708 of them in 2021. That is, in the human-inclusive network of 15,425,953 edges, breaking
 $0.11\%$
of links would produce a directed acyclic graph. Further, the majority of these—all but 7,359—are 2-cycles, where entity
 $A$
passes through P/L to entity
 $B$
, and
 $B$
passes P/L through to
 $A$
. These 2-cycles are often grouped, where one entity has several 2-cycles with several other entities.Footnote
9
The largest cycle contains 53 entities. It is plausible that large cycles like these formed by happenstance, and none of the parties involved actually know they are part of a cycle.
3.1 Motifs
An
 $N$
-motif is the shape formed by the edges connecting a set of
 $N$
connected nodes, regardless of any other edges connecting to the motif by nodes outside those
 $N$
nodes. Although the word motif is sometimes used to signify rare or unusual shapes, this article will use the term without regard to frequency.
For example, a triadic census would count only four possible types of 3-motif in a DAG: for the 2020 network, 66.3% two parents and one child (in the notation of Davis and Leinhardt (Reference Davis and Leinhardt1967), the 021U trigraph), 28.8% two children and one parent (021D), 4.8% straight-line ownership
 $A\to B\to C$
(021C), and 0.13% the directed triangle
 $A\to B\to C$
plus
 $A\to C$
(030T).
The 4-motifs prevalent in the giant connected component. Frequencies are after the 71.9% of connected subgroups with three parents and one child are excluded.

The motivic analysis finds almost every type of connected subgroup in the capital links network, from long chains to cycles to complete small connected subgroup, or what Shen-Orr et al. (Reference Shen-Orr, Milo, Mangan and Alon2002) refer to as dense regions of combinatorial interactions. But the great bulk of entity ownership patterns are quotidian groups of several owners of a single child or several children of a single parent. Among 4-motifs, 71.9% are three parents and one child, and among 5-motifs 71.2% are four parents and one child, but this is something of a combinatorial anomaly.Footnote
10
Setting aside the simple funnels of one entity owned by multiple parents, Figure 6 shows the remaining 4-motifs. All possible connected DAGs without multiple paths of ownership are displayed, all of which have likelihood greater than 0.95%, with the exception of the straight line
 $A\to B\to C\to D$
motif (whose paucity is also a combinatorial anomaly—see below for an inventory of straight-line ownership chains). All other 4-motifs that appear in the data have multiple paths of ownership between a parent and child and likelihood of 0.11% or below. Among 5-node connected subgroups, none with multiple chains of ownership appear with greater than 0.2% frequency.
Trend-wise, multiple paths of ownership (of any length) have a relatively small count but have steadily increased over time. The ratio of the count of multiple-path ownerships of any length to the count of edges (not paths, an exponentially larger count) expanded from 0.8% in the entity network of 2009 to 1.7% in 2021.
There is nothing illegal about multiple paths of ownership, and an entity or person with a specific interest in a sub-sub-subsidiary might find it easier to form a second direct link than rewrite the sequence of contracts and agreements along the original path. Nonetheless, these indirect paths are empirically infrequent, making the network close to a tree. This is distinct from small-world networks generated purely via social ties or models which grow a network by adding edges via weighted random draws, where cycles and indirect paths in the undirected graph may be common.
3.2 Diameter
If one wanted to transfer assets from one entity to another, how many entities would the assets have to go through? For every two nodes in the same connected subnetwork, there exists a shortest (undirected) path connecting them; the diameter of a network is the length of the longest shortest path. Bollobás and Riordan (Reference Bollobás and Riordan2004) shows that a small-world network has expected diameter
 $\log (N)/\log \log (N)$
, which in the case of the entity-only GCC of two million nodes is about 5.4, not far from the “six degrees of separation” cliché used to describe the incredible efficiency of small-world networks. But the diameter of the entity network varies from 32 to 46 over the study period. It only takes one or two firms choosing to build an exceptional ownership structure to expand the diameter, but average path lengths are also high, ranging between 9.07 and 10.86 over the study period. The median path length ranges between 9 and 10.
The low correlation between inbound and outbound link counts, 15.1%, indicates that there are few network hubs (typically holding companies) linking a large number of inbound links to a large number of outbound links. This is distinct from social networks where the well-socialized have both many links in and many links out.Footnote 11
The empirically observed aversion to multiple paths of ownership discussed above also expands the diameter of the network, as there are no shortcuts between distant nodes.
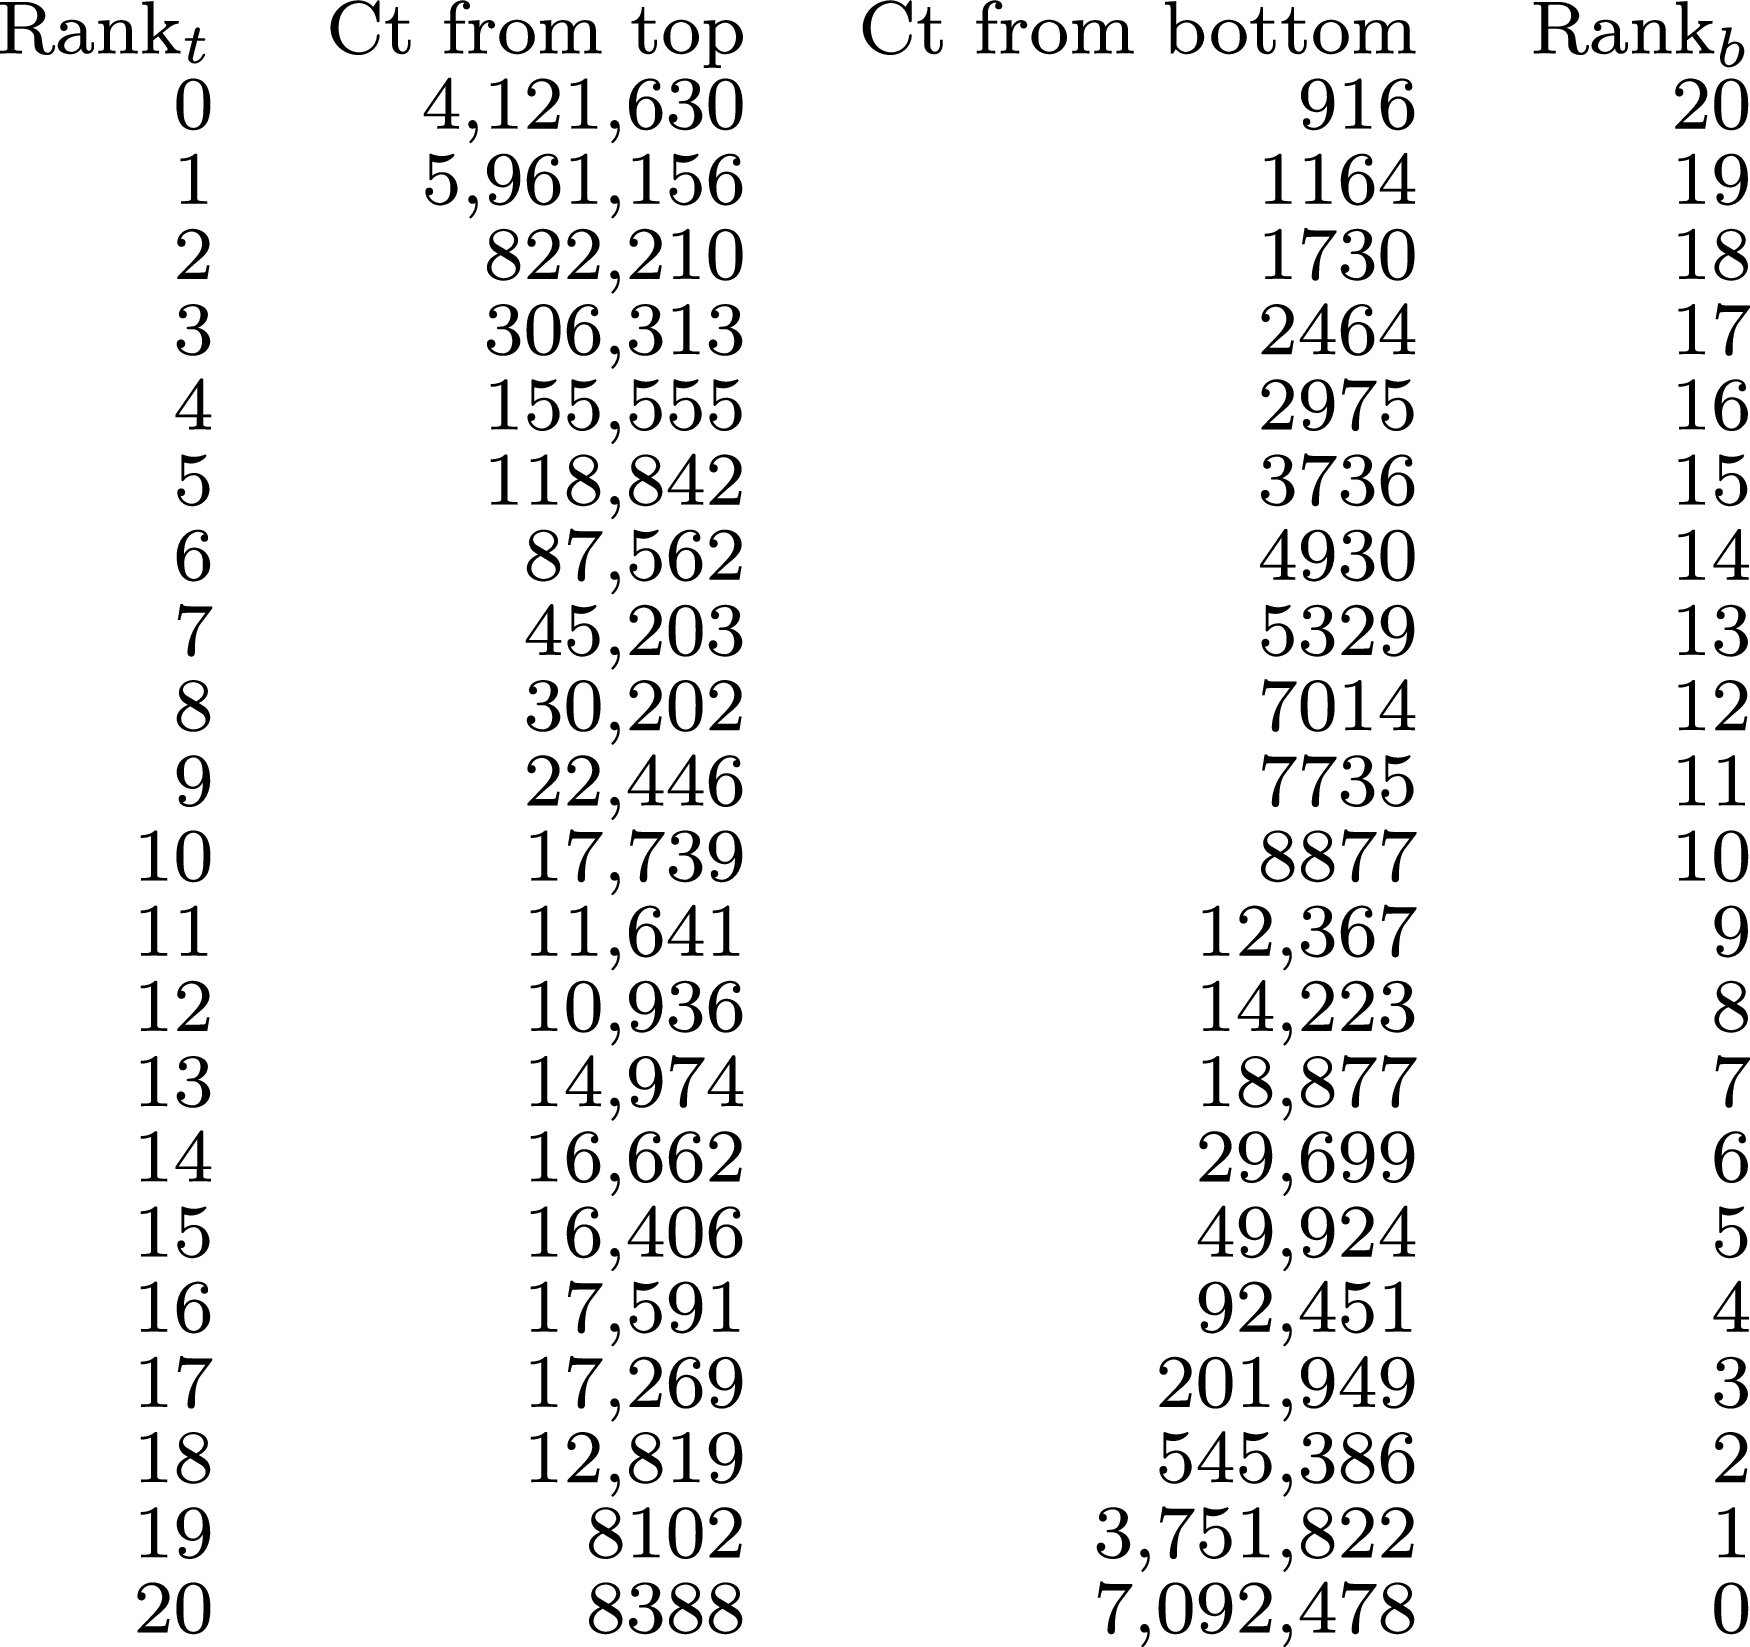
There are 4,121,630 entities (or people) at the top of the network. Removing them would reveal 5,961,156 entities beneath them. Similarly, one could start at the bottom of the DAG and progressively strip layers, recording the number of entities at each layer.

After snipping just enough edges to leave a DAG, we can measure how many entities are at each layer of the network. For the diameter, we allowed up-and-down paths, but for chains of ownership, we consider only directed paths, so the directed diameter is necessarily longer—and it is: the longest chain of ownership is 137 links long! That is, for a handful of entities at the bottom of the DAG, tracing all ultimate beneficial owners would require tracing through 135 intermediate entities. Or working from the top of the DAG, there are a handful of entities whose full financial position could not be determined until 135 ownership connections are followed.
Figure 7 demonstrates the height of the tree by incrementally stripping the tree, illustrating two methods of defining layer. In the top-down direction, there are 4,121,630 humans and entities with no owners, possibly including out-of-US entities where no US owner is observed. If those are stripped from the graph, then there would be 5,961,156 entities with no other owners (all S corps should be here), meaning it only takes one step to determine the ultimate beneficial owners of those entities. Continuing to strip one layer at a time, we traverse the full DAG, reaching the handful of entities whose ultimate beneficial owners can only be determined after 137 steps.
We can also define a node’s layer with reference to the bottom of the tree. There are 7,092,478 entities with no children, and if those are stripped away, there would be 3,751,822 entities at the now-lowest level.
Although only a few percent of the total entity count, long chains of ownership are no anomaly isolated to a handful of especially creative operators. It only takes one long chain to set the diameter of the graph, but there are over a hundred thousand entities ten or more steps in from either direction, at the levels shown and the hundred-plus levels beyond. And this inventory looks only at chains anchored at the top or bottom, not accounting for the many intermediate chains—given a chain of length 20, one can isolate
 $21-N$
chains of length
 $N$
within it, for any
 $N\leq 20$
.
4. Robustness checks
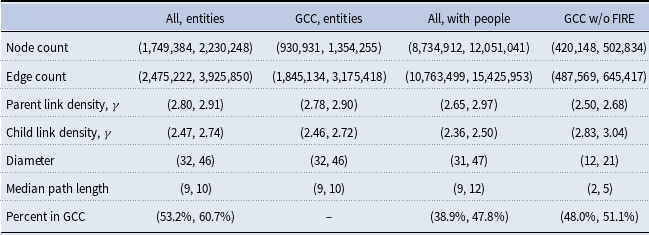
Robustness of the results can be evaluated by comparing the statistic under various situations. Table 3 presents ranges for the key statistics of this article with a few variants: including the entire graph of nodes with at least one edge versus the GCC only; including versus excluding people; excluding the large percentage of nodes in the finance, insurance, and real estate (FIRE) industries; over the period from 2009 to 2021, covering nine tax years before the 2017 tax reform took effect in tax year 2018 and four post-reform.
The range of key statistics, 2009–2021, for four subsets of the graph: the entire domestic-entity graph, the GCC of the domestic-entity graph, the graph including people and non-US entities, and the domestic-entity graph excluding finance and real estate

Table 3 Long description
The table presents ranges for key statistics under various situations, including the entire graph of nodes with at least one edge versus the GCC only, including versus excluding people, and excluding nodes in the finance, insurance, and real estate industries. The table has 4 columns and 7 rows. Column headers are Node count, Edge count, Parent link density, Child link density, Diameter, Median path length, and Percent in GCC. Row labels are All, entities, GCC, entities, All, with people, and GCC w/o FIRE. Row 1: Node count, (1,749,384, 2,230,248); (930,931, 1,354,255); (8,734,912, 12,051,041); (420,148, 502,834). Row 2: Edge count, (2,475,222, 3,925,850); (1,845,134, 3,175,418); (10,763,499, 15,425,953); (487,569, 645,417). Row 3: Parent link density, (2.80, 2.91); (2.78, 2.90); (2.65, 2.97); (2.50, 2.68). Row 4: Child link density, (2.47, 2.74); (2.46, 2.72); (2.36, 2.50); (2.83, 3.04). Row 5: Diameter, (32, 46); (32, 46); (31, 47); (12, 21). Row 6: Median path length, (9, 10); (9, 10); (9, 12); (2, 5). Row 7: Percent in GCC, (53.2 percent, 60.7 percent); (38.9 percent, 47.8 percent); (48.0 percent, 51.1 percent).
Expanding from the network of business entities to those plus their flesh-and-blood human owners (and estates, trusts, nonprofits, and links to overseas entities) expands the node count by about a factor of five, yet the Power Law distribution continues to hold well.
At the macro scale, the patterns are consistent. For link densities, the largest range among the eight variants is outbound links including human and other non-business entities, where
 $\max (\gamma )$
is about 12.1% larger than
 $\min (\gamma )$
.
The exceptionally wide diameter and median path length persists after adding people and other non-business entities and including or excluding out-of-GCC groups, where the norm is only one or two links of depth. The diameter of the network does fall by about half when FIRE-only links are excluded from the network, indicating that such links are a key medium by which especially long chains are formed. But the node and edge counts fall by an order of magnitude when FIRE entities and entities whose only links are to FIRE entities are excluded.
5. Conclusion
The entity network presented here is a representation of the full flow of capital in the United States economy, albeit excluding large but network-uninformative allocations via loans and less substantial (
 $\!\lt 20\%$
ownership) public-exchange stock purchases. It embodies both interpersonal and operational decisions.
If we haphazardly pull a small neighborhood from the network, it will probably be an unremarkable and simple tree-like structure of several owners holding shares of one entity or one entity owning several others. Consistent with Love (Reference Love2025), most businesses do not take up the opportunity the law affords to invent complicated structures—and then a small minority enthusiastically do. The overview of 4-motifs and 5-motifs of Section 3 showed that no matter how convoluted a set of nodes and edges can get—even after removing cycles of ownership—somebody has built a business structure to match it.
At the macro scale, the Power Law patterns of cluster sizes and link densities is remarkably consistent, which provides economists with an opportunity to add a new metric to their tool kit.
One type of market power in an industry comes from a small number of large players; measures such as the Herfindahl-Hirschman Index (HHI) track such large players. Another type would be control of a large number of smaller players; if there are many entities using this strategy, the Power Law exponent measure would track this. This article established that the Power Law coefficient
 $\gamma$
is a well-defined measure, which could be used to measure the concentration of capital ownership links in the U.S. economy. Samuel and Conlow (Reference Samuel and Conlow2025) describe private equity buyouts of large swaths of an industry—with health care as a notable example—as not well-regulated, partly because they are not well-measured. Whether private equity buyouts should be regulated, and if so how, is beyond the scope of this article, but a measure of link density and its changes would be a useful indicator of which industries may merit watching for this type of consolidation.
Figure 3 calculated
 $\gamma$
for 117 situations (9 industries
 $\times$
13 years) and showed consistent differences for two industries and detected a structural shift for the health care industry one year into the COVID-19 pandemic. Similar comparisons could be done between
 $\gamma$
for the U.S. capital flow network versus those in other countries at different levels of development. A database of measures of
 $\gamma$
in different contexts would allow searching for relations between
 $\gamma$
and other macroeconomic indicators.
A high concentration indicates a network with a small number of critical nodes; as in international capital flow networks, those nodes may be points of failure for the network (Park and Yang, Reference Park and Yang2021). They can also indicate a slide from a competitive industry to one controlled by a few equity-holding entities. Within industries, concentration measures are often used as barometers of healthy competition and competitive pricing; such measures often focus on only the top few competitors. For the perfect large-
 $N$
theory, the “law of nature” of the Power Law tells us that both top-tier and full-distribution measures should generally correlate: if there is higher concentration at the top, there is likely higher concentration all the way through the chain. For
 $N\lt \infty$
the measures can easily differ, depending on the strategies chosen by players in the industry.
The common ownership hypothesis is a set of claims that if managers have partial control of competing firms, they will select policies which are less competitive and may reduce the profits of one firm or the other in a manner which may be considered collusion but which may maximize the managers’ profits (Backus et al., Reference Backus, Conlon and Sinkinson2021; Hemphill and Kahan, Reference Hemphill and Kahan2019). In the context of publicly traded firms, the literature is somewhat inconclusive about the extent of cross-organizational optimization at the expense of the firms or consumers; with the full network laid out, this is not surprising. On the one hand, for typical complementary partnerships, such as retirement homes which list each other as owners or an entity with a separate real estate holding company, behavior aimed at optimizing profits for the owners rather than the individual entities is to be expected, just as it would be between multiple departments of a single legal entity. On the other, with the majority of entities in the GCC, it is difficult to segregate such focused interests from adjacent unrelated or countervailing interests. Understanding the concentration of common ownership may give us insight into the balance of competition and coördination in the economy.
This article also offers evidence for use in modeling the growth of the business network, which falls between a number of different types of network generation.
-
• Firms grow by amassing more assets or a larger payroll, which as per Figure 5 follows a Lognormal distribution, consistent with each entity seeing a Central Limit Theorem-style sequence of independent and identically distributed multiplicative shocks to its size.
-
• They may divide their organizational components into distinct entities, and the wide diameter of the network, higher-than-expected average and median path length, and nearly-tree nature hints at a network that has components approximating centrally planned corporate organization charts. It is notable that very complex subnetworks exist within the whole, but infrequently; either there are very unusual circumstances that need to be modeled, or there is a distinct type of investor who has an enthusiasm for complex business structuring that the great majority of investors lack.
-
• Long ownership chains are common, and shortcuts infrequent. Also, finance and real estate firms are over-represented in the network, even in networks where all edges have some association with a non-FIRE industry. When all FIRE firms are removed, average path length noticeably drops (see Table 3). This indicates that FIRE firms are a distinct type of entity playing a key rôle as glue in the network and in causing ownership chains.
-
• The decisions in aggregate generate a network whose Power Law distribution of links matches that of social networks. Partnerships and other entities are indeed partnerships between independent people or entities’ owners whose social ties are sufficiently close that they are willing to share risks and capital, putting the network in the class of social, typically small-world settings, including outbound emails (
$\gamma =2.03$
, Ebel et al. (Reference Ebel, Mielsch and Bornholdt2002)), sexual networks (for men
$\gamma =2.31$
, for women
$\gamma =2.54$
, Liljeros et al. (Reference Liljeros, Edling, Amaral, Stanley and Åberg2001)), and scientific collaborations (
$\gamma \approx 2.5$
, Newman (Reference Newman2001)).


Data availability statement
The data set is restricted to use on the Internal Revenue Service’s Research, Applied Analytics and Statistics Division (RAAS) RAAS; contact RAAS for details of access.
Funding statement
This research did not receive any specific grant from funding agencies in the public, commercial, or not-for-profit sectors.
Competing interests
None.











 γ
 γ




 Open access

