Introduction
The dominant weather type in the interior of Antarctica is the fair-weather situation, characterized by low cloud amounts and weak large-scale wind, which is easterly at low-tropospheric levels. A negative net radiation budget at the snow surface results in a stable atmospheric boundary layer (ABL), which is cold compared to the free atmosphere. Over sloping surfaces, this temperature deficit yields a horizontal pressure gradient in down-slope direction, which produces the well-known katabatic flow (Ball Reference Ball1956). Exceptions to this situation are found when weak convection occurs due to absorption of solar radiation around noon in mid-summer (Mastrantonio et al. Reference Mastrantonio, Malvestuto, Argentini, Georgiadis and Viola1999), or when cold air is advected over a relatively warm snow surface (Neff & Hall Reference Neff and Hall1976). Associated with fair weather is large-scale subsidence due to low-level katabatic outflow over the continent, and clear-sky precipitation, caused by the formation of ice crystals in cooling saturated air. The near-surface atmosphere in fair-weather situations over Antarctica has been discussed by e.g. Kottmeier (Reference Kottmeier1986), Kodama et al. (Reference Kodama, Wendler and Ishikawa1989), Renfew (Reference Renfrew2004), and Van As et al. (Reference Van As, Van den Broeke and Helsen2006).
A second prominent weather type has strong winds and cloudy skies and is caused by a large-scale atmospheric disturbance. The most intense disturbances are cyclonic low-pressure systems, often called extratropical cyclones. Cyclones usually form as mid-latitude systems that migrate south until they reach the Antarctic continent, where they move along the coast in easterly direction (Jones & Simmonds Reference Jones and Simmonds1993). For this reason, the region with a high density of depression tracks north of Antarctica is a climatological pressure trough. The elevated Antarctic interior is shielded from cyclonic low-pressure systems by the escarpment zone (Carleton & Carpenter Reference Carleton and Carpenter1990, Sinclair Reference Sinclair1994). However, the largest of the low-pressure systems can either influence the atmosphere over large parts of the interior from their coastal location, or on occasion move onto the plateau (Pook & Cowled Reference Pook and Cowled1999). These cyclones transport marine air towards the Antarctic interior, where they are the main source of moisture (Naithani et al. Reference Naithani, Gallee and Schayes2002).
Anticyclonic high-pressure systems migrate around the Antarctic continent similar to low-pressure cyclones. Anticyclones cover a larger spatial area than cyclones, and locally produce fair-weather conditions. However, the blocking ability of anticyclones can have a large impact on the meteorology of the Antarctic interior. Blocking anticyclones (or blocking highs) are nearly stationary high-pressure systems, obstructing the zonal circumpolar airflow. This can result in northerly advection of warm and moist air over the Antarctic continent, or even the migration of low-pressure cyclones onto the plateau. Blocking highs can remain in place for several days, causing the areas affected by them to have the same kind of weather for an extended period of time. Blocking highs are most often found in the south Atlantic Ocean (Sinclair Reference Sinclair1996), the south Tasman Sea (Trenberth & Mo Reference Trenberth and Mo1985), and the south-east Pacific Ocean (Marques & Rao Reference Marques and Rao1999).
The impact of blocking events has for instance been described by Enomoto et al. (Reference Enomoto, Motoyama, Shiraiwa, Saito, Kameda, Furukawa, Takahashi, Kodama and Watanabe1998), who presented observations of a large wintertime temperature rise at the interior base Dome Fuji (Fig. 1), caused by blocking activity to the east, transporting relatively warm air onto the plateau. Noone et al. (Reference Noone, Turner and Mulvaney1999) highlighted two large snowfall events in Dronning Maud Land which were the result of a blocking high-pressure ridge or anticyclone in the south Atlantic Ocean. Murphy (Reference Murphy2003) investigated strong-wind events (SWEs) at the coastal Casey and Mawson stations, and found that all events were related to cyclonic low-pressure systems near the stations, often in combination with a high-pressure ridge blocking eastward migration. Massom et al. (Reference Massom, Pook, Comiso, Adams, Turner, Lachlan-Cope and Gibson2004) investigated three large precipitation events at Dome C on the plateau and Law Dome near the coast, all of which were related to blocking in the south Tasman Sea.
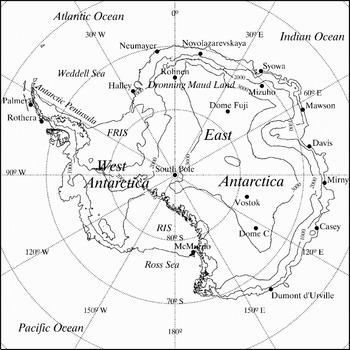
Map of Antarctica. FRIS = Filchner/Ronne Ice Shelf, RIS = Ross Ice Shelf. Surface elevation is given in metres.

During such events the windy and often cloudy conditions (Naithani et al. Reference Naithani, Gallee and Schayes2002, Murphy Reference Murphy2003) west of the blocking high have a large impact on the near-surface atmosphere. The surface-based temperature inversion is destroyed by strong turbulent mixing and a non-negative radiation budget, creating a near-neutral Ekman-type ABL where forcing is dominated by the large-scale flow. Strong-wind events over the Antarctic Plateau have mostly been discussed in terms of their effect on the surface mass budget through precipitation and snowdrift. This is of interest to ice core research, because ice cores are usually drilled in these remote locations. Noone et al. (Reference Noone, Turner and Mulvaney1999) determined for the high-elevation parts of Dronning Maud Land from European Centre of Medium-Range Weather Forecasts (ECMWF) re-analysis data that high-precipitation days are scarce (~1%), but account for 20% of the total precipitation. Similar results were put forward by Reijmer & Van den Broeke (Reference Reijmer and Van den Broeke2003), using sonic height ranger data from automatic weather stations (AWSs) in various regions of Dronning Maud Land.
In this paper we focus on the meteorology of strong wind events over the Antarctic Plateau. We aim to quantify the frequency of occurrence of large-scale disturbances for a location in the Antarctic interior and to assess the impact of these events on the surface and near-surface atmosphere. The study uses observational data from the coastal Neumayer Station in Dronning Maud Land, East Antarctica (Fig. 1), and data gathered at Kohnen Station (75°00′S, 0°04′E, 2892 m above sea level (a.s.l.)) during the EPICA-Netherlands Atmospheric Boundary Layer Experiment (ENABLE) between 7 January and 11 February 2002. To support the interpretation of the observations we also use ECMWF Re-Analysis (ERA-40) data. In the next section we give details of the observations and ERA-40.
Methods
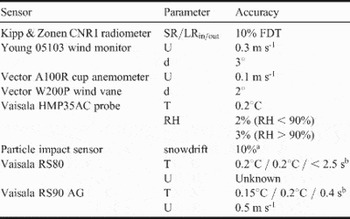
Most of the data presented in this paper were obtained at Kohnen Station. During ENABLE, temperature (T), relative humidity (RH) and wind speed (U) sensors were mounted at approximately 0.5, 1, 2, 5 and 10 m for profile studies. Upward and downward shortwave and longwave radiation fluxes (SR and LR) were measured at 1.1 m and snowdrift impact at 0.2, 0.6 and 1.1 m. Table I lists sensor types and their measurement uncertainties as specified by the manufacturers. RH observations by the Vaisala HMP35AC sensor need correction at low T, which was done according to the method proposed by Anderson (Reference Anderson1994). The uncertainty of the snowdrift sensors is estimated at 10% according to Bintanja et al. (Reference Bintanja, Lilienthal and Tug2001) and arises due to non-elastic collision, flow distortion of the sensor, and oblique impacting. We performed quality checks on all data to eliminate for instance periods with ice deposition on the sensors. Next, we calculated half-hourly averages. A comparison study between the Kipp & Zonen CNR1 radiation measurements and high quality Baseline Surface Radiation Network data at Neumayer Station suggested a smaller measurement uncertainty than reported in Table I (2.7% for SR and 1.2% for LR). Net SR accuracy was further improved by correcting for the poor cosine response at zenith angles over 80° as stated in the sensor manual (Van den Broeke et al. Reference Van den Broeke, Van As, Reijmer and Van de Wal2004). Fair-weather results of the ENABLE campaign were presented by Van As et al. (Reference Van As, Van den Broeke, Reijmer and Van de Wal2005a, Reference Van As, Van den Broeke and Helsen2006).
Measurement uncertainties according to manufacturer for parameters used in this paper. FDT = for daily totals.

aBintanja et al. (Reference Bintanja, Lilienthal and Tug2001), brepeatability (σ of differences between successive calibrations) / reproducibility (σ of differences in twin soundings) / time lag.
For long-term observations we use data of an AWS, which has been operational at 2 km distance from the present location of Kohnen Station since December 1997. The AWS stores hourly-mean values of pressure, temperature, relative humidity, wind speed and direction, broadband longwave and shortwave radiative fluxes, instrument height and snow temperature at five depths.
We also use radiosonde observations from Neumayer that are obtained as part of the regular meteorological programme at the base. Vaisala RS80 sondes were used in 2002, which is the predecessor of the Vaisala RS90 AG that was used during ENABLE (Table I), and has improved specifications for accuracy and response time of pressure, temperature and relative humidity. For both types of radiosondes the humidity measurements are unreliable in the stratosphere (Gert König-Lango, AWI, personal communication 2006).
To support the interpretation of the observations we use ECMWF re-analysis data (Uppala et al. Reference Uppala, Kallberg, Simmons, Andrae, Bechtold, Fiorino, Gibson, Haseler, Hernandez, Kelly, Li, Onogi, Saarinen, Sokka, Allan, Andersson, Arpe, Balmaseda, Beljaars, Van de Berg, Bidlot, Bormann, Caires, Chevallier, Dethof, Dragosavac, Fisher, Fuentes, Hagemann, Holm, Hoskins, Isaksen, Janssen, Jenne, McNally, Mahfouf, Morcrette, Rayner, Saunders, Simon, Sterl, Trenberth, Untch, Vasiljevic, Viterbo and Woollen2005), which has a horizontal grid spacing of 125 km (T159) and about half of its 60 vertical levels in the Antarctic troposphere. The re-analysis covers a period of over 40 years, ending in August 2002. The ECMWF model south of 50°S is constrained by daily radiosonde soundings performed at the coastal stations in Antarctica and ship-based observations, and by profiles obtained from satellite observations. The limited spatial resolution and relatively low spatial coverage of observations in the Antarctic region complicate sub-grid scale studies of the Antarctic atmosphere using ERA-40. However, the data is very suitable for studies of the large-scale properties of the atmosphere in this region.
Results
The large-scale flow during ENABLE
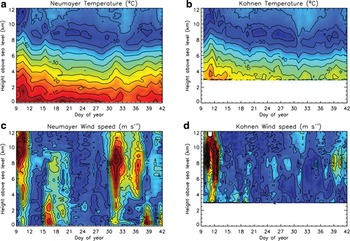
To highlight tropospheric variability and the differences between the Antarctic coast and interior, Fig. 2 shows contour plots of T and U at Kohnen Station and at the coastal Neumayer Station from daily radiosondes measurements between 9 January and 10 February 2002. In the 33-day period under consideration, tropospheric temperatures at both stations on average dropped 5–10°C due to radiative cooling as solar elevation decreased, and the tropopause lowered from about 11 km to 8 km a.s.l. (Fig. 2a & b). The figure shows that the free-atmospheric temperature is fairly comparable at both locations. Due to the difference in latitude, tropospheric temperatures at Kohnen were about 2°C lower than at Neumayer. This difference was larger below 5 km a.s.l., presumably caused by enhanced radiative cooling of the atmosphere over the Antarctic interior.
a, b. Temperature, and c, d. wind-speed observations over Neumayer and Kohnen for the ENABLE period.

The mean tropospheric wind speed at Kohnen was 6–10 m s-1 during ENABLE, depending on height, but U over Neumayer was on average about 4 m s-1 larger (not shown). Figure 2c & d show that this difference is due to the larger number of strong-wind events (SWEs) occurring at Neumayer during ENABLE. We can roughly separate four events observed at Neumayer and divide them into two types: either they are a lower-tropospheric SWE (16 January and 7 February) or an upper-tropospheric SWE (around 10 and 31 January). These vertical U gradients are the result of the nature of the large-scale systems. Whereas warm-core cyclones and cold-core anticyclones have decreasing intensity with height, cold-core cyclones and warm-core anticyclones are most active in the upper troposphere.
The events around 16 January and 7 February were caused by warm-core low-pressure systems centred 500–1000 km off the coast from Neumayer, around 10–20°W. Strong easterly winds were recorded in the coastal regions near Neumayer. At Kohnen the winds were much weaker, as it was located further away from the centre of the depression, but also since warm-core cyclones are lower-tropospheric phenomena, while Kohnen is situated at 2892 m a.s.l. Whether cyclonic systems can produce high wind speeds over the Antarctic Plateau is dependent on their vertical structure. From this we may assume that the escarpment region more effectively shields the Antarctic interior from lower-tropospheric, rather than from upper-tropospheric, disturbances.
The wind speed at Kohnen did show a slight increase below 4 km a.s.l. on 16 and 19 January (Fig. 2). We will see below that this increase penetrated the near-surface layer at Kohnen, evidenced by strong winds and snowdrift. However, during these events only low cloud amounts were observed at Kohnen (10–30%). We suspect that a better developed warm-core cyclone over the north-east Weddell Sea will cause stronger winds, more clouds and precipitation at Kohnen. Noone et al. (Reference Noone, Turner and Mulvaney1999) showed that cyclonic activity in the north-east Weddell Sea can produce large snowfall events at Kohnen Station.
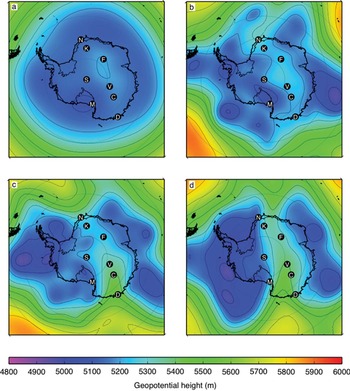
The strong upper-level winds between day 30 and 37 at Neumayer during ENABLE were not observed over Kohnen. In this period a large cold-core cyclone was situated off the coast at Syowa Station, at 40°E, which forced strong upper-tropospheric winds of about 30 m s-1 (the circumpolar jet stream) in north-easterly direction over Neumayer, but not over the interior of Dronning Maud Land. Contrasting to this, the upper-tropospheric strong winds found at the beginning of ENABLE were northerly and found over both stations (Fig. 2). The development towards this atmospheric situation is shown from ERA-40 data in Fig. 3. First, in Fig. 3a the climatology of the 500 hPa geopotential height in January is given. A fairly axisymmetrical decrease in height towards the pole exists. Mean pressure values increase slightly over the Antarctic continent; the climatological pressure through is located parallel to most of the Antarctic coastline. On 7 January 2002 an irregular pattern of several low-pressure areas around and over Antarctica is found (Fig. 3b). Two days later, the low-pressure areas became grouped in two distinct regions; one over West Antarctica, and one stretched along a large section of the East Antarctic coast (Fig. 3c). Two anticyclonic systems influenced the grouping; one in the South Atlantic Ocean, and one in the south Tasman Sea. The latter redirected part of the circumpolar airflow over the plateau region of Dome C. On 11 January a clear split-up of the circumpolar vortex had been established and air of both high-pressure areas was being exchanged across the Antarctic Plateau (Fig. 3d).
Geopotential height of the 500 hPa level over Antarctica from ERA-40 data. a. Climatology for January (1957–2002), and situation at noon b. 7 January, c. 9 January, and d. 11 January 2002. N = Neumayer, K = Kohnen, F = Dome Fuji, S = South Pole, V = Vostok, C = Dome C, M = McMurdo, D = Dumont d'Urville.

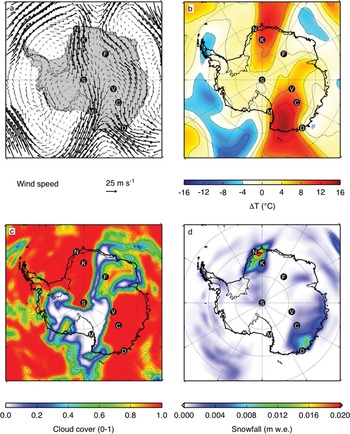
Figure 4a shows the ERA-40 wind field at 500 hPa during the split-up. Two upper-tropospheric jets of large U were found over the plateau in the regions of the largest pressure gradients. The first ranged from western Dronning Maud Land to Victoria Land, over Neumayer, Kohnen (see Fig. 2), South Pole and McMurdo. The second was in opposite direction, from Adélie Land, wherein Dumont d'Urville Station is positioned, to the eastern part of Dronning Maud Land. Fairly similar large-scale flow patterns have been discussed by Sinclair (Reference Sinclair1981) and Noone et al. (Reference Noone, Turner and Mulvaney1999).
The unusual airflow over Antarctica brought along anomalous local weather conditions. Figure 4b shows the temperature distribution relative to the January mean for 1957–2002 at the 500 hPa level. The southerly flow is accompanied by relatively high temperatures, exceeding mean values by more than 10°C. The high free-atmospheric temperatures were found over more than half of the East Antarctic Plateau. Relatively low temperatures did not occur over Antarctica, with the exception of the Antarctic Peninsula and some coastal regions. Overcast conditions were calculated for large sections of East Antarctica, corresponding to the areas of southward flow over the continent (Fig. 4c). Regions of strong outflow were cloud-free, such as the western part of the Ross Ice Shelf and the coastal section of Dronning Maud Land around 20°E. The amount of precipitation is presented for 11 January 2002 in Fig. 4d. Western Dronning Maud Land, Adélie Land and most of Wilkes Land received precipitation, in quantities of up to 20 mm water equivalent according to ERA-40. Precipitation values are highest for regions with steep slopes, but the inland bases of Kohnen and Dome C received significant amounts of snow as well, which is in agreement with observations.
ERA-40 a. wind field and b. temperature at 500 hPa, c. cloud cover over Antarctica for noon 11 January 2002. d. Precipitation on 11 January in mm water equivalent (w.e.). Base names are given in the caption of Fig. 3.

The extreme nature of the split-up of the circumpolar vortex in January 2002 appears from the number of studies dedicated to aspects of the event at multiple locations across Antarctica. For instance, Turner et al. (Reference Turner, Harangozo, Marshall, King and Colwell2002) showed that the event was part of an anomalous atmospheric circulation in the summer of 2001/02, causing a build-up of sea ice in the Weddell Sea, off the coast of western Dronning Maud Land. Massom et al. (Reference Massom, Stammerjohn, Smith, Pook, Iannuzzi, Adams, Martinson, Vernet, Fraser, Quetin, Ross, Massom and Krouse2006) presented similar results for the western Antarctic Peninsula. In both studies extraordinary wind speeds and temperatures measured at stations on the Antarctic Plateau are mentioned; peak values occurred on 11 January 2002. The atmospheric circulation over Dronning Maud Land has been described by Birnbaum et al. (Reference Birnbaum, Brauner and Ries2006) because of the large amount of snowfall it caused at Kohnen (quantity not specified). They dubbed it a typical case of snowfall related to a well-developed low-pressure system in the Weddell Sea and a blocking high north of Dronning Maud Land. Massom et al. (Reference Massom, Pook, Comiso, Adams, Turner, Lachlan-Cope and Gibson2004) reported about the SWE at Dome C, which was attributed to blocking-high activity in the south Tasman Sea. At Dome C the event caused 48 mm of precipitation in six days time, roughly half of the mean annual snowfall. Relatively high near-surface U was measured at Dome C during a prolonged period in the first half of January 2002 (Stefania Argentini, ISAC/CNR personal communication 2006). Also near-surface measurements at South Pole and Vostok stations identify the same SWE accompanied by relatively high temperatures around 11 January (not shown).
We conclude that some large-scale events are sufficiently widespread to have a significant impact on the near-surface climate of virtually the entire Antarctic Plateau. Sinclair (Reference Sinclair1981) reported of such a large-scale event with record-high temperatures at the inland South Pole and Vostok stations. He found similar readings at the coastal McMurdo base, which is remarkable as for the upper-tropospheric event in January 2002 the impact was larger at Kohnen than at Neumayer due to the difference in elevation (Fig. 2).
Having identified a significant SWE over the Antarctic Plateau during the ENABLE period, in the following sections we will investigate the occurrence of SWEs over the plateau and describe their impact on the near-surface atmosphere using observational data.
The occurrence of strong-wind events
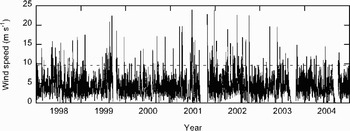
In many parts of Antarctica near-surface wind speed is larger in winter than in summer (Van den Broeke & Van Lipzig Reference Van den Broeke and Van Lipzig2003) since the temperature deficit is largest in winter, and katabatic forcing often dominates the dynamics of the ABL (Van den Broeke et al. Reference Van den Broeke, Van Lipzig and Van Meijgaard2002). Yet at Kohnen Station no significant annual cycle appears in near-surface wind speed from a 7 year period of AWS measurements (Fig. 5, Table II). Van den Broeke & Van Lipzig (Reference Van den Broeke and Van Lipzig2003) found this near-surface wind-speed constancy to be common for locations on the plateau, and attributed it to an increase of large-scale forcing in summer. For our AWS observations at Kohnen, however, the key explanation is that the measurement level of the AWS is located too far below the height of a katabatic jet, where wind speed is low due to friction at the surface. Inside the surface layer wind speed reacts strongly to static stability variations. For the summer period, Van As et al. (Reference Van As, Van den Broeke and Van de Wal2005b) found that solely due to the daily cycle in the stability-related curvature of the near-surface profile, U at 2 m decreases during the night at Kohnen while it simultaneously increases at higher levels. Low-level AWS observations are therefore unsuitable to detect katabatic jets on the plateau. The largest wind speeds at screen level at a plateau site are caused by strong large-scale forcing, causing the ABL to be well mixed and of near-neutral stratification.
Hourly-mean values of wind speed at 2 m height at Kohnen Station for 1998–2004 (solid line) and the lower limit denoting strong-wind events in this study (Beaufort scale ≥ 6) (dashed line).

Monthly-mean two-meter values and standard deviations of wind speed, temperature, temperature during strong-wind events, and the occurrence of strong winds at Kohnen Station between 1998 and 2004.

By definition, strong winds have a minimum value of 10.8 m s-1 at 10 m height (Beaufort scale 6), which translates into U > 9.5 m s-1 at 2 m for neutral stratification. In this paper we will consider every event that fulfils this criterion to be a SWE. For this calculation we used a surface roughness length for momentum (z0) of 2 × 10⁻⁵ m, as determined by Van As et al. (Reference Van As, Van den Broeke, Reijmer and Van de Wal2005a) for fair-weather conditions at Kohnen. Even though z0 is larger during snowdrift (Bintanja Reference Bintanja2001), we used the fair-weather value for simplicity. A higher z0 value would yield a slightly lower limit for SWEs. The SWE criterion is close to the mean +2× standard deviation value, which is 9.6 m s-1 for the hourly-mean values of a 7 year period at Kohnen Station.
The AWS at Kohnen registered between 10 and 20 SWEs per year since installation in December 1997 (Fig. 5), about 4% of the 7 year observational period. The largest recorded wind speeds are over 20 m s-1. SWE frequency is greater in wintertime (5–8%) than in summertime (1–4%, Table II). However, no significant correlation between monthly-mean U and the amount of SWEs can be found. Large snowfall events (> 2 mm water equivalent) take place just over once per year (about 1% of the time) at the location of Kohnen, as determined by Noone et al. (Reference Noone, Turner and Mulvaney1999) for a 19 year period. This implies that a quarter of the SWEs at Kohnen Station are accompanied by relatively extreme amounts of snowfall, adding up to a large part of the mean annual precipitation.
The rare large-scale atmospheric circulation around 11 January 2002 recognized in the previous section did not produce extraordinarily strong near-surface winds as seen in Fig. 5. We consider the near-surface conditions of this event to be fairly typical for a SWE at Kohnen Station. Below we investigate the behaviour of the near-surface atmosphere during this event.
The impact of strong winds on the near-surface climatology: a case study for Kohnen Station, January 2002
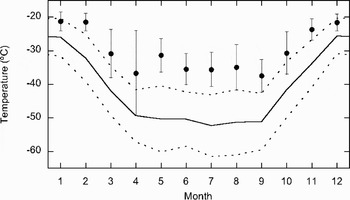
Figure 6 shows the annual cycle of monthly-mean AWS temperatures both for the full 7 year period (solid line), and for SWEs (dots). Temperature for all wind conditions undergoes a pronounced annual cycle, with relatively high values in December and January around -26°C (Table II), a ‘coreless’ winter over a 6 month period at about -51°C, and the transition months in between. Whereas the SWEs have little impact on the annual cycle in U, the impact on 2 m T is strong. T during SWEs (Tsw) is significantly higher than the monthly-mean T throughout the year. This is because SWEs are usually associated with a horizontal advection of heat from the north, the destruction of the surface-based T inversion, and high cloud amounts, preventing radiative cooling of the surface (see next subsection). The difference between monthly-mean T and Tsw is larger in winter (about 16°C) than in summer (4–5°C), owing to the larger base strength of the temperature inversion in winter, yielding a larger temperature rise during its destruction. Moreover, the large-scale meridional T gradients over Antarctica are larger in winter, implying a larger temperature increase during northerly large-scale flow. Due to the larger sensitivity of near-surface T to U in winter, the standard deviation in T is also highest in this period.
The annual cycle of monthly-mean two-meter temperature measurements at Kohnen Station for all wind speeds (solid line; dotted lines denote standard deviation), and for strong-wind events (dots; lines denote standard deviation).

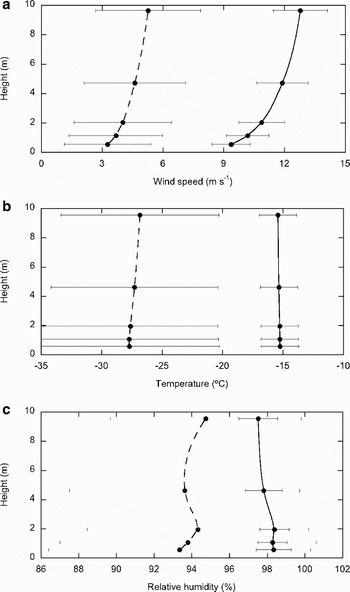
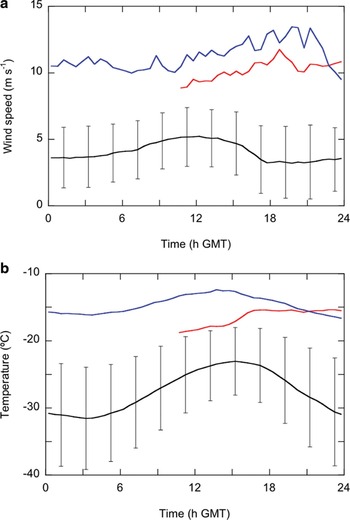
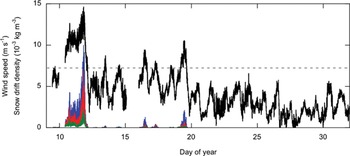
The SWE during the ENABLE campaign allows us to study the impact of strong large-scale winds on the near-surface atmosphere in more detail. Figure 7 compares mean profile-mast measurements of 10 and 11 January 2002, the time period of the SWE, to the ENABLE-mean values over the full period (7 January–11 February). Profile-mast data of the morning hours of 10 January prior to the strong winds were not stored due to power-related problems. Figure 7a shows that mean wind speed increases from 9.4 m s-1 at 0.5 m height to 12.8 m s-1 at 10 m height, which classifies this as a SWE for this location (Fig. 5). The observed temperature and wind are outside the range of standard deviations of the ENABLE means. This is valid for every moment of the day, as shown for 2 m height in Fig. 8a. The figure also shows that U during 10 and 11 January is rising slowly until a small peak is found around 20 h GMT on 11 January, after which U rapidly drops. Note the daily cycle in ENABLE-mean U; the largest values were recorded at noon in convective conditions, and a minimum was found at the beginning of the evening, when static stability peaked (Van As et al. Reference Van As, Van den Broeke and Van de Wal2005b). This daily cycle is clearly seen in the 2 m U observations for most summertime days as shown in Fig. 9 for January 2002. The day-to-day variability is found to be large, explaining the large standard deviation of U values in Figs 7 & 8.
Mean profile-mast measurements and standard deviations of a. wind speed, b. temperature, and c. relative humidity with respect to ice during 10 and 11 January 2002 (solid line) and the entire ENABLE period (dashed line).

Two-meter a. wind speed and b. temperature at Kohnen for 10 January (red lines), 11 January (blue lines), and their means and standard deviations for the entire ENABLE period (black lines). Data gaps are due to power-related problems.

Two-minute mean values of 2 m wind speed (black line) and snow drift density at 0.2 m (blue line), 0.6 m (red line) and 1.1 m height (green line) at Kohnen Station in January 2002. Gaps in wind-speed data were caused by power-related difficulties.

Figure 9 also shows the snowdrift observations of ENABLE. In accordance with observations at the coastal Halley Station described by Mann et al. (Reference Mann, Anderson and Mobbs2000) we found that snowdrift during ENABLE occurred for friction velocity values in excess of 0.25 m s-1, indicated in the figure by the dashed line at 7.2 m s-1 (calculated assuming neutral stratification).
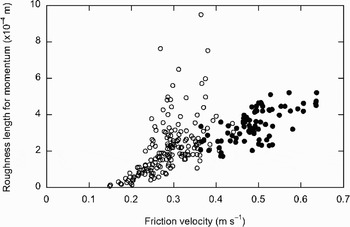
As mentioned above, z0 increases as a result of the suspension of snow particles. We investigated this by fitting neutrally-stratified wind profiles to half-hourly mean profile-mast observations using the least-squares method. Not using stability-correction parameters leaves z0 to determine the curvature of the wind-speed profile. The fitting routine calculates for which z0 value the fit is best. High correlations between observed and calculated values automatically yield accurate measurements in periods of near-neutral stability, thus including conditions with strong winds and snowdrift. Figure 10 presents the z0 values for correlations larger than 0.99 (circles) and 0.999 (dots), for the ENABLE period with snowdrift (10–20 January). The figure suggests that snowdrift causes z0 to increase approximately linearly with friction velocity. At a friction velocity of 0.6 m s-1 a roughness length is found over 20 times its value during tranquil conditions (2 × 10⁻⁵ m). z0 increases for friction-velocity values over about 0.18 m s-1, for which snowdrift was not yet recorded. Between friction-velocity values of roughly 0.18 and 0.25 m s-1 a saltation layer of bouncing ice crystals in the lower few centimetres over the surface causes the increase in z0. Larger turbulent mixing can produce airborne particles. The accuracy of our approach increases with wind speed; correlations over 0.999 are only found at friction-velocity values over 0.36 m s-1, perhaps signifying a more neutrally stratified surface layer and more constant wind conditions. Low wind speed situations were eliminated by our correlation-coefficient criterion as during such conditions the static stability is often non-neutral. In conclusion, we state that a constant value of z0 should not be used in studies dealing with the atmospheric surface layer over the Antarctic Plateau, as friction-velocity values often exceed 0.2 m s-1.
Half-hourly mean values of roughness length for momentum versus friction velocity at Kohnen Station between 10 and 20 January 2002. Circles denote values for which fits to profile-mast observations achieved a correlation over 0.99. Dots are drawn for correlations over 0.999.

Figure 7b shows the mean T profiles during ENABLE and the SWE. Whereas the ENABLE-mean profile is stably stratified, the strong-wind profile is of near-neutral stratification due to the strong mixing of the ABL. (This justifies the assumption of neutral stratification during strong winds). Although a daily cycle is present in the 2 m T for strong-wind conditions, its amplitude is smaller than the ENABLE-mean amplitude in T, which is about 4°C (Fig. 8b). Again the observations during strong winds are outside of the T range of the mean ENABLE values, also seen in Fig. 6. The standard deviation of ENABLE-mean T values is largest at night, identical to the contrast between summer and winter T. The difference between strong-wind and mean observations is larger in Figs 7b & 8b than for January in Fig. 6, since the ENABLE-mean temperatures are representative for the end of January 2002, not the beginning of January, when the event occurred.
In Fig. 7c profiles of RH with respect to ice are plotted. The ABL over the Antarctic interior is always near saturation with respect to ice; nighttime saturation occurred frequently during ENABLE (Van As et al. 2005b). Similar results are found at the coastal base Halley (King & Anderson Reference King and Anderson1999), and over polar sea ice (Andreas et al. Reference Andreas, Guest, Persson, Fairall, Horst, Moritz and Semmer2002). The absolute magnitudes of the ENABLE means and strong-wind RH values are high and similar. RH is slightly higher for strong winds due to more effective vertical turbulent transport of moisture. Also, the sublimation of suspended snow particles increases RH, which is therefore highest close to the surface.
Another important factor in heating the near-surface atmosphere during strong winds is the effect of a cloud cover that may accompany SWEs. Whereas at most locations on the planet clouds have a net cooling effect due to the reduction of down-welling solar radiation, clouds yield a smaller absolute impact on the shortwave radiation budget of highly reflective surfaces. The relatively small reduction of solar radiation is outweighed by the increase in down-welling longwave radiation. This counter-intuitive effect of the presence of clouds on the energy balance of highly reflective surfaces is the radiation paradox (Ambach Reference Ambach1974, Yamanouchi et al. Reference Yamanouchi, Wada, Mae, Kawaguchi and Kusunoki1982, Bintanja & Van den Broeke Reference Bintanja and Van den Broeke1996).
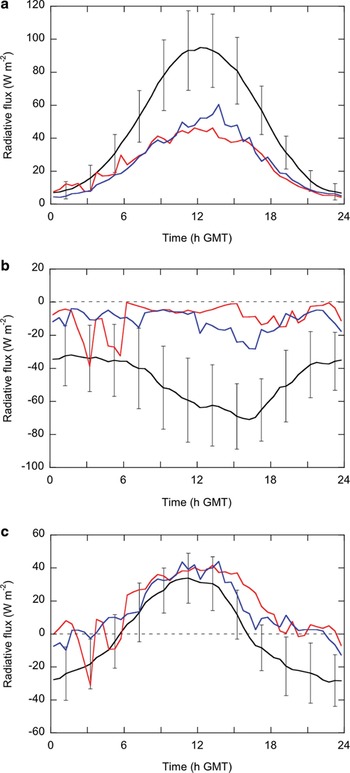
At Kohnen Station clear skies are common as an estimated 70% of the time cloud cover is below 40% (Van den Broeke et al. Reference Van den Broeke, Reijmer, Van As and Boot2006). Figure 11 presents the daily cycles in the radiation budget for the entire ENABLE period, with a mean observed cloud cover of about 40%, and compares it to observations of 10 and 11 January 2002, when the cover of mainly (precipitation-bearing) nimbostratus clouds was around 90%. The potential SR budget was largest at the beginning of the ENABLE period, being closer to the summer solstice. However, the cloud cover during day 10 and 11 reduced SR significantly, causing net shortwave radiation to be about 50% of the noontime ENABLE-mean values, and even 40% for clear-sky values in the first half of January (Fig. 11a). Note that nighttime values are non-zero, since no sunset occurred during ENABLE.
a. Shortwave, b. longwave, and c. net radiation at 1.1 m height at Kohnen for 10 January (red lines), 11 January (blue lines), and their means and standard deviations for the entire ENABLE period (black lines).

Two effects caused the 60% decrease in SR absorbed at the surface. First, the shading effect of clouds, reflecting and absorbing solar radiation before it reaches the surface, reduced incoming SR during noontime of 10 and 11 January by 32%, even though multiple scattering between the surface and clouds increases down-welling SR. Second, clouds indirectly cause changes in albedo of a snow surface, which we will shed light on below.
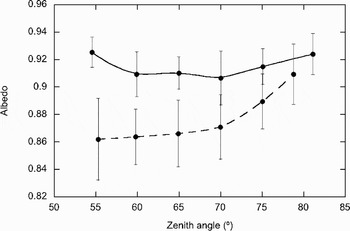
Figure 12 shows the albedo versus the solar zenith angle for both the entire ENABLE period (dashed line) and for 10 and 11 January (solid line). SR data have not been corrected for the poor cosine response of the sensor at large zenith angels for this figure, which method was mentioned in the Methods and applied to Fig. 11a. Instead, we did not take data for zenith angles larger than 80° into account, except for 10 and 11 January, when incoming SR was diffuse and therefore recorded more accurately. Also, we did not use measurements recorded between midnight and 10 h GMT to eliminate the periods in which icing on the sensor domes may have occurred. The figure shows that the ENABLE-mean albedo increases for increasing zenith angles (Wiscombe & Warren Reference Wiscombe and Warren1980), particularly for angles over 70° (dashed line). For small zenith angles (min. 51.6° at Kohnen in mid-summer) mean albedo is 0.86, and at 80° albedo is about 0.92. In the range presented in Fig. 12 the mean albedo values are higher when clouds are present (solid line). Mean albedo with clouds has a fairly constant value around 0.92. Variability in the albedo value during overcast conditions is explained by cloud cover variations in the short (two day) observational period. The difference in albedo between clear and overcast conditions becomes smaller for increasing zenith angles. This is in agreement with for instance Rusin (Reference Rusin1961), who observed that for a zenith angle of 80° clouds increased the spectrally integrated albedo from 0.83 to 0.90, while for 45° the albedo increased from 0.74 to 0.93. For Kohnen Station the differences between clear and cloudy conditions are smaller due to the higher mean albedo values.
Surface albedo in relation to the solar zenith angle at Kohnen. Dots connected by the dashed line are binned mean values of the entire ENABLE campaign. Dots connected by the solid line are binned values for 10 and 11 January 2002. Error bars indicate the standard deviations.

Figure 12 shows that clouds increase the broadband albedo. The increase is due to the visual enrichment of shortwave radiation passing through clouds; water droplets absorb the longer (infrared) wavelengths more effectively than the shorter (visual and ultraviolet) wavelengths. As the spectral albedo of snow increases with decreasing wavelength of solar radiation, the spectrally integrated albedo increases for a mean shift towards the short (visible) wavelengths (Wiscombe & Warren Reference Wiscombe and Warren1980). A cloud cover of larger optical thickness will further remove the longer wavelengths from the SR spectrum, and thus further increase the albedo of a snow surface (Bintanja & Van den Broeke Reference Bintanja and Van den Broeke1996).
The albedo during cloudy conditions is insensitive to the solar zenith angle as clouds scatter sunlight in all directions. The diffuse radiation travelling towards the surface has an effective zenith angle near 50°, thus effectively reducing the surface albedo for large zenith angles. Given the recorded increase for cloudy conditions, it is clear that the visual enrichment of the SR has a much larger impact on the broadband albedo of a snow surface. The slight albedo increase at large zenith angles in Fig. 12 can possibly be attributed to the solar radiation not being fully diffuse, therefore showing similarity to the clear-sky situation. Higher overcast albedo values at the smallest zenith angles are caused by an increase in cloud-cover thickness around noon.
In conclusion, the high albedo during 10 and 11 January 2002 reduced noontime net SR by an additional 40%, and was thus a more important factor in the cloud-related reduction of net SR than the 32% shading effect.
Another factor that influences the albedo of a non-melting snow surface is the metamorphosis of the ice crystals, reducing the albedo. We did not observe an albedo reduction that we can attribute to this process due to the low metamorphosis rate of snow crystals at low temperatures. In fact, the broadband albedo even increased during the ENABLE period, perhaps due clear-sky precipitation, explaining part of the standard deviations of the ENABLE means shown in Fig. 12.
Due to the temperature dependence of outgoing LR on surface temperature, radiative cooling by net LR is usually strongest when surface T peaks in the afternoon. But since no strong daily cycle in surface temperature was recorded during day 10 and 11 (not shown), net LR was fairly constant during these days (Fig. 11b). The relatively high amounts of incoming LR, emitted by clouds and the relatively warm and humid atmosphere, caused net LR to be close to zero, which is significantly higher than its mean value during ENABLE.
Combining the effects of clouds on SR and LR, we find that net radiation increased during the SWE of day 10 and 11 in agreement with the radiation paradox. Daytime values of net radiation were about 10 W m-2 higher than the ENABLE means, but at night the increase was three times larger. This once more demonstrates the larger impact of a SWE for situations with a larger surface-based temperature inversion. Even though clouds affect both net SR and LR more during the day than during the night, these effects partly cancel, and the largest impact is noticed at night. Finally, note in Fig. 11 that in contrast to the ENABLE-mean observations, net radiation at night was not significantly negative, which prohibited the formation of a temperature deficit layer.
Some care has to be taken due to the effects of snowdrift. We cannot neglect the possible impact of snowdrift on the surface radiation measurement during day 10 and 11. If suspended snow particles are present over the radiation sensor, this might lead to an exaggeration of the impact of a cloud cover on the radiative components.
Summary and conclusions
We described the occurrence of SWEs over an Antarctic Plateau site via micro-meteorological observations at Kohnen Station (75°00′S, 0°04′E, 2892 m a.s.l.) to investigate the impact of such events on the near-surface climatology.
During the EPICA-Netherlands Atmospheric Boundary Layer Experiment (ENABLE) we identified two warm-core cyclones in the north-eastern Weddell Sea region, which are most intense in the lower troposphere. Due to the difference in elevation and distance to the centre of the cyclone much stronger winds were recorded at the coastal Neumayer Station than at Kohnen on the high plateau in the Atlantic sector of Antarctica. Also during ENABLE a blocking anticyclone over the south Atlantic Ocean redirected the large-scale flow over the Antarctic Plateau, causing strong near-surface winds and a heavy cloud cover at Kohnen Station. Aided by a simultaneous blocking event in the south Tasman Sea on the opposite side of the continent, a rare split-up of the circumpolar vortex occurred and strong upper-tropospheric wind speeds were found over large parts of the plateau. The circumpolar vortex split-up resulted in free-atmospheric temperatures over 10°C higher than usual in western Dronning Maud Land and the region between Victoria Land and Vostok. Most of East Antarctica experienced overcast conditions, and significant snowfall occurred near Neumayer and Dumont d'Urville, as well as at Kohnen Station and Dome C on the plateau.
At Kohnen Station, strong-wind events occur 10–20 times a year as determined from AWS observations. In the atmospheric boundary layer, temperature is relatively high during these events due to the horizontal advection of heat, but also due to the destruction of the temperature-deficit layer by turbulent mixing, and the increase in net surface radiation if clouds are present. In winter the mean near-surface temperature deficit is larger than in summer, and its destruction by strong winds yields a larger near-surface temperature rise. Also, the larger meridional temperature gradient over Antarctica in winter implies a larger heating by horizontal advection during the often northerly strong winds. ENABLE observations of the daily cycle in temperature indicate that the impact of strong winds is largest at night, when the temperature deficit is largest, analogous to the yearly cycle.
In accordance with observations by Mann et al. (Reference Mann, Anderson and Mobbs2000), we found that snowdrift occurs for friction velocity values larger than 0.25 m s-1. However, the surface roughness length for momentum increases significantly and approximately linearly for friction velocities over 0.18 m s-1 when a transport of snow particles over the surface initiates. The assumption of a constant roughness length with friction velocity is not justified for strong winds.
Relative humidity during strong wind is close to saturation and higher than for mean conditions due to more effective vertical moisture transport, and the sublimation of drifting snow particles. The difference between strong-wind conditions and mean conditions is small, as the surface layer over the Antarctic Plateau is always saturated or near saturation (Van As et al. Reference Van As, Van den Broeke and Van de Wal2005b), as it is for instance at Halley (King & Anderson Reference King and Anderson1999).
The nimbostratus cloud cover during the strong-wind event of ENABLE reduced down-welling solar radiation by 32%. An additional impact of 40% on the shortwave radiation budget at noon was caused by the increase of the broadband albedo to 0.92 due to a shift of the spectrally integrated radiation towards the shorter wavelengths, since clouds absorb the longer wavelengths of solar radiation more effectively. Whereas for overcast conditions the surface albedo has a fairly constant value, for the clear-sky albedo increases from 0.86 to 0.92 when the solar zenith angle increases from 55° to 80°. The cloud-induced changes in both short- and longwave radiation budgets are largest during the day, but these largely cancel each other. The influence of clouds on the net radiation budget is largest at night, when values are close to zero instead of significantly negative.
In conclusion, strong-wind events occur infrequently in the Antarctic interior, but they can affect large regions. Due to the large amounts of heat and moisture advected from northerly direction, these events play a significant role in the heat budget of the troposphere over Antarctica, and the surface mass balance through precipitation and snowdrift. Strong wind events yield changes in the roughness and albedo of the surface, and completely alter the character of the near-surface air layer.
Acknowledgements
We are very grateful to our colleagues at Neumayer Station for performing and sharing the measurements used in this paper, as we are to the Alfred Wegener Institute for the logistic support of ENABLE and providing the snowdrift equipment. This work is a contribution to the ‘European Project for Ice Coring in Antarctica’ (EPICA), a joint ESF (European Science Foundation)/EC scientific programme, funded by the European Commission and by national contributions from Belgium, Denmark, France, Germany, Italy, the Netherlands, Norway, Sweden, Switzerland and the United Kingdom. This is EPICA publication number 179.