


It is widely acknowledged that the character of revolution has changed dramatically over the last several decades. Rather than violent, protracted projects of social change aimed at transforming semi-agrarian societies (Skocpol Reference Skocpol1979; Huntington Reference Huntington1968), most contemporary revolutions are compact urban uprisings that articulate demands for civil and political freedoms. If one understands revolution as a mass uprising against an established government involving contested claims to sovereignty, with the aims of displacing the incumbent regime and substantially altering the political or social order (Goldstone Reference Goldstone2001, 142; Tilly Reference Tilly1993, 8–9; Trotsky Reference Trotsky1932, 206), then since 1980 there have been approximately 42 revolutions worldwide involving at least 10,000 civilian participants that successfully displaced incumbent rulers; two-thirds (28) of these were urban civic revolts that primarily articulated demands for political and civil freedoms and/or free-and-fair elections.Footnote 1 Most did in fact result in some degree of fairer electoral competition and broader civil and political freedoms in their immediate wake, though in many cases these achievements subsequently eroded. These “democratic” revolutions materialized in several transnational waves: the “people power” revolutions of East Asia; the revolutions associated with the collapse of European communism; the electoral revolutions of the early 2000s; and the Arab Spring revolts of the 2010s. Unlike peasant revolutions or rebellions waged in small population settings, these revolutions and others modeled on them relied primarily on the disruption generated by massing hundreds of thousands of civilians in central urban spaces in a concentrated period of time so as to generate pressure on an incumbent regime and induce key members of the ruling coalition to defect (Thompson Reference Thompson2004).
This study examines the implications of the underlying strategic choice within urban civic revolutions to generate large numbers in a concentrated period of time for the questions of who participates in revolution and how participants relate to one another, to revolutionary organization, and to the dominant master narratives that accompany these revolutions. What binds revolutionaries together in collective action within urban civic revolutions? How might this differ from other forms of revolution that extend over a protracted period of time or occur within small population settings? And how might these differences affect the character of postrevolutionary governance? What are the motivations for participation in urban civic revolutions, and how are revolutionaries distinguished from others who choose to navigate these upheavals differently? As Petersen (Reference Petersen2001) noted, the choices within revolutions are more complex than simply the decision to rebel or not to rebel. Yet, rarely do we have systematic information about who participates in revolutions and how individuals differentially behave within revolutionary situations. In the absence of such information, when large numbers of citizens are massed on the streets, they tend to be construed as “the people” or treated as members of larger social aggregates (e.g., the middle class, youth, or workers). Without information about the beliefs of participants, there is a tendency to interpret their motivations through the lens of the master narratives that oppositions articulate to mobilize them. Yet, we know little about whether these master narratives actually mirror participants’ values and beliefs, how participants compare with other members of society who navigated these revolutionary episodes differently, and which social categories operate as real poles of belief or identification.
In this respect, the wave of electoral revolutions that swept across the postcommunist region in the early to mid-2000s presented an unusual research opportunity. These revolutions occurred in the wake of falsified elections, so that societal members faced a formal opportunity to express their preferences vis-à-vis the incumbent regime (even if these preferences were not always accurately recorded in official counts). Moreover, public opinion polling was a central element of the revolutionary model that spread across these societies, with the use of alternative vote counts as a way of measuring the “true” distribution of electoral preferences (Beissinger Reference Beissinger2007; Bunce and Wolchik Reference Bunce and Wolchik2011; McFaul Reference McFaul, Bunce, McFaul and Stoner-Weiss2010). In this study I analyze two highly unusual and detailed surveys taken during and immediately after the 2004 Orange Revolution in Ukraine to examine what, if anything, revolution participants shared in common, and how their values, beliefs, backgrounds, and lifestyles were similar to or different from those who supported the revolution but did not protest, protested in defense of the incumbent regime, opposed the revolution but did not protest in defense of the incumbent regime, and remained apathetic in the midst of revolutionary upheaval. On the basis of this analysis, I argue that participants in the Orange Revolution were distinguished from these other groupings primarily by shared cultural practices and symbolic capital rather than by their commitment to democratic values and mobilized primarily against the incumbent regime rather than for a common set of values or policies. This leads to what I call the semblance of democratic revolution that is characteristic of many urban civic revolutions: whereas elite-articulated master narratives and demands in urban civic revolutions revolve around attaining civil and political freedoms and/or free-and-fair elections, and the media are often quick to code these large mobilizations against autocracy as struggles for democracy, the majority of those who participate are propelled not by a commitment to democracy, but by motivations unrelated to democratic change.
This illusive quality of many seemingly “democratic” revolutions, I argue, is largely the product of the strategy of mobilizing, in a highly concentrated period of time, very large numbers as a way of challenging authoritarian regimes in an urban setting. In general, the larger the number of individuals mobilized into revolutionary action, the more variegated the individuals participating necessarily will be (Marwell and Oliver Reference Marwell and Oliver1993), and the more incentive there is for revolutionary leadership to act as a convener of anti-incumbent sentiment than a provider of organizational or ideological coherence. This problem is compounded when revolutionary mobilization occurs on a temporal scale of days and weeks. In revolts that depend heavily on the rapidly assembled power of numbers, the motivations to engage in revolutionary action for most participants are likely to relate only weakly to the overt and proximate goals of revolutionary master narratives (Klandersman Reference Klandermans, Walgrave and Ruchts2010). In such circumstances, cultural difference and shared symbolic capital are one way to facilitate rapid mobilization across disparate societal groupings. As I show, in the case of the Orange Revolution, democratic master narratives functioned as a holder for a wide variety of grievances and purposes, assembled together through common identities and symbols rather than common values or selective incentives.
In a significant number of cases, urban civic revolutions like the Orange Revolution have led to unstable democratic results, providing a temporary increase in civil and political freedoms, followed by authoritarian backtracking. As I suggest through the Orange Revolution example, some of the reasons for this are likely built into the processes underlying urban civic revolution: its reliance on a rapidly convened negative coalition of hundreds of thousands, distinguished in particular by fractured elites, lack of consensus over fundamental policy issues, and weak commitment to democratic ends.
CONSTITUTING THE COLLECTIVE IN URBAN CIVIC REVOLUTIONS
What binds individuals together in revolutionary collective action within urban civic revolutions, what distinguishes them from those who do not participate or who participate against revolution, and how might this differ from how revolutionary collectives are composed in other types of revolutions? One answer to these questions, rooted in Parsonian sociology, focuses on the role of shared values. Johnson (Reference Johnson1982) argued that social revolutions were the product of the dis-synchronization of societal value systems, with revolutionary movements functioning as articulators of new forms of legitimation that reintegrate societal members around an alternative set of values (for a critique, see Skocpol Reference Skocpol1979, 12–13). Within the democratization literature there is a longstanding tradition, rooted in modernization theory, that views liberalizing political change—whether through revolution or reform—as the result of underlying shifts in societal values and orientations brought about by education, the rise of a new middle class, generational shifts in values, or alterations in social capital (Inglehart and Welzel Reference Inglehart and Welzel2005; Lipset Reference Lipset1959; Putnam Reference Putnam1993).Footnote 2 Indeed, many of the early interpretations of the Orange Revolution emphasized the ways in which Orange revolutionaries represented an assertion of democratic values against the predations of a corrupt and repressive hybrid regime. Writing on the pages of Foreign Affairs, Karatnycky (Reference Karatnycky2005) exemplified the euphoria of Western democracy promoters over the dramatic events in Kyiv at the end of 2004: “The entire world watched, riveted by this outpouring of the people's will in a country whose international image had been warped by its corrupt rulers.” In Karatnycky's explanation, the surprisingly large numbers participating in the revolution were the result of a fundamental transformation of values within Ukrainian society over the previous decade. “Authentic democratic values were being reinforced by a new generation that had grown up initially under glasnost, and later with a broad awareness of democratic practices around the world” (for similar narratives with respect to the Arab Spring, see Alexander Reference Alexander2011). Some linked this transformation in values to the emergence of a new generation of Ukrainians educated in Western ideas, exposed to American and European media, and well-traveled abroad. Others ascribed it to the development of a genuine civil society and the increased social capital and self-organization that accompanied it (Diuk Reference Diuk, Åslund and McFaul2006; Stepanenko Reference Stepanenko2006). According to these accounts, one should expect one or more of the following hypotheses to be true:
H1: Participants in the Orange Revolution were supportive of democratic values and (H1A) displayed greater commitment to democratic values than others in society.
H2: Participants in the Orange Revolution came disproportionately from the younger generation, which (H2A) displayed a greater commitment to democratic values than its elders.
H3: Participants in the Orange Revolution were recruited primarily from those who participated in civil society associations, who (H3A) share a stronger commitment to democracy than those who did not participate in civil society associations.
A second common answer to what binds participants in revolutions together is shared grievances. There is a long tradition in the study of revolution that roots revolution in a single overarching grievance such as a high level of inequality (Boix Reference Boix2008), a sense of economic deprivation (Gurr Reference Gurr1970), or subsistence crises (Scott Reference Scott1976). Tucker (Reference Tucker2007), for instance, argues that in the Orange Revolution participants shared common grievances over the issue of regime corruption and utilized the focal point represented by electoral fraud to overcome collective action problems and root out rampant government corruption from their daily lives. Others have contended that the act of electoral fraud in and of itself was a dominant grievance motivating massive protests (Thompson and Kuntz Reference Thompson and Kuntz2004). Yet whether electoral fraud in the Orange Revolution was a dominating, suddenly imposed grievance or merely “the straw that broke the camel's back” and a potent mobilizational opportunity is unclear.
There is, however, a contrasting literature within the study of revolution that would lead one to expect that urban civic revolutions aggregate diverse sets of grievances. A number of studies of social revolution suggested that multiclass alliances were critical to revolutionary success. Dix (Reference Dix1984) ascribed the differential success of revolutionary movements in Latin America to their ability to construct a “negative coalition” uniting different classes around common rejection of the ruling regime. The concept of a “negative coalition” (a coalition displaying highly diverse preferences on most major politically salient issues but united primarily by their common rejection of a particular outcome) has gained significant currency within the literature on revolutions (Goldstone Reference Goldstone1994; Goldstone Reference Goldstone2011; Goodwin Reference Goodwin2001).Footnote 3 Indeed, Goldstone argues that one of the main differences between social movements and revolutions is that social movements are chiefly focused on one particular set of issues, while in revolutions “the actions of groups seeking quite different goals combine to create broadly linked protests, such that the regime cannot deal with all these protests and is overwhelmed” (1994, 148). While certainly almost all revolutions could be characterized as negative coalitions to some degree, one might expect revolutionary processes that concentrate hundreds of thousands into urban spaces in a matter of days to accentuate a lack of consensus over ends, given that revolutionary organization in such situations cannot play much of any role in providing ideological coherence or in filtering participants, and maximizing participation usually involves attaining cooperation across widely divergent oppositional groups. By contrast, in revolutions taking place in small population settings and over a protracted period of time (such as in peasant revolutions), revolutionary organization is more capable of controlling the composition of participants, either through weeding out dissenters and undesirables or through indoctrination, thereby providing a greater degree of organizational and ideological coherence. Still, what allows a negative coalition to come into existence in some circumstances but not others is not clear. For Dix (Reference Dix1984) moderate elements are pushed into a loose coalition with militants simply due to the variety of alienating policies undertaken by the regime (See also Goodwin Reference Goodwin2001). Yet we know many cases in which outrageous regime behavior does not succeed in creating such coalitions.
Thus from the literature one is left with contrasting expectations about who might have participated in the Orange Revolution:
H4: Participants in the Orange Revolution were mobilized primarily by a dominant motivating grievance such as corruption, inequality, electoral fraud, or economic deprivation.
H5: Participants in the Orange Revolution constituted a negative coalition, mobilizing largely against the incumbent regime due to regime behaviors that alienated them and, for varied reasons, impelled them into common opposition.
For proponents of the collective action paradigm, neither common values nor common grievances are sufficient for motivating revolutionary action, since most individuals prefer that others bear the costs of activism, leading to free-rider problems. Rather, what binds revolutionaries together or pulls them apart are selective incentives wielded for or against participation by revolutionary movements and incumbent regimes (Tullock Reference Tullock1971; Hardin Reference Hardin1995; Lichbach Reference Lichbach1995). Here again, the contrast between urban civic revolutions and other forms of revolution is instructive. In small population settings (such as in peasant revolutions) revolutionary movements are usually organized as vanguard parties, militias, or conventional armies that monitor individuals within local populations, providing selective threats and rewards so as to stimulate recruitment and minimize resistance (Popkin Reference Popkin1979; Weinstein Reference Weinstein2007). In large urban settings, however, where the goal is to mobilize very large numbers in a concentrated window of time, revolutionary movements face difficult challenges deploying selective incentives; they normally cannot monitor individuals within large anonymous population centers, clearly differentiate or control who participates and who does not, or provide more than the weakest of selective incentives (rock concerts and soup kitchens—both used during Orange Revolution by the opposition—are simply not powerful enough selective incentives to motivate large numbers to engage in high-risk activism).Footnote 4 By contrast, fear of government reprisal is usually an important factor inhibiting individuals from joining urban revolutionary causes (Olsson-Yaouzis Reference Olsson-Yaouzis2010)—perhaps even more important than for revolutions within small population settings, where the reach of the government may be more limited. Thus in urban civic revolutions one might expect that those most likely to participate would be those best able to avoid government retaliation (either because the government has difficulty identifying them, or because it cannot deploy effective negative incentives against them) rather than those who receive selective incentives from revolutionary movements. Whereas peasant and rural-based revolts rely on terrain to prevent government identification and retaliation (Fearon and Laitin Reference Fearon and Laitin2003), urban civic revolutions rely on large numbers to render problematic the identification of individuals by government for purposes of retaliation. Moreover, participants who have their own independent resources are less likely to be affected by negative selective incentives deployed by government. In this respect, in addition to predicting that successful urban revolutions require large numbers, the collective action paradigm would lead us to believe the following:
H6: Participants in the Orange Revolution were those with greater income and resources and those who derived their income and resources independently of the government—i.e., the better off and those not employed in the public sector.
A final answer often given to what binds individuals together in revolutionary collective action is common ties. Some have argued that high-risk activism requires the presence of strong network ties (friendships, personal acquaintances, and face-to-face relationships) that pull individuals who otherwise might not have the resolve to participate into collective action (McAdam and Paulson Reference McAdam and Paulsen1993). Writing about partisan resistance to Soviet rule, Petersen (Reference Petersen2001) observed that strong tight-knit communities constituted the backbone of recruitment for clandestine rebellion and guerilla warfare, and these types of strong ties typically form the basis for rural-based revolution. However, strong face-face ties might be less relevant a mechanism of recruitment within revolutions that seek to concentrate hundreds of thousands in an urban setting within a compressed period of time. Granovetter (Reference Granovetter1973) has spoken of the utility of weak ties in processes that rely upon the diffusion of information and influence, as one might expect to be the case in revolutionary processes within a large urban environment. Goldstone (Reference Goldstone1994, 154) combined these perspectives, arguing that revolutionary mobilization is promoted by situations of strong ties within groups but weak ties across groups. Still others such as Slater (Reference Slater2009) or Beissinger (Reference Beissinger2002) emphasize the ability to wield symbolic power across diverse groups and individuals as critical for mobilizing the large numbers necessary for revolutionary success. Thus, according to these divergent perspectives, one might alternatively expect the following:
H7: Participants in the Orange Revolution were recruited primarily from individuals connected through strong, face-to-face ties.
H8: Participants in the Orange Revolution were recruited primarily from individuals connected through weak ties.
H9. Participants in the Orange Revolution were recruited primarily from individuals with strong identities and shared symbolic capital.
Below, I evaluate these hypotheses through two unusual surveys taken at the time of the 2004 Orange Revolution in Ukraine. As the results indicate, not only did Orange revolutionaries display weak commitment to the democratic values represented in the master narrative of the revolution, but they were a surprisingly diverse group in terms of their opinions on the major issues of the day in Ukraine, forming a negative coalition united primarily by shared symbols and identities, weak ties, and their extreme rejection of the incumbent regime.
IDENTIFYING ORANGE REVOLUTIONARIES, COUNTER-REVOLUTIONARIES, SUPPORTERS, AND OPPONENTS
As Kuran (Reference Kuran1995) observed, revolutions often occur suddenly, taking observers and participants by surprise. It is therefore unusual to have a cross-sectional record of the backgrounds, attitudes, and lifestyles of those who participated in a revolution, let alone to be able to compare these with some precision to other members of society. But this is in essence what the Monitoring survey, conducted in early March 2005 by the Institute of Sociology of the National Academy of Ukraine, represents.
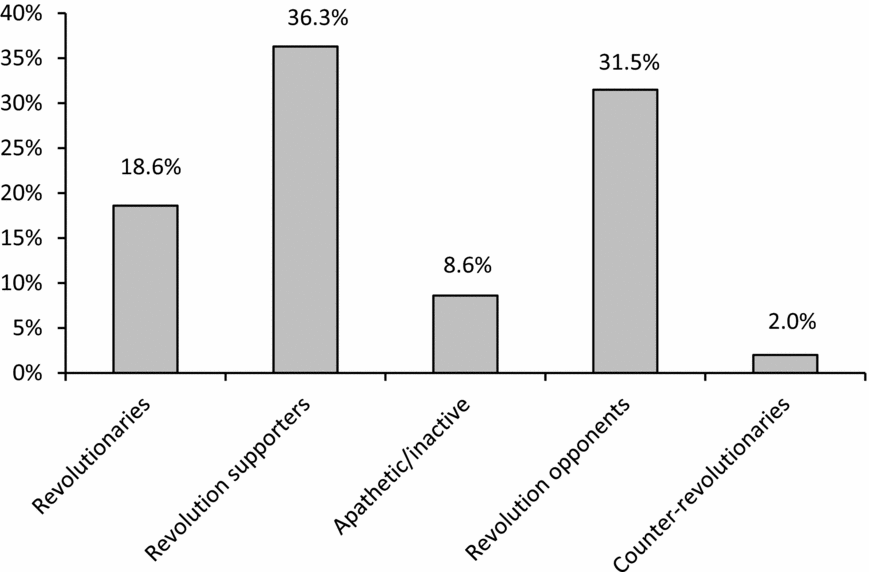
The Orange Revolution from November 21, 2004 through January 10, 2005 is widely considered one of the most spectacular displays of urban revolutionary protest on the European continent since the end of the Cold War. Up to a million citizens turned out on Maidan, the main square of Kyiv, in temperatures as cold as −12 degrees centigrade, to call for the annulment of falsified elections and an end to the incumbent regime of Leonid Kuchma.Footnote 5 The 2005 Monitoring survey was not designed specifically as a study of Orange Revolution participation. Monitoring surveys had been conducted by the Institute of Sociology every year since 1994 as a means for analyzing trends within Ukrainian society (Panina Reference Panina2005). The survey typically consisted of two parts: a battery of questions repeated annually, and one-time questions designed to probe particular issues.Footnote 6 In the case of the March 2005 Monitoring survey, a series of one-time questions were added concerning the 2004 Ukrainian presidential election and the events of the Orange Revolution that accompanied it. Respondents were asked to identify the candidate for whom they voted in each of the three rounds of the 2004 presidential election, whether they had participated in any demonstrations during the Orange Revolution and in what manner, their beliefs about why people participated in the Orange Revolution protests, and their attitudes about what these events represented and whether they had improved conditions in Ukraine. Assuming that those who voted for Yanukovych did not demonstrate for Yushchenko (and vice versa), in essence these questions allow one to identify five distinct groups with respect to the revolution (Figure 1): (1) revolutionaries (those who voted for Yushchenko in the third round of voting on December 26, 2004Footnote 7 and who also participated in protests during the Orange Revolution: 18.6% of respondents); (2) revolution supporters (those who voted for Yushchenko in the third round but did not participate in any demonstrations: 36.3% of respondents); (3) revolution opponents (those who voted for pro-incumbent candidate Viktor Yanukovych or voted against all candidates in the third round but did not participate in protests: 31.5% of respondents); (4) counter-revolutionaries (those who participated in protest demonstrations but voted for Yanukovych, voted against all candidates, or willingly chose not vote: 2.0% of respondents);Footnote 8 and (5) the inactive or apathetic (those who, in the midst of the most hotly contested election in Ukrainian history and revolutionary events that swept up millions, neither voted nor participated in any protests: 8.6% of respondents).Footnote 9 The place of nonparticipant supporters, counter-revolutionaries, revolution opponents, and the apathetic are ignored in most analyses of revolution. In this respect, the 2005 Monitoring survey provides a unique perspective through which to analyze revolutionary activity.
Political Groupings in the Orange Revolution (Monitoring Survey)

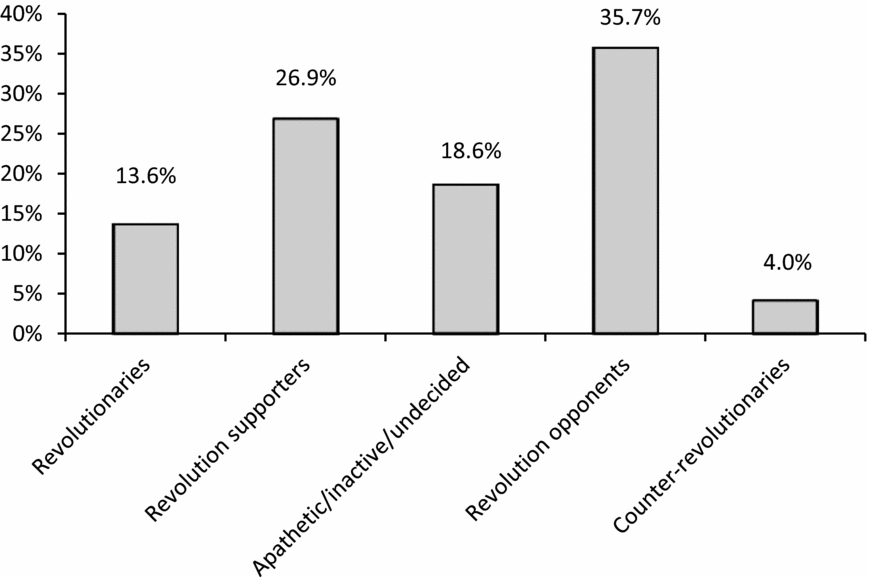
There are obvious issues with using a retrospective survey of revolutionary participation. Attitudes and beliefs may themselves be affected by the experience of revolution, and bandwagoning and preference falsification are inherent parts of the revolutionary process. We are fortunate to have available another survey that provides some leverage on the extent of these kinds of inaccuracies within the Monitoring survey. A nationally representative survey of 2,044 adults (18 or older) was conducted by the Kyiv International Institute of Sociology (KIIS), December 10–14, 2004—in the immediate wake of the demonstrations but prior to the third round of the presidential vote—that also asked respondents not only whether they had participated in demonstrations after the second round of voting, but also for whom they intended to vote in the upcoming third round of the election. The KIIS survey was a bare-bones survey focusing almost entirely around voting and protest behavior. But as it was taken prior to the final outcome of the revolutionary events, it may have been a more accurate expression of who participated in the protests, though a less accurate reflection of voting preferences (12.2% of the sample did not know at the time for whom they would vote or did not indicate an electoral preference). The KIIS survey found a slightly lower rate of protest participation overall (18.2% of Ukrainian society, as opposed to 20.6% in the Monitoring survey). However, only 13.6% of respondents in the survey were revolutionaries (participated in protests and declared their intention to vote for Yushchenko in the third round), 4.0% were counter-revolutionaries (had participated in protests and intended to vote for Yanukovych), and another 0.7% participated in protests but did not yet know for whom they would vote or failed to give an electoral preference. Moreover, in the KIIS survey 26.9% were revolution supporters (intended to vote for Yushchenko but did not participate in protests), 35.7% were revolution opponents (did not participate in protests but intended to vote for Yanukovych), and 18.6% had not participated in protests and were undecided about how they would vote or failed to give an electoral preference (Figure 2).
Political Groupings in the Orange Revolution (KIIS Survey)

It is hard to know which represents the “true” distribution of preferences and behaviors during the Orange Revolution: the Monitoring survey, the KIIS survey, or the official election results. All three contain some significant inaccuracies. According to the official election results, 77% of eligible voters participated in the third round of presidential voting in Ukraine on December 26; by contrast, 88% of Monitoring survey respondents claimed to have voted, and 95% of the KIIS sample said that they intended to vote. In the Monitoring survey 62% of those who claimed to have voted indicated that they voted for Yushchenko, even though the official results indicated that Yushchenko received only 52% of the votes. In the KIIS survey only 43% of those who indicated that they would participate in the third round of voting also indicated that they would vote for Yushchenko (significantly below the official results). In the Monitoring survey, 6% of those claiming to have voted said that they voted against all candidates, even though the official results showed that this was only 2% of the electorate (in the KIIS survey this was 3.2% of those intending to vote). The number claiming to have voted for the incumbent regime candidate Yanukovych is significantly lower in the Monitoring survey (31%) than the 44% that he received at the polls (39% in the KIIS survey among those who intended to vote). It is possible that the degree of support for Yanukovych in the official elections results was inflated, given widespread reports of election irregularities in eastern and southern Ukraine (OSCE 2005, 36–37; Myagkov, Ordeshook, and Shakin Reference Myagkov, Ordeshook and Shakin2005, 91–131). It is also possible that response rates to the Monitoring and KIIS surveys differed among Yushchenko and Yanukovych supporters, given that the surveys asked questions that Yanukovych supporters might not want to answer. Still, taking all these cues into account, it seems clear that some degree of “preference falsification” was present in the Monitoring survey—though probably no greater than 10–12% of the sample. Some respondents in the Monitoring survey claimed to have voted for Yushchenko when they did not go to the polls or voted instead for Yanukovych. Some claimed to have voted against all candidates when in fact they voted for Yanukovych. Some claimed to have participated in the protests on the Orange side when they had not participated in any protests at all. And the number of counter-revolutionaries was likely twice as large as the Monitoring survey indicated (though still quite small).
Nevertheless, these surveys provide us with roughly accurate estimates of participation in the Orange revolution—estimates that accord with many of the stylized facts that have circulated about the revolution. Projecting the results of both surveys on Ukraine's adult population of 36 million, they indicate that somewhere between 4.9 and 6.7 million people participated in the revolution on the Orange side across various parts of Ukraine, while between 700 thousand and 1.4 million participated in protests on the Blue side (in support of the incumbent regime). Both surveys show that more Ukrainians supported the revolution than opposed it, but they also both indicate that Ukrainian society was more closely divided over regime change than the homogenizing images of the enormous crowds on Maidan might have suggested. The official electoral results of the third round of voting indicated that Orange supporters outnumbered revolution opponents on the order of about 6 to 5; the Monitoring survey records a margin of 8 to 5, while the KIIS survey showed a narrow margin of 11 to 10 among likely voters. Nevertheless, protest mobilization by revolution supporters far outnumbered mobilization by revolution opponents (by a factor of almost 9 to 1 in the Monitoring survey, and in the KIIS survey by a factor of almost 4 to 1). I will explore some of the reasons for this below. But these patterns suggest that the outcomes of revolutionary episodes are due as much to the passivity of potential regime supporters as to the effective mobilization of regime opponents.
Despite some of its inaccuracies, the Monitoring survey still presents an unusually rich and detailed portrait of Ukrainian society's participation in and attitudes toward the Orange Revolution. In all, the survey asked a total of 357 questions covering a wide variety of topics. In addition to questions about the respondent's age, gender, and marital and family status, level of education, place of residence, religion, nationality, language use, and economic and material situation, the survey asked respondents about their attitudes toward privatization, Ukraine's geopolitical orientation, citizenship and language policy, and political institutions. It asked about respondents’ political self-identification, participation in civil society associations, trust in other people and in institutions, evaluations of political leaders, interactions with the state over the previous 12 months, attitudes toward various nationalities, their biggest fears and what they desired more in their lives, health and drinking habits, height and weight, the size of their living space and how well it was heated, how they spent their free time and what consumer goods they owned, thoughts of migration within Ukraine or abroad, access to the internet and cell-phone ownership, and numerous other questions. Never before has such an extensive record of the personal habits, behaviors, attitudes, and backgrounds of participants in a revolution been available (though this was not the overt purpose of the survey). Moreover, the survey provides us with the unusual opportunity to compare revolutionaries on all these attributes with counter-revolutionaries, revolution supporters, revolution opponents, and the apathetic or inactive.
To illustrate, from the Monitoring survey we learn that, controlling for the age of respondents, revolutionaries were more than eight times more likely to be from Western Ukraine, twice as likely to attend church and to be internet users, 58% more likely to be male, and 24% more likely to say that they had true friends than the rest of the adult population of Ukraine.Footnote 10 By contrast, controlling for age, counter-revolutionaries were twice as likely be male, three times more likely to speak Russian at home and to have engaged in physical exercise sometime in the previous seven days, four times more likely to be dissatisfied with the condition of their homes, and almost six times more likely to be from a single province of Ukraine (Donetsk) than the Ukrainian population as a whole.Footnote 11 In short, the richness of the survey and the ability to identify different categories of the population with respect to their participation in and attitudes toward revolution makes the Monitoring survey a unique record in the study of revolutionary politics more generally.Footnote 12 Below, I use the Monitoring survey (and a few questions from the KIIS survey, when relevant) to assess who participated in the revolution, what motivated them to participate, and how they differed from those who failed to participate, opposed the revolution, or remained entirely on the sidelines.
THE HETEROGENEITY OF ORANGE REVOLUTION PARTICIPANTS
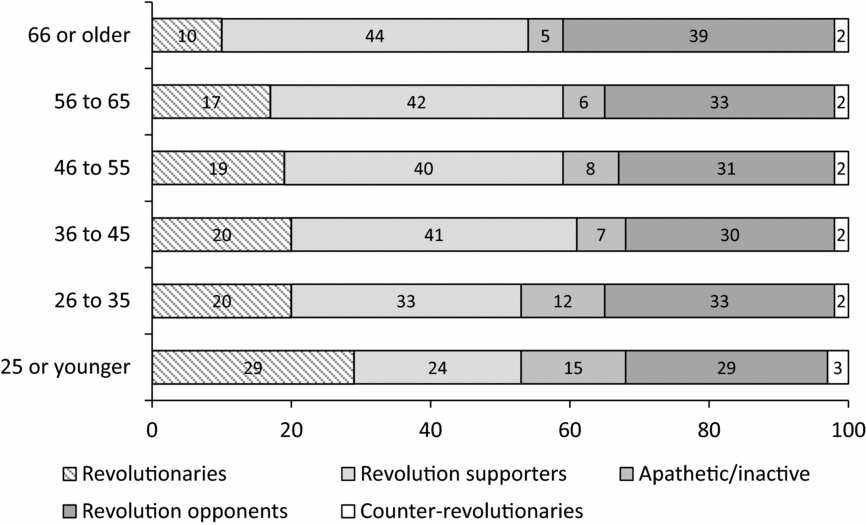
With the benefit of hindsight, it is clear that the fundamental shift in societal values that some initially believed lay beneath the Orange Revolution (H1, H2, and H3) was a chimera. However, this was already evident immediately after the revolution in the results of the Monitoring survey. To be sure, the younger generation of Ukrainians played a conspicuous role in the revolution. According to the Monitoring survey, those 25 years old or younger constituted 23% of participants in the Orange protests (though only 19% of the Ukrainian population as a whole), and there is a statistically significant relationship between age and revolutionary participation (t = 5.77, p < 0.001). But while Ukrainian youth participated disproportionately, it was still the case that the vast majority of Ukrainian youth (71%) did not participate in any protests at the time, and slightly less than half of all young people (46%) either voted against the Orange camp or did not vote at all (Figure 3). Indeed, when one looks at Yushchenko's electoral support by age group, youth actually showed less of a propensity to vote for Yushchenko than other groups (particularly, those between 36 and 65), and significantly more young people remained inactive or apathetic throughout the revolution than was true of other age groups.
Age Categories by Political Groupings in the Orange Revolution

Similarly, politically oriented civil society associations such as Chysta Ukraina (Clean Ukraine), Znayu (I Know), Pora (It's Time), or the Committee of Ukrainian Voters played critical roles in mobilizing voters to the polls and to the Maidan protests. And the activist presence was conspicuous at the Orange protests. According to the Monitoring survey, 21% of Orange revolutionaries belonged to at least one social or political association broadly defined (compared to 16% of the Ukrainian population as a whole), and there was a statistically significant relationship between participation in civil society associations and participation in the revolution (chi2 (1) = 5.74, significant at the 0.05 level). But the overwhelming majority of revolution participants had never participated in any civil society associations, and counter-revolutionaries were actually more heavily involved in civil society associations (34%) than revolutionaries.Footnote 13
More importantly, the Monitoring survey reveals no shared commitment to basic democratic values among a majority of Orange Revolution participants (H1A, H2A, and H3A). The survey asked, for instance, “In your opinion, do you believe that Ukraine needs a multi-party system?” Only 34% of revolutionaries favored a multiparty system for Ukraine, while 38% opposed it, and 28% did not know how to answer the question. Moreover, there was no statistically significant difference between the way that revolutionaries responded to this question and how other groupings responded.Footnote 14 Thus, a mere eight to ten weeks after what was considered by some at the time to be one of the most spectacular manifestations of “democratic” revolution of the early twenty-first century, only a third of those who had participated in the revolution supported one of the core features of democracy in its stripped-down, Schumpeterian form (multiparty competition), and more participants actually opposed a multiparty system than favored it. Although the revolution had been sparked in significant part by abuses of presidential power, Orange revolutionaries and revolution supporters were much less likely to oppose the introduction of direct presidential rule that would limit severely the power of the legislature than were revolution opponents and counter-revolutionaries.Footnote 15 And Orange Revolution participants were just as likely to agree with the statement “Several strong leaders can do more for the country than laws and discussion” as were Orange Revolution opponents and counter-revolutionaries.Footnote 16 Among revolutionaries, no relationship existed between age or civil society association participation and how people answered these questions, while among all respondents only a relationship existed between age and support for a multiparty system. Thus, once the revolution gained power, commitment among revolutionaries to democratic values and norms was conspicuously weak. But even in the midst of the revolution, a majority of those who participated were not primarily motivated by the desire to defend democratic values. The KIIS survey asked respondents to name two main reasons why people protested in the revolution. Only 40% of revolutionaries picked “to defend the values of a just, democratic society”—more than other groupings, but still a minority of revolution participants.
When one examines their attitudes on the major issues of the day in Ukraine, a surprising degree of diversity is apparent among Orange Revolution participants, with opinions often diverging significantly from the positions endorsed by “Our Ukraine.” In addition to its official embrace of democracy and stance against the corruption and electoral fraud of the Kuchma government, “Our Ukraine” stood for an unabashedly pro-Western orientation in Ukrainian foreign policy. Its economic platform has been described as “a liberal market program with a social orientation,” supporting increasing minimum welfare benefits while “emphasizing tax cuts, deregulation, and creation of a level playing field” (Aslund Reference Aslund2005, 337–338). It favored continued emphasis on privatization, including reprivatization of some large enterprises and privatization of land (though without the speculative land sales which were then common). And while “Our Ukraine” projected an image of civic nationalism that was inclusive, it opposed providing the Russian language with official status—a key issue of contention in Ukraine, and one that clearly associated it with Ukrainian speakers.
However, when one looks at the attitudes of Orange revolutionaries on these same issues, one finds little consensus, as the negative coalition hypothesis (H5) might expect. A bare majority (53%) favored a mixed economy, while almost a quarter favored return to a centrally planned economy, and 9% favored a laissez faire economy. While most Orange revolutionaries (63%) said they supported the development of private enterprise in Ukraine, a slight majority (56%) were against privatization of large enterprises, and half (54%) did not believe that the sale or purchase of land should be allowed. In terms of foreign policy, only 46% of Orange revolutionaries believed that Ukraine should develop relations primarily with the West, while 22% favored an orientation toward Russia or the CIS, and 33% believed Ukraine should remain independent and rely on its own resources. Moreover, only 30% of Orange revolutionaries were positive about the idea of Ukraine joining NATO (even though Yushchenko later pushed NATO membership as a priority once he came to power). And while two-thirds of Orange Revolution participants opposed giving official status to the Russian language, about 18% thought this was a good idea, and another 14% were unsure.
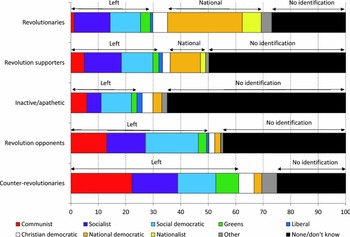
The diversity of Orange revolutionaries is even more evident when one examines their political self-identification. When asked to identify which positions on the political spectrum were closest to theirs (Figure 4), 34% identified themselves as nationalist or national-democratic, 24% as socialist or social-democratic, 5% as Christian-democratic, and 4% as Greens, while 26% indicated that they did not identify with any specific political position. Thus Orange revolutionaries were largely split into three, roughly equal groupings: the moderate left (socialists, social-democrats, and greens), those identifying with nationalist goals (nationalists and national-democrats), and those who did not identify with any political position. As Figure 4 shows, Orange Revolution participants were actually more diverse in the political groupings they contained than Orange supporters, revolution opponents, counter-revolutionaries, or the inactive and apathetic. Despite the fact that 90% of Orange revolutionaries had voted for Yushchenko already in the first round of the presidential election on October 31 (before the onset of the protest campaign), 46% indicated that their electoral support of Yushchenko was conditional upon endorsements by other politicians—in particular, Yulia Timoshenko (36%), Oleksandr Moroz (18%), and Anatoliy Kinakh (13%). Thus the factional groupings that composed the Orange coalition at the elite level reflected themselves downward in the coalitional and conditional nature of mass participation in the revolution's critical events.
Political Self-Identification among Political Groupings in the Orange Revolution

To further identify groupings among revolutionaries, I performed a latent class cluster analysis of revolution participants. Latent class cluster analysis is a finite mixture approach used to identify groupings of individuals who share similar interests, values, characteristics, or behaviors. Individuals are classified into clusters based upon the probabilities of their membership, which (unlike traditional k-means cluster analysis) are estimated directly from the model. Moreover, unlike traditional k-means clustering, latent class cluster variables can be continuous, nominal, or ordinal (Vermunt and Magidson Reference Vermunt, Magidson, Hagenaars and McCutcheon2002).Footnote 17 As a basis for identifying groupings of revolutionaries (n = 247), I used nine questions from the Monitoring survey that captured differences of opinion on the major issues of Ukrainian politics: attitudes toward a multiparty system (i.e., democracy); attitudes toward privatization of large enterprises, privatization of land, the right to buy and sell land, and the general role of the state in the economy; attitudes toward Ukraine's possible NATO membership and its foreign policy orientation; attitudes toward whether Russian should be accorded official status; and how revolutionaries identified themselves on the political spectrum. I used the Bayesian Information Criterion (BIC) and the Akaike Information Criterion with a per-parameter penalty of 3 (AIC3) to adjudicate between models with different numbers of clusters (Andrews and Currim Reference Andrews and Currim2003; Fonseca Reference Fonseca2008). The lowest BIC suggested a three-cluster model, while the lowest AIC3 suggested a four-cluster model. However, a small number of cases were classified into the fourth cluster of the four-cluster model (4% of the sample), and the cluster profile was similar to another cluster in the model. Therefore I used the three-class model.
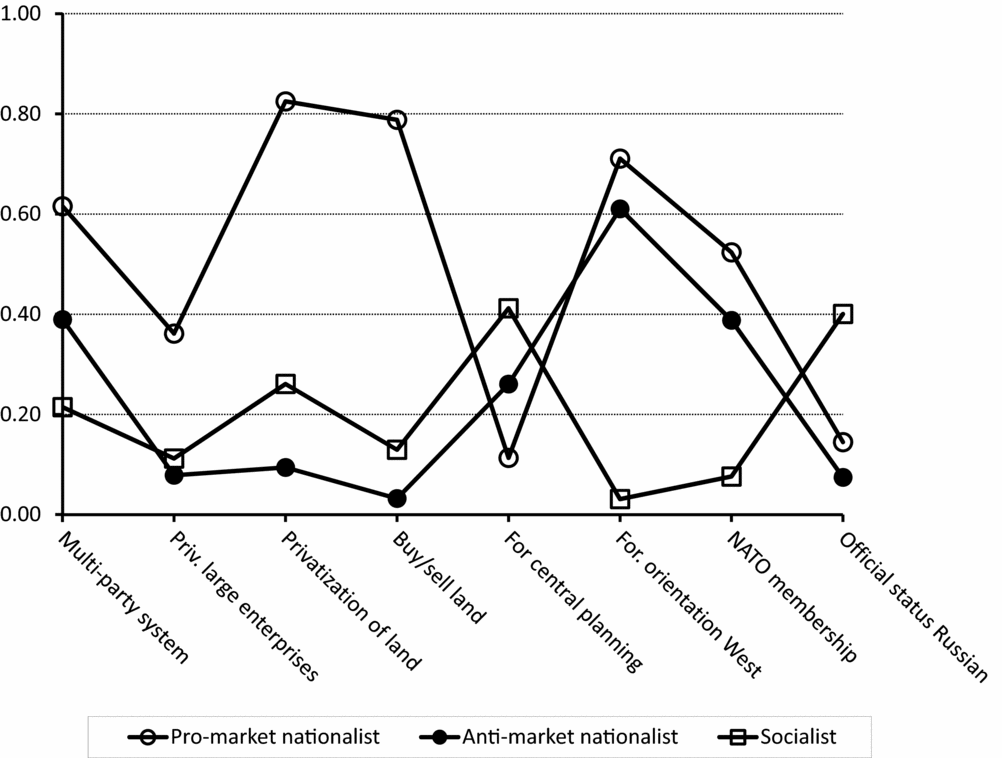
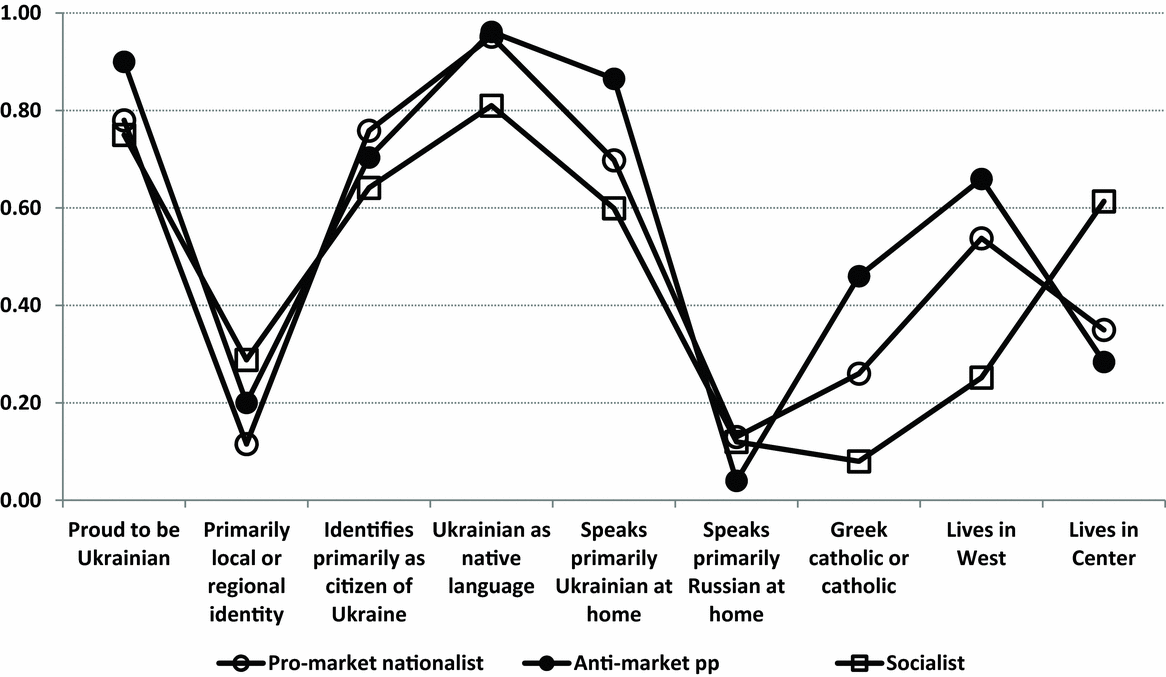
Figure 5 displays the cluster profile plot for the three clusters of Orange revolutionaries, each of which constituted about a third of the participants in the revolution. Based on the pattern of their responses, I have labeled the three clusters as antimarket nationalists, socialists, and promarket nationalists. Promarket nationalists most closely approximated the official positions of “Our Ukraine.” They strongly supported a multiparty system, privatization of large enterprises and land, buying and selling of land, and a Western foreign policy orientation and NATO membership for Ukraine, but strongly opposed official status for the Russian language. While by and large they favored a mixed economy, they constituted the bulk of those who believed state interference in the market should be minimized. When asked to identify themselves on a political spectrum, they predominantly chose “nationalist” or “national-democratic.” Like their promarket counterparts, antimarket nationalists identified themselves predominantly as “nationalist” or “national-democratic.” They favored a Western orientation for Ukraine and were more favorably predisposed to NATO membership for Ukraine than opposed (though predominantly undecided). Of the three groupings they were also the most opposed to according Russian official status. But unlike promarket nationalists, they were strongly against privatization of large enterprises, privatization of land, and buying and selling of land, and were sharply divided over the desirability of a multiparty system in Ukraine. Like antimarket nationalists, socialists were against privatization of large enterprises, privatization of land, and buying and selling of land. While more than half favored a mixed economy, a significant portion (41%) supported a return to central planning. But unlike the other groupings, they favored a pro-Russian foreign policy, opposed participation in NATO, and were significantly divided over the desirability of making Russian an official language. They also did not support a multiparty system. When asked to identify where they stood on the political spectrum, most identified themselves as socialist, social-democratic, or moderate left.
Profile Plot for Three-Cluster Model of Participants in the Orange Revolution

In sum, there is solid evidence for the coalitional character of Orange Revolution participation (H5), with a majority of revolutionaries weakly identifying with the values espoused in the revolution's master narratives, and with striking dissensus over the fundamental issues of Ukrainian politics. But if Orange revolutionaries were so highly divided and weakly committed to the revolution's democratic master narratives, what united them and distinguished them from those who did not participate, opposed the revolution, or remained apathetic?
THE COLLECTIVE IN ORANGE COLLECTIVE ACTION
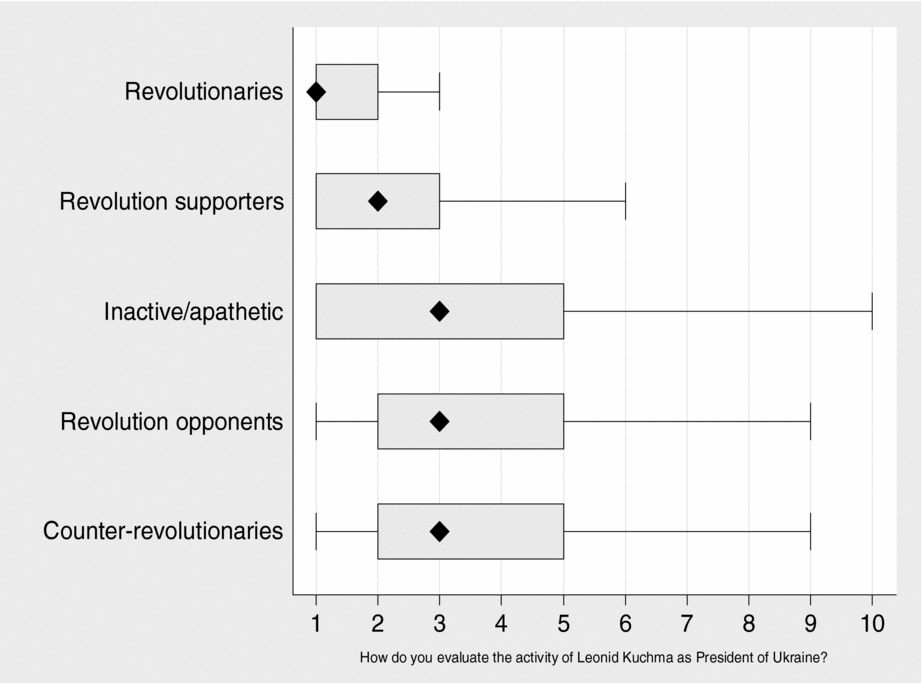
There was in fact one issue over which Orange revolutionaries were in complete agreement and that differentiated them from others: their extreme disdain for the incumbent administration, as the negative coalition hypotheses (H5) would predict. Figure 6 shows that Orange revolutionaries were far more unified in their negative evaluations of the incumbent Leonid Kuchma than revolution supporters, revolution opponents, counter-revolutionaries, and the inactive or apathetic. Evaluations of Kuchma were on average negative among all groups, including revolution opponents and counter-revolutionaries—an explanation for why the incumbent regime failed to mobilize larger numbers to its defense, even though electoral preferences were closely divided in Ukrainian society. Revolution opponents and counter-revolutionaries were not necessarily incumbent regime supporters, but were primarily opposed to those challenging the incumbent regime. Indeed, in the KIIS survey only 43% of counter-revolutionaries indicated that support for Yanukovych was one of the two main reasons for participation in the protests.
Evaluation of Incumbent Regime by Revolutionary Activity
Notes: Diamonds represent median scores on a 10-point scale (with 1 as the lowest evaluation and 10 as the highest evaluation). Shaded boxes represent the 25th and 75th percentiles, and whiskers extend to the largest and smallest values that are not outliers.

But the extreme distribution of evaluations of the incumbent regime among revolutionaries is striking. Sixty percent of Orange revolutionaries gave Kuchma a rating of 1 (the lowest possible rating) on a 10-point scale, while 93% gave him a score of 3 or less (the median score for those who supported the revolution but did not participate). All three clusters of revolutionaries were practically identical in their distributions, with mean scores of 1.7, 1.8, and 1.7, respectively. By contrast, revolution supporters, who also evaluated the incumbent regime negatively, were much more divided in their opinions. Reasons for the extreme dislike of Kuchma among revolution participants varied. Certainly, electoral fraud was a key proximate cause: it was identified in the KIIS survey by two-thirds of revolutionaries as one of the two main reasons for why people participated in the protests. But when asked in the Monitoring survey to name the main reasons for citizen activism during the revolution (respondents could name more than one), revolutionaries most commonly cited “protest against the authorities” (57%), but with significant numbers also choosing “an awakening of national consciousness” (41%), “hope for improved living standards” (39%), “concern for the future of one's children” (33%), “an emotional protest against injustice” (33%), “dislike of one of the candidates” (30%), and “a choice between good and evil” (22%). Thus contrary to the overarching grievance theory (H4), beneath the veneer of opposition to electoral fraud, Orange revolutionaries were actually quite fragmented over the main reasons they were protesting, with some motivated more by issues of identity, others more by economic issues, and still others by their belief in the need to defend democracy. However, they were all united in their extreme rejection of the incumbent regime—and different from other groupings in that regard.
There were other ways in which Orange revolutionaries differed from those who opposed the revolution or who stood on the sidelines. Orange revolutionaries were more highly networked and had higher levels of social capital than other groupings (H7 and H8). Orange revolutionaries were more likely to report that they had true friends (chi2 (8) = 22.05, significant at the 0.01 level), less likely to report feelings of loneliness than other groupings (chi2(16) = 37.17, significant at the 0.01 level), more likely to be internet users (chi2(4) = 57.42, significant at the 0.001 level), more likely to attend church (chi2(4) = 40.06, significant at the 0.001 level), and scored higher on interpersonal trust (chi2(8) = 35.08, significant at the 0.001 level) than revolution supporters, revolution opponents, counter-revolutionaries, or the inactive/apathetic. And as the collective action paradigm (H6) would predict, they were more likely than other groupings to work in the private sector (chi2(4) = 21.98, significant at the 0.001 level), where they were more insulated governmental control, while counter-revolutionaries were more likely to be employed by the state (chi2(4) = 12.68, significant at the 0.05 level), and therefore more likely to be subject to government selective incentives.
Moreover, Orange revolutionaries were considerably better off than other groupings. They had considerably more living space per member of their households (34.0 square meters) than revolution supporters (26.1), revolution opponents (22.4), counter-revolutionaries (19.2), and the inactive or apathetic (23.1). Out of a list of 15 consumer goods, Orange revolutionaries owned significantly more than all other groupings. The Monitoring survey asked individuals to identify their class position using seven-point class scale (with 1 as the lowest position and 7 as the highest position). A small proportion of Orange revolutionaries (12%) identified themselves in the two lowest positions–in contrast to 27% of revolution supporters, 26% of revolution opponents, 22% of counter-revolutionaries, and 25% of the inactive or apathetic. Similarly, only 18% of Orange revolutionaries reported that in the previous 12 months there had been times when they could not afford to buy basic food items (as opposed to 20% of revolution supporters, 31% of revolution opponents, 31% of counter-revolutionaries, and 30% of the inactive and apathetic). Thus the Orange Revolution was disproportionately a middle class revolution—not a revolution of the have-nots, but disproportionately a revolution of the want-mores. Participants were more likely than other groupings in society to have independent resources that might render government selective incentives less potent (H6).Footnote 18
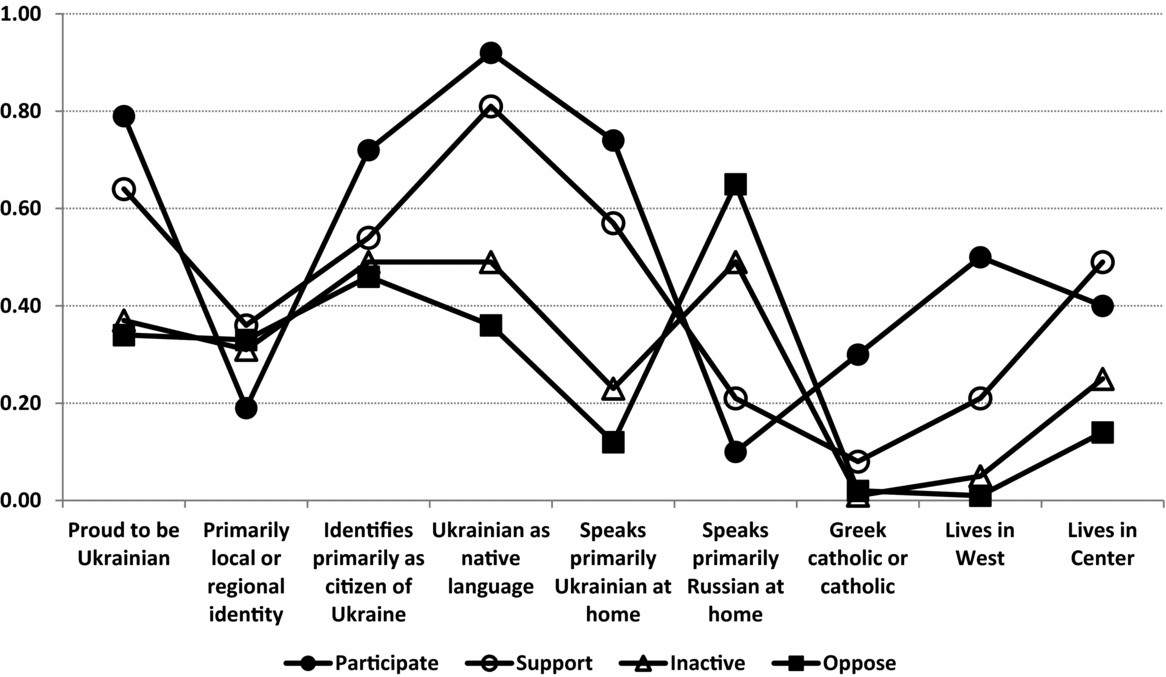
Finally, Orange revolutionaries were connected by ties of identity and language use that sharply distinguished them from revolution opponents, counter-revolutionaries, and the apathetic or inactive (H9). As Figure 7 shows, whereas 92% of Orange revolutionaries (and 81% of revolution supporters) claimed Ukrainian as their native language, only half of the inactive and apathetic and 31% of revolution opponents did. Moreover, 74% of Orange Revolution participants reported that they spoke primarily Ukrainian at home, while 70% of Yanukovych voters as a whole reported that they primarily spoke Russian at home. Quite literally, Orange revolutionaries and opponents of the revolution “spoke different languages” in their everyday lives. In the Ukrainian context language and identity are inextricably linked with place of residence, and region also played a critical role in differentiating those who participated in the revolution from those who opposed it or stood on the sidelines. Fully half of Orange revolutionaries were residents of Western Ukraine, the historical center of Ukrainian nationalism, even though Western Ukraine is home to only 18% of the Ukrainian population. Approximately 30% of Orange revolutionaries identified themselves as Greek Catholics or Catholics (concentrated largely in Western Ukraine), as opposed to about 9% of the Ukrainian population as a whole. In all, 90% of all revolutionaries came from Western and Central Ukraine, even though these regions account for about half of the country's population. Similarly, 90% of those who opposed the revolution hailed from the East and South.
Identity Markers across Orange Revolution Participants, Supporters, Opponents, and the Apathetic/Inactive

These differences translated into very different attitudes toward the Ukrainian state. Whereas 79% of Orange revolutionaries indicated that they were “very proud” or “mostly proud” of being a citizen of Ukraine, only 32% of revolution opponents did (42% among counter-revolutionaries, though they were also the most likely to indicate that they were not proud of being a citizen of Ukraine). When asked how they primarily identified themselves, revolutionaries overwhelmingly chose “Citizen of Ukraine” (almost twice as frequently as revolution supporters, opponents, and the apathetic) and were much less likely to choose a local or regional identity than other groupings. Civic nationalism was one of the main tropes of the Orange revolt, and those who participated in the revolution were precisely those to whom such appeals resonated (Arel Reference Arel, Bredies, Umland and Yakushik2007; Kuzio Reference Kuzio2010).
Figure 8 also shows that while these differences in the language and identity differentiated Orange Revolution participants from other groupings, revolutionaries were in fact relatively homogenous on these same indicators, even across the three clusters of revolutionaries identified earlier. All three clusters were overwhelmingly proud to be Ukrainian, identified primarily as citizens of Ukraine (as opposed to local residents, representative of their ethnic groups, or citizens of the former USSR), and overwhelmingly spoke Ukrainian at home. Thus the revolution's participants consisted of a coalition of groupings with starkly different views on the major issues of Ukrainian politics and a relatively weak commitment to the revolution's master narrative, but sharing an extreme rejection of the incumbent regime, thicker network ties than others, a weaker vulnerability to the selective incentives of the regime, and a high degree of shared symbolic capital through common vectors of language and identity.
Identity Markers across Clusters of Orange Revolution Participants

PREDICTING REVOLUTIONARIES, SUPPORTERS, OPPONENTS, AND THE APATHETIC
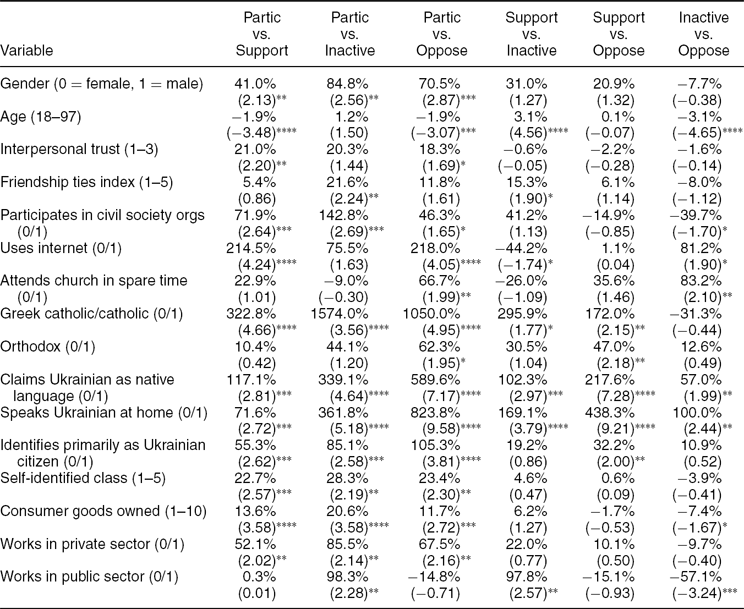
The evidence so far has pointed to the presence of several factors underpinning individual participation in the Orange revolution: the possession of independent resources; the personal ties and networks of individuals; and identities, cultural practices, and conceptions of community. As a further test, I subjected these findings to multivariate analysis to identify the independent effects and relative influence of each on participation in and attitudes toward the revolution. Because of their small number, I combined counter-revolutionaries with revolution opponents, thus giving the dependent variable four outcomes: remain inactive, oppose the revolution, support the revolution without participating in it, or participate in the revolution.Footnote 19 I then conducted a multinomial logistic regression of the relative risk that an individual would fall into one of these four categories. For independent variables, in addition to gender and age as control variables, I used arrays of questions that probed the effects of social capital and network ties (interpersonal trust; a friendship ties index;Footnote 20 whether a person participated in civil society associations; internet usage; and church attendance), culture and identity (whether a person was Greek Catholic or Catholic, identified as Orthodox; claimed Ukrainian as a native language;Footnote 21 spoke Ukrainian at home; and identified primarily as a Ukrainian citizen over other identity categories),Footnote 22 and the degree to which individuals likely were reliant on government resources (class position, measured as self-identified classFootnote 23 and the number of major consumer goods owned, and employment in the private or public sector). Since multinomial logistic regression computes the risk of being a member of a category relative to the risk of being a member of another category, I provide the results for the six possible combinations of comparisons (Table 1).Footnote 24
Multinomial Logistic Regression of the Odds of Participating in, Supporting, Opposing, or Remaining Inactive in the Orange Revolution
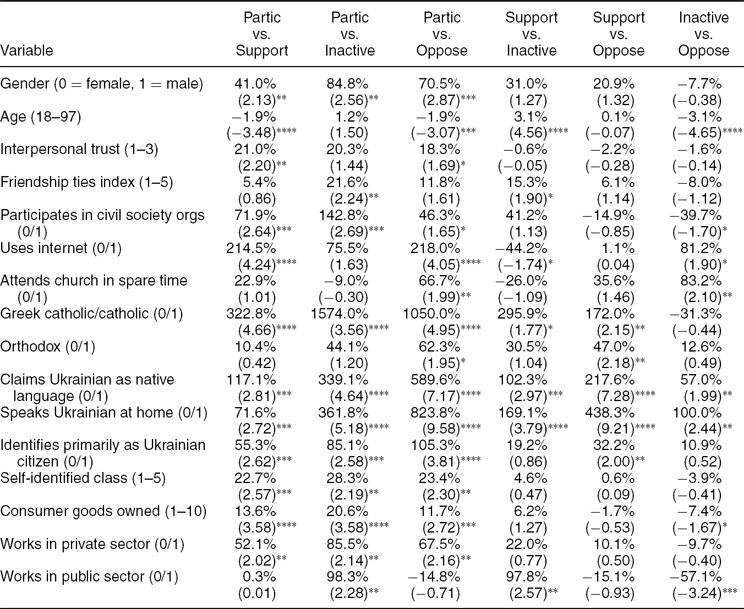
Notes: n = 1,625. Coefficients represent the percentage increase in the odds of being in the first category over the second that is associated with a one-unit increase in the independent variable, with z scores presented in parentheses. For the regression as a whole, the likelihood ratio chi-square = 896.58 (significant at the 0.001 level) and the count R square (accuracy rate of prediction) is 0.58.
* significant at the 0.10 level; **significant at the 0.05 level; ***significant at the 0.01 level; ****significant at the 0.001 level.
What stands out is how powerfully identity (H9) (in particular, language and religion) shaped individual attitudes toward and participation in the revolution (for similar conclusions, see Arel Reference Arel, Bredies, Umland and Yakushik2007; Way Reference Way and D'Anieri2010). Not only did these factors sharply differentiate revolution supporters and participants from those who opposed the revolution or remained completely inactive, but they also powerfully shaped whether an individual decided to participate in the revolution or only support it at the ballot box. Thus controlling for other factors, simply if an individual claimed Ukrainian as a native language, the odds that this person would choose to participate in the revolution rather than merely support it at the ballot box increased by 117%. If a person spoke Ukrainian at home, the odds of participation increased by another 72%. Irrespective of any other factors or influences, if someone both claimed Ukrainian as a native language and spoke Ukrainian at home (41% of the sample), there was a 0.29 predicted probability that he or she would participate, holding all other variables at their means. Similarly, if a person claimed to be Greek Catholic or Catholic (9% of the sample), the odds of participation in the revolution over merely supporting it at the ballot box increased by 323% (whether this person attended church made no difference). Simply being Greek Catholic meant that there was a 0.45 predicted probability of participation, holding all other variables at their means. The effects of language and religion in differentiating revolutionaries from revolution opponents or the apathetic and inactive were even more substantial.
A second result that stands out is how weak ties (H8), in particular, the role of the internet, exercised a more substantial effect on participation than strong ties (H7) (i.e., personal friendship networks, participation in a civil society organizations, or attendance at church) or other forms of social capital. Being an internet user (10% of the sample) increased the odds of participation over simply supporting the revolution by 215%, and internet users had a 0.29 predicted probability of participation, holding all other variables at their means. By contrast, participating in a civil society association (H3) (16% of the sample) increased the odds of participating in rather than just supporting the revolution by only 72% (a 0.19 predicted probability of participation, holding other variables at their means), while church attendance and thickness of friendship ties had no systematic effect on participation, controlling for other variables. Having a high level of interpersonal trust increased the odds of participation over support by only 21%.
Finally, there is mixed evidence for factors associated with selective incentives (H6). As noted earlier, government repression is a key reason why urban civic revolutions rely on the power of numbers in the first place. And individuals with more resources (those higher in the class hierarchy and who owned more consumer goods) were significantly more likely to be revolution participants rather than supporters, opponents, or to remain inactive. Thus, those who identified themselves at the very top of the class hierarchy (11% of the sample) had a 0.20 predicted probability of participation, while those who identified themselves at the bottom of the class hierarchy (8% of the sample) had only a 0.10 predicted probability of participation (holding all other variables constant at their means). But place of employment had a less clear-cut effect. If a person worked in the private sector (24% of the sample), the odds of participation over support increased by 52% (a 0.19 predicted probability of participation), and those working in the private sector were also more likely to participate in the revolution than to be inactive or to oppose it. But state employment had no statistically significant effect on patterns of participation other than to differentiate the inactive and apathetic (who were less likely to be employed by the state) from other groups. In short, if there were threats made by the incumbent regime against participation in the revolution among those working in the public sector, there is no evidence that these threats were effective in deterring public employees from participating (as perhaps one might expect in a case of successful revolution).
REVOLUTIONARY COALITIONS AND POSTREVOLUTIONARY GOVERNANCE IN URBAN CIVIC REVOLUTIONS
Whereas the common stylized image of the “colored revolutionary” is someone young, civic in habits, and democratic in values, the Monitoring and KIIS surveys convincingly demonstrate that Ukraine's revolutionaries defied these stereotypes. Orange revolutionaries were highly diverse in their preferences on most of the major issues of the day, and most were weakly committed to the values of the revolution's democratic master narratives. Instead, the Orange Revolution became a venue through which people with varied beliefs and preferences who, for different reasons, were alienated from the incumbent regime linked up and acted collectively. Orange revolutionaries shared no common visions of values or public policy, and for many participation was conditional on the endorsement of specific politicians, so that the factions from which the revolutionary coalition was built at the top reflected themselves down into the composition of the crowd. Despite this, Orange revolutionaries knew what they stood against. They held Kuchma, for disparate reasons, in common disdain. Moreover, they were united by language, identity, and common cultural capital, reflecting the regional divisions that dominate contemporary Ukrainian politics. Indeed, it is hard to avoid the overwhelming evidence that identity trumped ideology (and nearly everything else) in defining who participated in the revolution, facilitating the formation of a negative revolutionary coalition across disparate policy groupings. Thus, much of the spectacular mobilizational success of the Orange Revolution can be attributed to the degree to which it pulled upon widely shared symbolic capital to mobilize participants with highly diverse preferences into a negative coalition against a regime that was widely understood as representing a competing communal segment of society.
The absence of comparable attitudinal and behavioral data for individual participants in other revolutions makes it difficult to know the extent to which these patterns are replicated in other urban civic revolutions. The data that are available suggest that other urban civic revolutions likely share some, though not all, of the key characteristics of the Orange Revolution coalition. Analyses of the 2011 Arab Barometer surveys in Tunisia and Egypt, (Beissinger, Jamal, and Mazur Reference Beissinger, Jamal and Mazur2012) indicate that they too could be characterized as negative coalitions, fueled predominantly by extreme rejection of the incumbent regime, with no dominant, overarching grievance. Symbolic issues and a sense of national pride also played important roles (Alexander Reference Alexander2011). As in Ukraine, in Tunisia and Egypt revolution participants were somewhat better off than the rest of society, though participants in the Orange Revolution were more diverse in terms of class and education (as one might expect in a revolution dominated by cultural cleavages). But unlike Ukraine, in Tunisia and Egypt economic motivations rather than the element of regional and cultural division were more prominent. Clearly, the types of issues and coalitions that underpin urban civic revolutions vary from case to case depending in large part on types of cleavages and divisions that exist within society and the ways in which authoritarian regimes inspire opposition to themselves. This of course makes a great deal of sense given that the strategic goal of urban revolutions is to mobilize very large numbers in a highly concentrated period of time, since the types of cleavages that might be most effective toward that end will vary from country to country. Nevertheless, the survey evidence also indicates that, as in Ukraine, only a minority of participants in both the Tunisian and Egyptian revolutions prioritized civil and political freedoms as a motivation for revolutionary participation (Beissinger, Jamal, and Mazur Reference Beissinger, Jamal and Mazur2012), even though these revolts were widely framed when they occurred as struggles for democracy.Footnote 25
In this respect, many urban civic revolutions contain the semblance but not the substance of democratic change. Whereas elite-articulated master narratives and mobilizing demands revolve around democratic ends (civil and political freedoms and free-and-fair elections), only a minority of participants are driven by these concerns, and most participate due to other motivations. I have argued that this disjunct is the by-product of the strategic model of mobilizing, in a highly concentrated period of time, very large numbers in concentrated urban spaces. This relationship between revolutionary strategies and the character of revolutionary coalitions bears important implications not only for our understanding of revolutionary processes and our interpretation of urban civic revolutions, but also for our understanding of postrevolutionary governance. Whereas revolutionary organization in peasant revolutions waged over a protracted period of time can ensure some degree of organizational and ideological cohesion among participants through selective incentives, controlled recruitment, or processes of indoctrination, the reliance of urban civic revolutions on a rapidly convened negative coalition of hundreds of thousands fosters instead fractured elites, lack of consensus over fundamental policy issues, and weak commitment to democratic ends among revolutionaries. Indeed, in the case of the Orange Revolution these features proved to be a significant source of instability in the aftermath of attaining power. Despite the shared sense of community that united Orange revolutionaries, once its anti-incumbency goal was achieved, the Orange coalition quickly unraveled at both elite and mass levels. Its leaders became engulfed in factional squabbles; its participants demonstrated weak commitment to the revolution's democratic master narrative, failed to mobilize in defense of the revolution's articulated ideals, and soon broke down into the electoral factions out of which the revolution was originally composed. Eventually, those whom the revolution evicted from power were able to win their way back to office through the ballot box. This outcome was in certain ways built into the very fabric of the urban civic revolutionary model itself. Indeed, all of the colored revolutions of the early to mid 2000s proved fleeting in their democratizing impact, with revolutionary coalitions faltering and eventually failing to consolidate democratic gains.
Not all urban civic revolutions, of course, have experienced this kind of postrevolutionary incoherence and authoritarian backtracking. Some (such as a number of the urban civic revolutions that accompanied the collapse of communism) have been able to build upon the revolutionary experience and the common symbolic capital that underpinned them (despite the postrevolutionary collapse of revolutionary coalitions) to forge fragile but persisting democratic cultures. In the case of the postcommunist states this was strongly facilitated by incentives within the geopolitical environment (Vachudova Reference Vachudova2005). But whereas in protracted peasant revolutions revolutionary movements provide a propitious organizational base for postrevolutionary government through their use of selective incentives, organizational filters, and indoctrination, and few such revolutions are even accompanied by democratic pretensions, successful urban civic revolutionaries face a much more severe set of postrevolutionary organizational and governance tasks. They must tackle the difficult issues of reconfiguring negative revolutionary coalitions into positive electoral ones, creating more coherent forms of political organization, reconstituting the civic sphere, and fostering a culture of democratic purpose if they are to live up to their democratic master narratives and address the diverse and far-reaching national, civic, and material aspirations that urban civic revolutions typically unleash.



Comments
No Comments have been published for this article.