Introduction
Retinal degeneration leads to vision loss and blindness. Retinitis pigmentosa (RP) is the most common form of hereditary retinal degeneration with prevalence of 1:4000 (Hartong et al., Reference Hartong, Berson and Dryja2006). Currently, there are no effective treatments for majority of these neurodegenerative diseases. The Royal College of Surgeons (RCS) rat strain is widely used as a model of retinal degeneration to evaluate safety and efficacy of pharmacological interventions, cell-based therapies, and prosthetic devices for treatment of retinitis pigmentosa. These rats carry a mutation in the MerTK gene that prevents the phagocytosis of shed rod outer segments by retinal pigment epithelium (RPE) cells (Gal et al., Reference Gal, Li, Thompson, Weir, Orth, Jacobson, Apfelstedt-Sylla and Vollrath2000; D’Cruz et al., Reference D’Cruz, Yasumura, Weir, Matthes, Abderrahim, LaVail and Vollrath2000). This defect leads to accumulation of debris within the subretinal space resulting in photoreceptor cell degeneration (Bourne et al., Reference Bourne, Campbell and Tansley1938; Herron et al., Reference Herron, Riegel, Myers and Rubin1969). Previous studies, including from our laboratory, have demonstrated that RCS rats have an aberrant retinal response to light using electroretinogram (ERG) and pupillary light reflex (Machida et al., Reference Machida, Raz-Prag, Fariss, Sieving and Bush2008; Perlman, Reference Perlman1978; Trejo & Cicerone, Reference Trejo and Cicerone1982; Tzameret et al., Reference Tzameret, Sher, Belkin, Treves, Meir, Nagler, Levkovitch-Verbin, Barshack, Rosner and Rotenstreich2014).
Evaluation of visual function and its effect on visually guided behavior is of high importance for the evaluation of new interventions since the ultimate aim of these interventions is to improve vision in patients. Depth perception is an important component of vision enabling three dimensional visualization of the surrounding. It is based on the two-dimensional representation in the retina and requires monocular and binocular inputs (Cumming & DeAngelis, Reference Cumming and DeAngelis2001). Lashley and Russell were the first to demonstrate that depth perception was innate in rats, based on the measurements of the rats’ jumping power between a stall and a distance-based platform (Russell & Lashley, Reference Russell and Lashley1934). Gibson and Walk developed a visual cliff test apparatus to measure depth perception in rats based on a checked wallpaper held above the ground. A “deep” and a “shallow” side were separated by a center board on which the rats were placed at the beginning of the experiment. The rats were observed for five minutes and the researchers found that hooded rats preferably dismounted on the shallow side and avoided the visual cliff. This preference was lost when the visual cliff was eliminated, suggesting that rats discriminate visual depth (Walk et al., Reference Walk, Gibson and Tighe1957).
We developed a modification of the cliff depth perception assay for the assessment of visual function in RCS rats. Rats are placed on a stage in a large Plexiglas box with one side containing an illusory steep drop (“cliff” side) and another side with a minimal drop (“table” side). The latency to dismount the stage and the percentage of rats that set their first foot on the “cliff” side are determined. “Seeing rats” quickly dismount to the “table” side, while in “nonseeing” rats a longer latency to dismount the stage is expected and the direction of dismounting the stage is random. In a previous study, we demonstrated that rats transplanted with hBM-MSCs in one eye, presented improved depth perception compared with age-equivalent control rats that were injected with media (Tzameret et al., Reference Tzameret, Sher, Belkin, Treves, Meir, Nagler, Levkovitch-Verbin, Rotenstreich and Solomon2015).
In the current study, we characterized in depth the correlation between the cliff depth perception, retinal function as well as cone and rod cell structure at different stages of retinal degeneration in the RCS rats. Our results suggest that the cliff depth perception test scores correlated with photoreceptor structure and function and thus may present a valuable, objective, low-cost method for the evaluation of visual function in this widely used animal model in translational studies.
Materials and methods
Animals
Sixty-eight rats of the pigmented RCS strain and four Long–Evans (LE) rats were used in this study (Edwards & Szamier, Reference Edwards and Szamier1977; D’Cruz et al., Reference D’Cruz, Yasumura, Weir, Matthes, Abderrahim, LaVail and Vollrath2000). Rats were born and bred in the Sheba Medical Center animal facility under dim cyclic light (12 h at <5 lux, 12 h in the dark). All animal procedures and experiments were conducted with approval and under the supervision of the Institutional Animal Care Committee at the Sheba Medical Center, Tel HaShomer, and conformed to the recommendations of the Association for Research in Vision and Ophthalmology Statement for the Use of Animals in Ophthalmic and Vision Research.
Visual cliff avoidance test
Visual cliff avoidance was tested based on the protocol reported by Glynn et al. (Glynn et al., Reference Glynn, Bortnick and Morton2003) with some modifications for the assessment of visual function in RCS rats.
Seventy-two rats were tested in an open Perspex box (80 cm × 80 cm × 40 cm × 0.8 cm) that was placed on the edge of a laboratory table (70 cm above the floor) so that two thirds of the box covered the table (“table side”) while one third was suspended over the edge of the table (“cliff side”), creating an appearance of a cliff (Fig. 1A). Black and white checkered papers (100 cm × 70 cm; size of the checkers: 4 cm × 4 cm) were placed on the table and the floor to emphasize the cliff drop-off. Rats were placed on a “stage” (a glass box size 19 × 14 × 6 × 0.5 cm) that was positioned in the middle of the Perspex box (Fig. 1B). This size was chosen to prevent the animals from feeling “comfortable” on the stage. The stage is big enough to prevent accidental slipping from the stage, “forcing” the rats to choose to which direction they “prefer” to dismount.
Visual cliff avoidance test apparatus. The apparatus included an open Perspex box that was placed on the edge of a laboratory table (A) and a small glass “stage” that was positioned in the middle of the Perspex box (B). Black and white checkered papers were placed on the table and the floor underneath the Perspex box to emphasize the cliff drop-off.

Rats were always placed on the center of the stage facing the “table” side. The room light intensity at the location of the rats’ eyes was 31.2 cd/m2, as measured using LS-100 luminance meter (Konica Minolta).
Rats’ activity was recorded for 2 min using a cell phone camera. Parameters analyzed included the direction of the first foot off the stage (“cliff” or “table”) and the latency to dismount the stage (in seconds). For the rats which failed to dismount the stage by 2 min, the latency to dismount the stage was recorded as 120 s. The percentage of rats dismounting to the “cliff” side was calculated using the formula:
 $$\% \;{\rm{of}}\;{\rm{rats}}\;{\rm{dismounting}}\;{\rm{to}}\;{\rm{the}}\;{\rm{cliff}}\;{\rm{side}} = {{{\rm{Number}}\;{\rm{of}}\;{\rm{rats}}\;{\rm{dismounting}}\;{\rm{to}}\;{\rm{the}}\;{\rm{cliff}}\;{\rm{side}}} \over {{\rm{Total}}\;{\rm{number}}\;{\rm{of}}\;{\rm{rats}}}} \times 100.$$
Rats were tested at the ages 4 (n = 20), 6 (n = 10), 8 (n = 7), 10 (n = 20), and 15 weeks (n = 11). Two observers (AT and VE) evaluated the videos of the experiments and reached full agreement. When LE rats were retested two weeks after the initial testing, all rats dismounted the stage faster on the second trial compared with the first trial (mean ± S.E.: 3.75 ± 0.92), suggesting a memory effect (Supplementary material Table S1). Hence, the trial was performed once for each animal, to avoid the memory effect. If the dismounting the stage was not based on the rats’ vision capability, then the rats with functioning retina (i.e., LE rats and young RCS rats) would have dismounted randomly either to the table or to the cliff side.
Electroretinogram (ERG) recording
ERG recording was performed in 51 rats as previously described (Tzameret et al., Reference Tzameret, Sher, Belkin, Treves, Meir, Nagler, Levkovitch-Verbin, Barshack, Rosner and Rotenstreich2014, Reference Tzameret, Sher, Belkin, Treves, Meir, Nagler, Levkovitch-Verbin, Rotenstreich and Solomon2015). ERG was performed at each time point one day after the visual cliff avoidance test. Rats were kept in darkness for 12 h prior to ERG testing. The rats were anesthetized with intraperitoneal injection of 75 mg/kg ketamine and 10 mg/kg xylazine. Pupils were dilated using topical 1% tropicamide. The corneas were kept moist with topical 2.5% hydroxypropyl methylcellulose. ERGs were recorded from both eyes simultaneously using golden wire loops on the corneas. A chloride silver reference electrode was placed subcutaneously near the temporal canthus. The ground electrode was placed on the rat’s tail. For dark-adapted ERG, responses were averaged with stimulus intervals of 1 to 30 s. For light-adapted ERG, the rats were light-adapted for 10 min prior to testing and responses were averaged with stimulus intervals of 1 s. In each animal in each time point, the averaged amplitudes of the ERG recorded from both eyes were calculated for each light intensity. Data are presented as the mean ± s.e.
Histology and immunofluorescence
Histology analysis was performed in 15 rats at ages 4, 10, and 15 weeks (five rats at each age), as we described previously (Tzameret et al., Reference Tzameret, Sher, Belkin, Treves, Meir, Nagler, Levkovitch-Verbin, Barshack, Rosner and Rotenstreich2014, Reference Tzameret, Sher, Belkin, Treves, Meir, Nagler, Levkovitch-Verbin, Rotenstreich and Solomon2015). Eyes were removed, fixed in formalin, and embedded in paraffin. Retinal cross sections (4 µm) cut along the vertical meridian of the eye through the optic nerve were stained with hematoxylin and eosin.
For the detection of rhodopsin or cone opsins, paraffin sections from four rats at each age were incubated following citrate buffer antigen retrieval with anti-rhodopsin (RET-P1, Abcam) or anti-opsin red (M) and blue (S) antibodies (Merck Millipore Mercury) followed by incubation with Alexa Fluor® 488-AffiniPure Donkey Anti-Mouse IgG antibody (Jackson Immuno Research) or Alexa Fluor® 488 AffiniPure Donkey Anti-Rabbit IgG antibody. Sections were counterstained with 4′,6-diamidino-2-phenylindole (DAPI) and examined and photographed by a fluorescent microscope (Olympus BX51). All the histology and immunofluorescence results were obtained from the same rats that were used for the visual cliff test.
Statistical analysis
Statistical analyses were performed using SPSS for Windows, version 20.0 (IBM). To compare the latency to dismount the stage by the five age categories (4, 6, 8, 10, and 15 weeks), we used the Kruskal–Wallis test. Post hoc comparisons between age groups were done using the Mann–Whitney test, with Bonferroni correction for multiple comparisons. Mann–Whitney test was used to compare between LE and RCS rats’ latency to dismount the stage. Spearman’s rho test was performed to determine the correlation between the latency of dismounting the stage and mean binocular maximal ERG b-wave amplitude, photoreceptor outer nuclear layer thickness, and the number of S- and M-cones. The area under the receiver operating characteristic (ROC) curve (AUC) was calculated for the latency to dismount the stage.
Results
Depth perception in RCS rats deteriorates with age
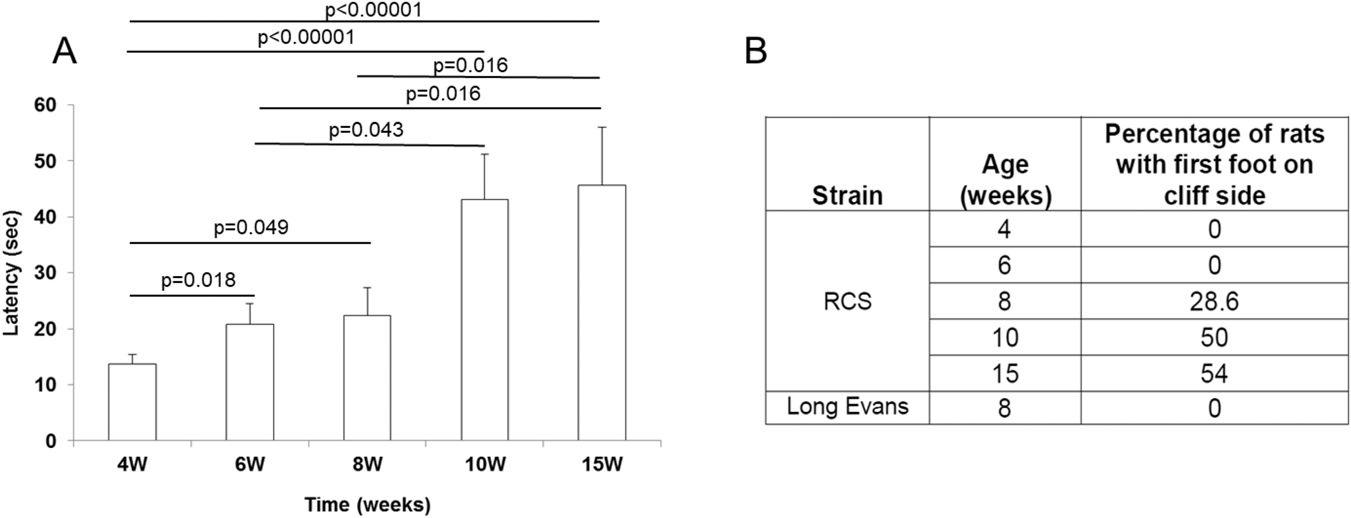
RCS rats were tested for depth perception at the ages 4 (n = 20), 6 (n = 10), 8 (n = 7), 10 (n = 20), and 15 weeks (n = 11). As shown in Fig. 2, young rats at the age of 4 weeks dismounted the stage within 13.7 ± 1.68 s (mean ± s.e., Fig. 2A), and all rats dismounted the stage on the table side (Fig. 2B).
Latency to dismount the starting stage and preference for the table side in RCS rats at different ages. (A) Latency to dismount the starting stage in RCS rats at ages 4 (n = 20), 6 (n = 10), 8 (n = 7), 10 (n = 20), and 15 (n = 11) weeks. Data are presented as mean ± standard error (s.e.). Statistical significance was determined by Kruskal–Wallis test. Post hoc comparisons between age groups were done using the Mann–Whitney test, with Bonferroni correction for multiple comparisons. (B) The percentage of rats that took the first footstep over the cliff side in each strain at the indicated ages.

At the age of 6 weeks, the rats presented a longer latency to dismount the stage (20.8 ± 6.5 s, P = 0.018 compared with 4-week-old rats) and all of them dismounted the stage on the table side. At the age of 8 weeks, 28.6% of the rats dismounted on the cliff side. The latency to dismount the stage significantly differed from 4-week-old rats (P = 0.049), but not from 6-week-old rats (22.3 ± 5.1 s, P = 0.524).
At the age of 10 weeks, rats demonstrated a significantly prolonged latency to dismount the stage (43.1 ± 8.15 s, P < 0.00001, P = 0.043 compared with 4- and 6-week-old rats, respectively) and 50% of them dismounted on the cliff side. There was no significant difference in the latency to dismount the stage between rats at the ages of 10 and 8 weeks (P = 0.06). Rats at the age of 15 weeks presented with a similar prolonged latency to dismount the stage (45.7 ± 10.28 s, P = 0.695 compared with 10-week-old rats), and 54.5% of the rats dismounted on the cliff side. The latency to dismount the stage in 15-week-old rats was statistically longer than rats at ages 4, 6, and 8 weeks (P < 0.00001, P = 0.016 and P = 0.016, respectively). To assess the sensitivity of the visual cliff avoidance test, we performed receiver operating characteristic (ROC) curve analysis, using the maximal ERG scotopic b-wave as the classification variable with a threshold of 10 µV. Thus, maximal ERG scotopic b-wave <10 µV was considered “nondetectable retinal function”; Maximal scotopic b-wave >10 µV was considered “detectable retinal function”. The area under the curve (AUC) was 0.849 (P = 0.000002). The latency to dismount the stage was significantly associated with the age (P = 0.000017).
By contrast, the nondystrophic LE rats at the age of 4 weeks (n = 2) dismounted the stage faster than 4-week-old RCS rats, but the difference was not statistically significant (7 ± 1.58 s, P = 0.057). At the age of 8 weeks (n = 4), the mean latency to dismount the stage was 7 ± 1.6 s (P = 0.35 compared with 4 week old LE rats), and at the age of 20 weeks (n = 4), the mean latency was 5.5 ± 1.3 s (P = 0.6 and P = 0.5, compared with 4- and 8-week old LE rats, respectively). All LE rats dismounted on the table side in all ages tested. There no significant associations between the rats’ age and the latency to dismount the stage (P = 0.596), suggesting that the rats’ age is not independently associated with the latency to dismount the stage.
Deterioration in depth perception in RCS rats was associated with reduction in retinal function
ERG testing is used to determine the function of photoreceptors (a-wave component) and bipolar cells (b-wave component) (Kofuji et al., Reference Kofuji, Ceelen, Zahs, Surbeck, Lester and Newman2000; Penn & Hagins, Reference Penn and Hagins1969; Young et al., Reference Young, Eggenberger and Kaufman2012). Fig. 3 demonstrates the mean binocular a-wave (Fig. 3A and 3B) and b-wave (Fig. 3C and 3D) ERG amplitudes in response to light flashes in increasing luminance levels following dark (Fig. 3A and 3C) or light adaptation (Fig. 3B and 3D) at different time points. The maximal binocular ERG a-wave amplitude response in 4-week-old rats (n = 20) was 48.1 ± 4.7 µV (mean ± s.e.) under dark adaptation and 6.82 ± 1.3 µV under light adaptation. ERG b-wave amplitude response recorded in these rats was 183.07 µV ± 19.1 under dark adaptation and 113 µV ± 10.6 under light adaptation.
Progressive loss of retinal function in RCS rats. Mean binocular maximal a-wave (A and B) and b-wave (C and D) amplitude ERG responses were recorded following dark (A and C) or light adaptation (B and D) in 4 (n = 20, closed squares)-, 10 (n = 20, open circle)-, and 15 (n = 11, closed circle)-week-old rats. Data are presented as mean ± s.e. Representative dark-adapted (E, G, and I) and light-adapted (F, H, and J) ERG waveforms of RCS rats at ages 4 (E and F), 10 (G and H), and 15 (I and J) weeks. *P < 0.00001.

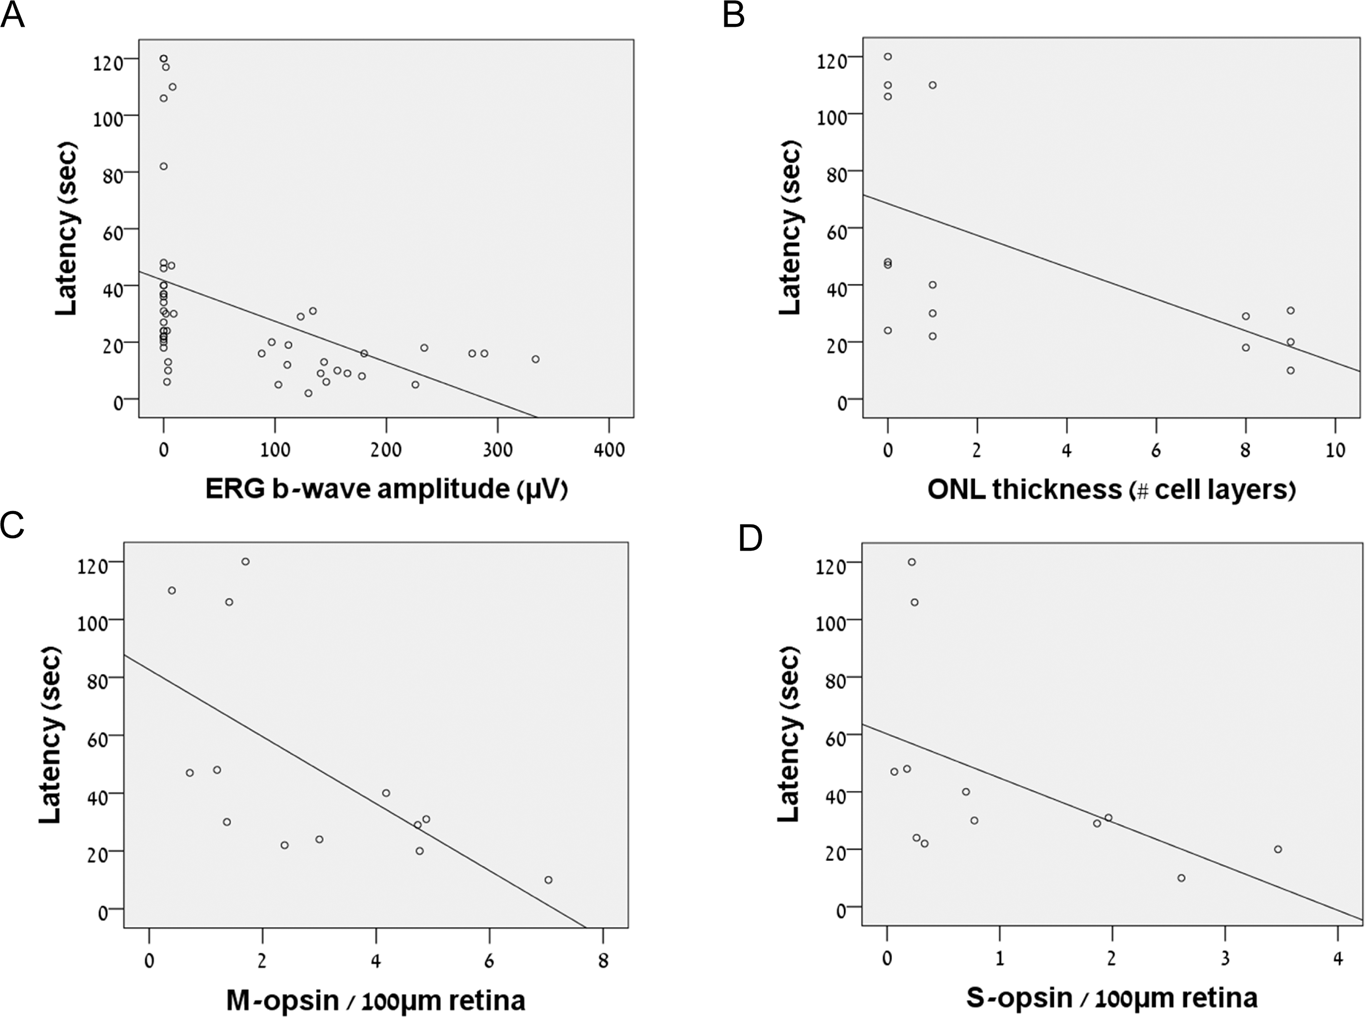
The maximal ERG a- and b-wave amplitude responses were significantly diminished in rats at the age of 10 weeks (n = 20) compared with 4-week-old rats (all P < 0.0001, Fig. 3). Thus, the maximal a-wave amplitude was 1.18 ± 0.5 µV (mean ± s.e.) under dark adaptation and 1.7 ± 0.5 µV under light adaptation. The maximal b-wave amplitude was 1.83 µV ± 0.78 under dark adaptation and 2.7 µV ± 0.6 under light adaptation. At the age of 15 weeks (n = 11), the maximal ERG a- and b-wave amplitude responses were significantly diminished compared with 4-week-old rats (all P < 0.0001), but did not significantly differ from recordings of 10-week-old rats (Fig. 3, all P > 0.05). Thus, the maximal a-wave amplitude was 0.85 ± 0.3 µV (mean ± s.e.) under dark adaptation and 0.38 ± 0.2 µV under light adaptation. The latency to dismount the stage negatively correlated with maximal b-wave recorded under dark and light adaptation (Spearman’s rho test = −0.603 and −0.534, respectively, all P < 0.0001, Fig. 5A).
Deterioration in depth perception in RCS rats correlates with photoreceptor degeneration
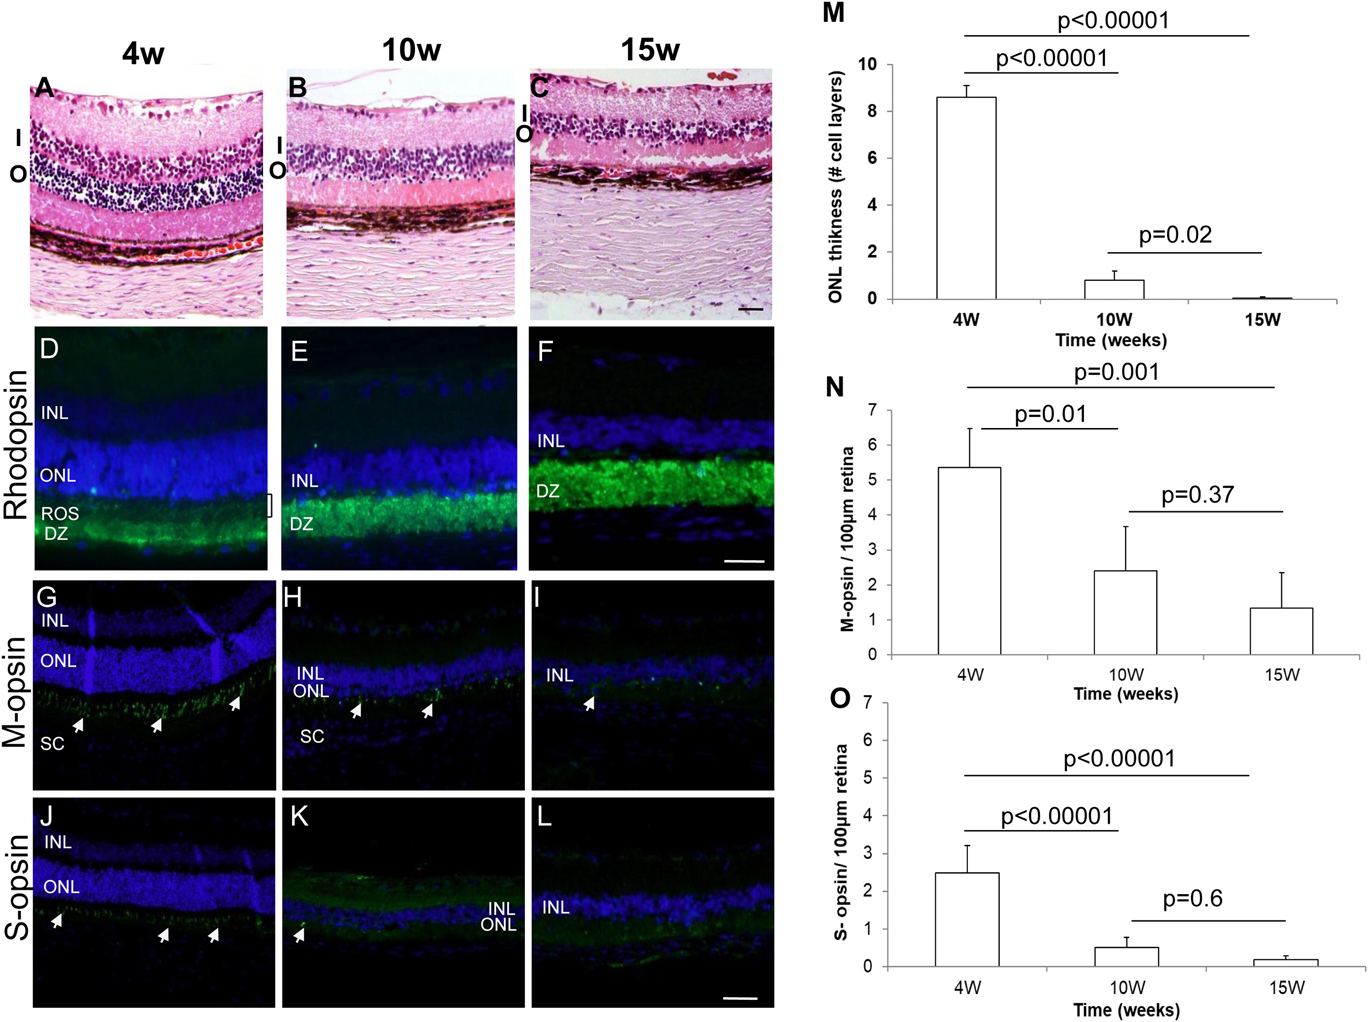
In accordance with the progressive loss of retinal function by ERG, histological analysis of eyes removed at different time points revealed a progressive thinning of the photoreceptor outer nuclear layer (ONL). Thus, in young RCS rats the retina contained nine photoreceptor cell layers (Fig. 4A and 4M, n = 5). At the age of 10 weeks, the retinae contained a single photoreceptor cell layer (Fig. 4B and 4M, n = 5, P < 0.00001 compared with 4-week-old rats). At the age of 15 weeks (n = 5, P < 0.00001 compared with 4-week-old rats, P = 0.02 compared with 10-week-old rats, Fig. 4C and 4M), the photoreceptor nuclear layer was undetectable. A strong negative correlation was found between the latency to dismount the stage and ONL thickness (Spearman’s rho test = −0.764, P = 0.002, Fig. 5B).
Progressive photoreceptor degeneration in RCS rats at different ages. A–C: Representative images of retinal sections were stained with hematoxylin and eosin. I—inner nuclear layer; O—outer nuclear layer. Scale bar: 100 µm. Retinal sections of 4 (D, G, J)-, 10 (E, H, K)-, and 15 (F, I, L)-week-old rats were stained with antibodies against rhodopsin (D, E, F), M-opsin (G, H, I), or S-opsin (J, K, L) (green) followed by counterstaining with DAPI (blue). Scale bar: 50 µm. INL—inner nuclear layer; ONL—outer nuclear layer; ROS—rod outer segments; DZ—debris zone. White arrows highlight some of the positively stained cones. INL—inner nuclear layer; ONL—outer nuclear layer; SC—sclera. M: Quantification of number of cell layers in the ONL was performed for sections taken from 15 rats at the ages of 4, 10, and 15 weeks (five rats from each age group), by counting nuclei in four fields along the entire retina in the hematoxylin and eosin-stained sections. Data are presented as mean ± standard deviation. Quantification of M-(N) and S-(O) cones photoreceptor was performed by counting positively stained cells in three fields along the entire retina in stained sections per 100 µm retina from four eyes at each time point. Data are presented as mean ± standard deviation.

Correlation plots. Correlation plots between the latency to dismount the stage and ERG b-wave amplitude (A), number of ONL cell layers (B), and number of cells positively stained for M-opsin (C) and S-opsin (D) per 100 µm retina.

Rod photoreceptor degeneration was associated with the reduced ERG response and poor depth perception test scores. Rhodopsin-stained outer segments were clearly demonstrated in retinas of 4-week-old rats (Fig. 4D). At 10 and 15 weeks postnatal, the debris zone became more prominent, outer segments were no longer seen, and a strong aberrant accumulation of rhodopsin in rod cell bodies was observed (Fig. 4E and 4F).
Since the depth perception test is performed under photopic conditions, we tested the association between the latency to dismount the stage and cone photoreceptor structure at different ages by staining retinal sections for M- and S-cone opsins. At the age of 4 weeks (n = 4), M- and S-opsin staining was clearly demonstrated in the outer segment layer. Positively stained outer segments were uniformly distributed in the outer retina (Fig. 4G and 4J). However, at 10 weeks postnatal (n = 4), M-cone staining was significantly less abundant, and shorter and distorted cell protrusions were observed (Fig. 4H). At 10 weeks postnatal, only very few S-opsin positive cells were detected (Fig. 4K). Hardly any M- or S-opsin staining could be demonstrated at 15 weeks postnatal (n = 5, Fig. 4I and 4L). Quantification of M- and S-opsin staining demonstrated the progressive loss of both cone cell types as the rats aged (Fig. 4N and 4O). The latency to dismount the stage strongly correlated with the number of M- and S-cones in the retina (Spearman’s rho test = −0.733 [P = 0.004], and −0.763, P = 0.002, respectively, Fig. 5C and 5D).
Discussion
The present study demonstrated the feasibility of using the visual cliff avoidance test for the objective evaluation of visual function in RCS rats, the widely used model of retinal degeneration. As the rats aged, the latency to dismount the stage was prolonged and the rats dismounted randomly either on the “cliff” or on the “table” side, correlating with the loss of retinal function and rod and cone photoreceptor degeneration. Our data suggest that the cliff avoidance test may potentially be used as an objective measure of visual function in RCS rats. Combining the latency to dismount the stage and the side to which the rats made their first step enables evaluation of four “stages” of vision loss: stage 1—“excellent vision” in young rats similar to that of WT rats characterized by a very short latency to dismount the stage (less than 20 s) and dismounting exclusively on the “table” side, correlating with maximal dark-adapted ERG b-wave >100 µV [Fig. 3 and refs (Tzameret et al., Reference Tzameret, Sher, Belkin, Treves, Meir, Nagler, Levkovitch-Verbin, Barshack, Rosner and Rotenstreich2014, Reference Tzameret, Sher, Belkin, Treves, Meir, Nagler, Levkovitch-Verbin, Rotenstreich and Solomon2015 )]; stage 2—“good” vision, slower (around 20 s) latency to dismount the stage and dismounting exclusively on the “table” side (as demonstrated in 6-week-old rats), correlating with maximal dark-adapted ERG b-wave of ∼100 µV [Fig. 3 and refs (Tzameret et al., Reference Tzameret, Sher, Belkin, Treves, Meir, Nagler, Levkovitch-Verbin, Barshack, Rosner and Rotenstreich2014, Reference Tzameret, Sher, Belkin, Treves, Meir, Nagler, Levkovitch-Verbin, Rotenstreich and Solomon2015)]; stage 3—“deteriorated vision”, latency to dismount the stage is similar to stage 2, but some of the animals dismount on the “cliff” side (as demonstrated in 8-week-old rats), correlating with a drop in maximal dark-adapted ERG b-wave ∼10 µV (Tzameret et al., Reference Tzameret, Sher, Belkin, Treves, Meir, Nagler, Levkovitch-Verbin, Barshack, Rosner and Rotenstreich2014, Reference Tzameret, Sher, Belkin, Treves, Meir, Nagler, Levkovitch-Verbin, Rotenstreich and Solomon2015); stage 4—“poor vision”, latency to dismount the stage is higher than 20 s and rats randomly dismount on either side of the stage (as demonstrated in 10- and 15-week-old rats), with nearly nonrecordable maximal dark-adapted ERG b-wave (<10 µV) (Tzameret et al., Reference Tzameret, Sher, Belkin, Treves, Meir, Nagler, Levkovitch-Verbin, Barshack, Rosner and Rotenstreich2014, Reference Tzameret, Sher, Belkin, Treves, Meir, Nagler, Levkovitch-Verbin, Rotenstreich and Solomon2015). Although this system does not provide an exact quantitative assessment of vision function as the optokinetic test, it enables grading of the visual behavior of the rats and may be used as an additional low–cost, readily accessible test to examine rat vision in translational studies. It is noteworthy that the presented ERG results are in accordance with previous studies by our group (Tzameret et al., Reference Tzameret, Sher, Belkin, Treves, Meir, Nagler, Levkovitch-Verbin, Barshack, Rosner and Rotenstreich2014, Reference Tzameret, Sher, Belkin, Treves, Meir, Nagler, Levkovitch-Verbin, Rotenstreich and Solomon2015) and by others (Bush et al., Reference Bush, Hawks and Sieving1995; Machida et al., Reference Machida, Raz-Prag, Fariss, Sieving and Bush2008; Perlman, Reference Perlman1978; Sauve et al., Reference Sauve, Lu and Lund2004; Wurziger et al., Reference Wurziger, Lichtenberger and Hanitzsch2001).
The latency to dismount the stage strongly correlated with ONL thickness and with the number of M- and S-cones, suggesting that this visual function test may be used to assess photoreceptor degeneration. The morphological data presented are in accordance with previous studies by our group (Tzameret et al., Reference Tzameret, Sher, Belkin, Treves, Meir, Nagler, Levkovitch-Verbin, Barshack, Rosner and Rotenstreich2014, Reference Tzameret, Sher, Belkin, Treves, Meir, Nagler, Levkovitch-Verbin, Rotenstreich and Solomon2015) and by others (Girman et al., Reference Girman, Wang and Lund2005; Hou et al., Reference Hou, Fu, Weng, Liu, Zhao and Yin2017; Huang et al., Reference Huang, Yin, Liu and Huo2011; Matthes & LaVail, Reference Matthes and LaVail1989). However, to the best of our knowledge, this is the first study that examined the degeneration of different cone types over a time frame of 15 weeks. Our study suggests that S-cones are lost earlier than the M-cones in this rat model. Since cones are a main target for the treatment of RP (Huang et al., Reference Huang, Yin, Liu and Huo2011; McGill et al., Reference McGill, Bohana-Kashtan, Stoddard, Andrews, Pandit, Rosenberg-Belmaker, Wiser, Matzrafi, Banin and Reubinoff2017), our findings highlight the advantage of using the cliff avoidance test in translational studies aimed at the development of new treatments for RP.
Several other behavioral tests of vision were used in RCS rats to assess visual loss at different ages. Not all of them directly correlated with the loss of retinal function by ERG and photoreceptor degeneration. For example, at the age of 6 months, OKT responses are still recordable, and visual water task testing demonstrates a reduction in only 70% in visual acuity even though no ERG signal can be recorded and histology analysis demonstrates loss of ONL (McGill et al., Reference McGill, Douglas, Lund and Prusky2004, Reference McGill, Lund, Douglas, Wang, Lu, Silver, Secretan, Arthur and Prusky2007, Reference McGill, Prusky, Douglas, Yasumura, Matthes, Lowe, Duncan, Yang, Ahern, Daniello, Silver and LaVail2012). The apparent differences in the results of the different visual function testing approaches in the RCS rat highlight the importance of using a variety of testing procedures in order to fully characterize the rat’s vision.
Water escape performance in a water maze has also been used to assess retinal degeneration progression (DiLoreto et al., Reference DiLoreto, del Cerro, Reddy, Janardhan, Cox, Wyatt and Balkema1996) as well as evaluation of therapeutic effects of cell-based therapies (Little et al., Reference Little, Cox, Wyatt, del Cerro and del Cerro1998). Modified water mazes with computer screens were used in some studies for the evaluation of spatial vision (McGill et al., Reference McGill, Douglas, Lund and Prusky2004). Optokinetic tests, measuring the rats’ ability to track moving stimuli, were also used for the evaluation of binocular and monocular vision at different ages and for the assessment of efficacy of cell transplantation (McGill et al., Reference McGill, Douglas, Lund and Prusky2004; Thomas et al., Reference Thomas, Seiler, Sadda, Coffey and Aramant2004; Gamm et al., Reference Gamm, Wang, Lu, Girman, Holmes, Bischoff, Shearer, Sauve, Capowski, Svendsen and Lund2007; McGill et al., Reference McGill, Lund, Douglas, Wang, Lu, Silver, Secretan, Arthur and Prusky2007; Lu et al., Reference Lu, Malcuit, Wang, Girman, Francis, Lemieux, Lanza and Lund2009; McGill et al., Reference McGill, Prusky, Douglas, Yasumura, Matthes, Lowe, Duncan, Yang, Ahern, Daniello, Silver and LaVail2012; Haamedi et al., Reference Haamedi, Stevanato, Carter, Brooke, Young, Coffey, Sinden, Patel and Vugler2016). However, these tests are relatively laborious, require special large equipment (e.g., a water tank or an optokinetic apparatus), computers with customized software, and an infrared video camera for recording under dark or ambient light conditions (e.g., maze testing). The visual cliff avoidance test is limited by the fact that both eyes contribute to the response. Nevertheless, in a previous study we demonstrated improved visual function (i.e., shorter latency to dismount the stage and lower percentage of animals dismounting on the “cliff” side) following stem cell transplantation in one eye (Tzameret et al., Reference Tzameret, Sher, Belkin, Treves, Meir, Nagler, Levkovitch-Verbin, Rotenstreich and Solomon2015). These data suggest that the cliff avoidance test is sensitive to monocular improvement in retinal structure function and support future use of the test in translational studies in which treatment is introduced only to one eye. Due to possible memory effect, the test can be used once in each rat. Nevertheless, this test enables evaluation of depth perception in RCS rats, which is an important component of visually guided behavior. The test requires no animal pretraining, and relatively low–cost, readily available equipment is needed (2 Plexiglass boxes and a cell phone or other video camera). The visual cliff avoidance test is objective, easy to perform, and relatively quick (2 min for each rat). The strong correlations between the cliff avoidance test scores and retinal function and structure (Figure 5) support its potential use as an objective tool to assess vision capacity in RCS rats.
Supplementary material
To view supplementary material for this article, please visit https://doi.org/10.1017/S095252381800007X.
Acknowledgments
This study was supported by a grant from the Claire and Amedee Maratier Institute for the Study of Blindness and Visual Disorders, Sackler Faculty of Medicine, Tel-Aviv University, Israel, and a research grant from The Moxie Foundation.