Background
Acute exacerbations of chronic obstructive pulmonary disease (AECOPD) are often triggered by infection with bacteria, viruses or both. Reference Papi, Bellettato and Braccioni1 Antibiotic therapy reduces treatment failure overall in moderate to severe AECOPD requiring hospitalization, and is recommended by guidelines in such cases. 2 However, in non-severe exacerbations (not requiring ICU level care), the evidence supporting antibiotic therapy is weak, and appears to be limited to patients with increased sputum purulence. Reference Anthonisen, Manfreda, Warren, Hershfield, Harding and Nelson3,Reference Vollenweider, Jarrett, Steurer-Stey, Garcia-Aymerich and Puhan4 Meanwhile, harms associated with antibiotic therapy—including Clostridioides difficile infection, colonization and subsequent infection with multidrug-resistant pathogens—create an imperative to avoid unnecessary antibiotic therapy. Reference Brett and Al-Hasan5
Procalcitonin (PCT) has emerged as a biomarker of bacterial infection which may identify AECOPD cases least likely to benefit from antibiotic therapy. A meta-analysis of controlled studies of PCT-based protocols in AECOPD found that such protocols decreased antibiotic exposure without affecting treatment failure, exacerbation recurrence, or mortality. Reference Mathioudakis, Chatzimavridou-Grigoriadou, Corlateanu and Vestbo6 In a U.S. study of admitted AECOPD patients, clinical outcomes among those with a low PCT level who received ≤24 hours of antibiotics were similar to those who received ≥ 24 hours, despite a shorter average hospital length of stay. Reference Bremmer, Moffa and Ma7 Since 78%–100% of non-critically ill AECOPD patients demonstrate a low PCT level (<0.25 ng/mL), these patients represent a fruitful target for antibiotic use reduction. Reference Bremmer, DiSilvio and Hammer8–Reference Sheng, Huang and Gu17 Unfortunately, pragmatic studies find that physicians often do not adhere to PCT-based protocols to restrict antibiotics and significant reductions in antibiotic exposure are often not achieved. Reference Ulrich, McClung, Wang, Winters, Flanders and Rao10,Reference Huang, Yealy and Filbin13,Reference Albrich, Dusemund and Bucher18
Antimicrobial stewardship programs (ASP), which frequently include intervention by ASP pharmacists to promote antibiotic de-escalation and discontinuation, have been shown to improve and reduce antimicrobial use in hospitalized patients, including those with AECOPD. Reference Barlam, Cosgrove and Abbo19–Reference Høgli, Garcia, Skjold, Skogen and Småbrekke21 Although PCT-based protocols for AECOPD are typically introduced within the context of a hospital ASP, few studies have evaluated the incremental impact of prospective ASP intervention on PCT protocol adherence and none of these have focused specifically on AECOPD. Reference Watkins, Van Schooneveld, Reha, Anderson, McGinnis and Bergman22,Reference Pevehouse, Shah, Chou, Oolut, Nair and Ahmed23 Given the low adherence with PCT protocols observed in studies conducted in real world settings, the added effect of an active ASP intervention in promoting protocol adherence warrants investigation.
Methods
Study setting and population
This study took place in the emergency department (ED) and internal medicine inpatient wards at Highland Hospital, a 236-bed safety-net teaching hospital in Oakland, California.
Patients admitted between 06/2018 and 12/2024 with a primary admitting or hospital discharge diagnosis of COPD (Supplemental Table 1) were screened for inclusion. Study investigators included patients whose electronic medical record confirmed treatment of AECOPD. Exclusion criteria included: age <18 years; transfer to an outside hospital; pregnancy; admission to the ICU; fever during ED stay; and renal insufficiency requiring hemodialysis. Patients in whom chart review revealed suspected pneumonia, presence of other infection requiring antibiotics or a positive test for COVID-19 were also excluded. Study phase-specific inclusion criteria are described below.
Study design
This was a three-phase interrupted time series study. It was conceived and designed prior to the second phase (Intervention phase I), with data collected retrospectively as the study was ongoing. The first phase, termed the Baseline Phase, took place 06/2018–06/2019, before PCT was offered at the study hospital. Intervention Phases I (02/2020–06/2023) and II (06/2023–12/2024) took place, after the PCT test (Abbot Architect B.R.A.H.M.S. PCT) became available and after an AECOPD-specific ASP intervention was introduced, respectively. In Intervention Phases I and II, PCT testing was recommended for all patients admitted for non-severe AECOPD after a protocol for how PCT levels should guide antibiotic use (Supplement Figure 1) was distributed to emergency medicine and internal medicine attending and house staff by email and regular education sessions at conferences. In short, the protocol recommended antibiotics be discontinued if PCT returned <0.25 ng/mL. For Intervention phase II, an active ASP intervention was introduced: during normally staffed hours, the ASP pharmacist monitored an automated list of continuously updated PCT results to identify newly admitted patients with PCT results whose chart notes indicated they were being treated for AECOPD. If patients with PCT levels <0.25 had an active order for antibiotics directed at AECOPD, the pharmacist immediately contacted the treating team to encourage discontinuation of antibiotics according to the protocol. Because ICD-10 codes were not available at the time of PCT result, these cases were then retrospectively analyzed for inclusion/exclusion.
Patients satisfying inclusion criteria who had a PCT collected within 24 hours of admission were included in the Intervention phase 1 and 2 cohorts. Patients could be included in all three study phases, with just the first admission per phase included. Chart review was used to collect patient demographic and clinical variables, assess inclusion criteria, review pharmacy records and determine outcome measures. ASP pharmacists and pharmacy residents performed data collection within the EHR (Epic, Verona, WI); data was entered into Excel spreadsheets stored on a secure server then de-identified and exported for statistical analysis.
Consent
AHS Institutional Review Board granted a waiver of consent for this observational study that involves sequential changes in protocol-driven clinical care, all of which fall within the evolving standard of care for AECOPD.
Outcome measures
The primary outcome was difference in total antibiotic duration, expressed as mean antibiotic days per AECOPD case, between each phase. Antibiotic days were defined as any day a patient received a dose(s) of antibiotic directed at AECOPD. Antibiotics received in the hospital setting and those prescribed at discharge were included in the total antibiotic duration. This measure of antibiotic exposure allows for comparison to recent trials and meta-analyses. Reference Sheng, Huang and Gu17,Reference Chen, Pleasants and Pleasants24 We considered receipt of ≤1 dose of antibiotics following the PCT result to be discontinuation. Secondary outcomes were differences in median hospital length of stay and 30-day all-cause hospital readmission rates. A post hoc secondary outcome measure was the proportion receiving antibiotics for AECOPD. Mortality within 30 days of hospital discharge was recorded. Additionally, we assessed physician prescribing behavior across the three phases, in response to the interventions.
Statistical analysis
A two sample means test with unequal variances estimated that 570 patients (190 per group) would provide 99.9% power to detect a 2-day difference in antibiotic days of therapy, as previously demonstrated. Reference Bremmer, DiSilvio and Hammer8 Patient characteristics were compared using chi-squared statistics, t-tests and Mann-Whitney tests. Independent samples t-tests were used to compare mean total antibiotic days between Baseline and Intervention Phases. Regression analysis was simply performed for the purpose of comparing the PCT and ASP interventions to other potential predictors of study outcomes. Poisson regression models were calculated to examine antibiotic days and hospital LOS as outcomes. The primary predictor in these models was phase, measured by a trichotomous variable including Baseline Phase, Intervention phase I, and Intervention phase II. Covariates identified based on bivariate analyses were added to the Poisson models. Using the primary predictor of study phase, separate logistic regressions models were calculated for the following outcomes: 30-day all cause hospital readmission as well as the post hoc outcome of were antibiotics given for AECOPD (Y/N) to evaluate and compare the effects of the PCT (Intervention phase I) and PCT plus ASP (Intervention phase II) to the Baseline Phase. To examine the adjusted linear trend between an ordinal exposure (eg, exposure category 0, 1, 2) and the binary outcome, the exposure variable was entered as a continuous linear term in the multivariable logistic regression model, with a Wald test used to determine the significance of the trend, while adjusting for potential confounders. Separate models accounting for time were calculated according to the methods described by Lopez Bernal et al. Reference Lopez Bernal, Cummins and Gasparrini25 All models were examined for regression fit and stability. Statistical analyses were performed using STATA SE version 18.0 (StataCorp LLC, College Station, TX).
Results
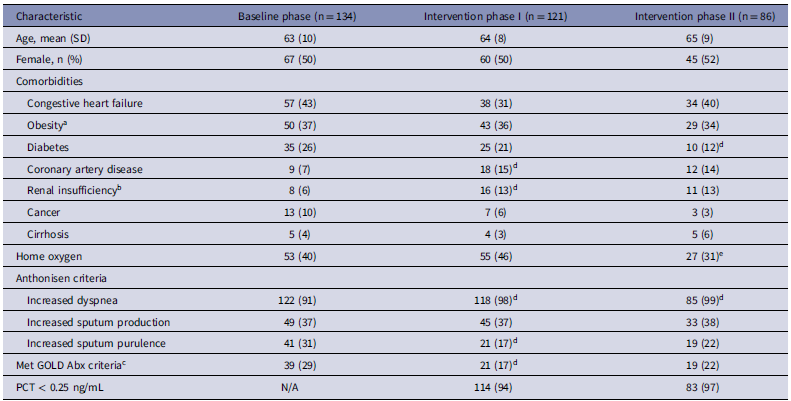
Over the study period, we identified 712 admissions for AECOPD involving 313 unique patients. Of these, 341(48%) admissions met our inclusion criteria, 134 in the Baseline Phase, 121 in Intervention phase I, and 86 in Intervention phase II. Although the target enrollment was not met, the final cohort of 341 yielded a power between 80 and 100% for the antibiotic exposure and hospital length of stay outcomes. Figure 1 shows exclusions. Patient demographics, comorbidities, and symptoms at hospital presentation are shown in Table 1. Just 12 (10%) and 4 (5%) of patients in Phases I and II, respectively, had a second PCT collected.
Study enrollment. PCT, procalcitonin; ASP, antimicrobial stewardship program; AECOPD, acute exacerbation chronic obstructive pulmonary disease; OSH, outside hospital; ABX, antibiotics; ED, emergency department; ICU, intensive care unit.

Figure 1. Long description
A flowchart illustrating the screening and enrollment process for a study on acute exacerbations of chronic obstructive pulmonary disease. The flowchart is divided into three phases: Baseline Phase, Intervention Phase 1, and Intervention Phase 2. In the Baseline Phase, 289 patients were screened for eligible ICD-10 codes. 155 patients were excluded for various reasons, including no diagnosis of AECOPD, pneumonia, ICU admission, transfer to outside hospital, hemodialysis, and missing follow-up data. This resulted in 134 patients being included in the Baseline Phase. In Intervention Phase 1, 228 patients were screened for eligible ICD-10 codes plus PCT order. 107 patients were excluded due to pneumonia, other infections requiring antibiotics, febrile in ED, transfer to outside hospital, age under 18 or pregnancy, ICU admission, hemodialysis, and PCT ordered more than 24 hours after admission or not collected. This resulted in 121 patients being included in Intervention Phase 1. In Intervention Phase 2, 195 patients were screened for eligible ICD-10 codes plus PCT order. 109 patients were excluded for reasons including no eligible ICD-10 code, already included in intervention phase 2, pneumonia, transfer to outside hospital, PCT ordered more than 24 hours after admission or not collected, no diagnosis of AECOPD, ICU admission, and hemodialysis. This resulted in 86 patients being included in Intervention Phase 2, with 18 of them having received ASP intervention.
Demographics, comorbidities and AECOPD clinical characteristics

Table 1. Long description
A table comparing patient demographics, comorbidities, and clinical characteristics across three phases: Baseline phase, Intervention phase I, and Intervention phase II. The table has 15 rows and 4 columns. The columns are labeled as Characteristic, Baseline phase (n = 134), Intervention phase I (n = 121), and Intervention phase II (n = 86). The rows are labeled with various characteristics such as Age, Female, Comorbidities, and Anthonisen criteria. Each row provides specific data points for each phase. For example, the row for Age shows mean (SD) values: 63 (10) for Baseline phase, 64 (8) for Intervention phase I, and 65 (9) for Intervention phase II. The row for Female shows the number (%) of females: 67 (50) for Baseline phase, 60 (50) for Intervention phase I, and 45 (52) for Intervention phase II. Comorbidities include conditions like Congestive heart failure, Obesity, Diabetes, and others, with their respective counts and percentages for each phase. Anthonisen criteria include Increased dyspnea, Increased sputum production, Increased sputum purulence, and others, also with their respective counts and percentages. The table provides a detailed comparison of these characteristics across the three phases.
SD, standard deviation; AECOPD, acute exacerbation chronic obstructive pulmonary disease; GOLD, Global Initiative for Obstructive Lung Disease.
a Body mass index ≥ 30 kg/m2.
b Admit creatinine clearance < 30ml/min based on Cockcroft-Gault equation.
c Patients with increased sputum purulence plus increased sputum production and/or increased dyspnea.
d P ≤ .05 compared to Baseline Phase.
e P ≤ .05 compared to Intervention phase I.
Physician prescribing behavior
Figure 2 shows provider prescribing behavior in response to the PCT result and ASP interventions. More patients received antibiotics prior to the PCT result in Intervention phase I compared to Intervention phase II (64% vs 41%; P = .003). PCT results were usually rapidly available for providers, with a median time from collection to result of 1.2 hours (IQR 0.9–2.7). Less than 5% (10/207) of patients included in Intervention Phases I and II had a PCT ≥0.25 ng/mL, the level supporting initiation or continuation of antibiotics, according to our protocol [Supplement Figure 1]. Following a PCT result of <0.25 ng/ml, antibiotics were discontinued, indicating protocol adherence, in 47/114 (41%) of patients in Intervention phase I and 58/83 (70%) in Intervention phase II (P < .001). Antibiotics were also discontinued in 3 of 7 patients with a PCT result ≥0.25 ng/mL in Intervention phase 1 versus 0 of 3 in Intervention phase 2. During Intervention phase II, the ASP pharmacist prospectively identified and contacted the care team for 70 patients who appeared to be on antibiotics for AECOPD despite a PCT level <0.25 ng/mL, however just 18 proved eligible for study inclusion on retrospective review. Eight (44%) of these 18 patients received ≤1 dose of antibiotics following the pharmacist intervention (presumably in response to it).
Influence of PCT results and ASP interventions on physician antibiotic prescribing. PCT, procalcitonin; ASP, antimicrobial stewardship program; ABX, antibiotics. “Abx stopped” indicates that ≤ 1 dose of antibiotics was given after PCT resulted or ASP intervention “Abx continued” indicates > 1 dose of antibiotics were given after PCT result or ASP intervention a: includes 44 patients who had not received antibiotics prior to PCT result b: ASP intervention: pharmacist contacts managing team to recommend discontinuing antibiotics c: includes 5 patients who had not received antibiotics prior to PCT result d: includes 46 patients who had not received antibiotics prior to PCT result.

Outcome measures
Outcome measure results are shown in Table 2 and Figure 3. Shapiro-Wilk tests demonstrated non-normality for antibiotic days and hospital length of stay data (all W < 0.95, all P < .01). Mean total antibiotic days, the primary outcome, were 4.7 (standard deviation [SD] 3.8) for the Baseline Phase, 3.5 (SD 3.2) for Intervention phase I and 2.1 (SD 2.7) for Intervention phase II, demonstrating significant decreases from each phase to the next and across the three phases (P-trend < .001). Mean outpatient antibiotic days remained ≤1.2 days in each phase of the study with no significant differences between phases. Median hospital LOS was 3.7 (interquartile range [IQR] 2.6–5.2) in the Baseline Phase, 2.8 (IQR 1.5–5.2) in Intervention phase I and 1.5 (IQR 0.3–4.1) in phase II, again demonstrating a significant decrease from each phase to the next and across the three phases (P-trend = .003). The proportion of patients receiving any antibiotics for AECOPD decreased from 88% in the Baseline Phase to 83% in Intervention phase 1 to 64% in Intervention phase II (P-trend < .001). Although this trend was statistically significant, it was driven by the comparison of Intervention phase II to each of the prior two phases (P < .05 v. Baseline; P < .001 v. Intervention phase 1). All-cause hospital readmission rates, the safety outcome measure, were statistically similar across the three study phases: 16% (21/134), 21% (25/121), and 21% (18/86) in Baseline, phase I and phase II, respectively (P-trend = .16). Death within 30 days of discharge occurred in one patient (0.7%) in the Baseline Phase, two (1.7%) in Intervention phase I, and none in Intervention phase II (P > .1 for all comparisons).
Outcome measures

Table 2. Long description
A table comparing outcome measures across three phases of a study. The table has four rows and five columns. The columns are labeled Baseline phase (n = 134), Intervention phase I (n = 121), Intervention phase II (n = 86), and p-trend. The rows are labeled Total antibiotic days, mean (SD), Hospital LOS, median, days (IQR), Received any antibiotics for AECOPD, n (%), and Readmission within 30 days, n (%). Row 1: Total antibiotic days, mean (SD), Baseline phase (n = 134), 4.7 (3.8); Intervention phase I (n = 121), 3.5 (3.2)a; Intervention phase II (n = 86), 2.1 (2.7)a,b; p-trend, <.001. Row 2: Hospital LOS, median, days (IQR), Baseline phase (n = 134), 3.7 (2.6-5.2); Intervention phase I (n = 121), 2.8 (1.5-5.2)a; Intervention phase II (n = 86), 1.5 (0.3-4.1)a,b; p-trend, .003. Row 3: Received any antibiotics for AECOPD, n (%), Baseline phase (n = 134), 118 (88); Intervention phase I (n = 121), 100 (83); Intervention phase II (n = 86), 55 (64)a,b; p-trend, <.001. Row 4: Readmission within 30 days, n (%), Baseline phase (n = 134), 21 (16); Intervention phase I (n = 121), 25 (21); Intervention phase II (n = 86), 18 (21); p-trend, .16.
SD, standard deviation; IQR, inter-quartile range; LOS, length of stay; AECOPD, acute exacerbation chronic obstructive pulmonary disease.
a p < .05 compared to Baseline Phase.
b p < .001 compared to Intervention phase I.
Distribution of antibiotic duration during each study phase. Plot shows total days of antibiotic therapy for each subject (dots) during the entire six-year study. Dotted line shows the mean duration of therapy (primary outcome) for each study phase.

Regression analysis
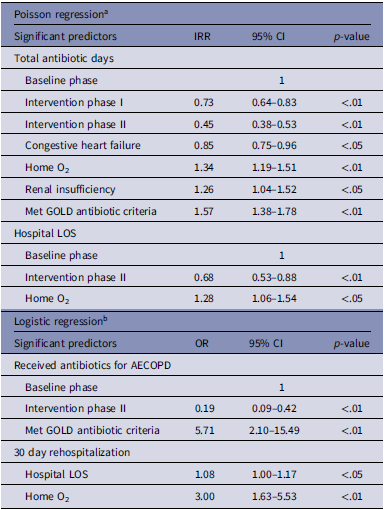
Significant predictors of the primary and secondary outcome measures, as determined by regression analysis, are shown in Table 3. Models calculated without time on study are reported as these were similar to those with time on study. For the primary outcome of antibiotic days, inclusion in Intervention phase I or Intervention phase II were the strongest predictors of fewer antibiotic days, followed by heart failure. Renal insufficiency, home oxygen, and meeting GOLD (Global Initiative for Obstructive Lung Disease) guideline criteria for receipt of antibiotics (increased sputum purulence plus increased sputum production and/or increased dyspnea) were associated with more antibiotic days. 2 For hospital LOS, inclusion in Intervention phase II of the study was predictive of a shorter LOS, though inclusion in Intervention phase I was not statistically predictive; home oxygen was associated with a longer LOS. For the post hoc outcome of receipt of antibiotics for AECOPD, inclusion in Intervention phase II was negatively associated with receipt of antibiotics while meeting GOLD guideline criteria was positively associated. For the safety outcome, inclusion in Intervention Phases I or II were not statistically associated with 30-day readmission, but home oxygen and LOS were.
Regression analysis of factors associated with study outcomes across study phases

Table 3. Long description
A table showing significant predictors of primary and secondary outcome measures determined by regression analysis. The table is divided into two main sections: Poisson regression and Logistic regression. The Poisson regression section includes significant predictors for total antibiotic days and hospital length of stay (LOS). The Logistic regression section includes significant predictors for receiving antibiotics for acute exacerbation of chronic obstructive pulmonary disease (AECOPD) and 30-day rehospitalization. The table has 15 rows and 4 columns. The columns are labeled Significant predictors, IRR, 95 percent CI, and p-value for the Poisson regression section, and Significant predictors, OR, 95 percent CI, and p-value for the Logistic regression section. The rows list various predictors and their corresponding incidence rate ratios (IRR) or odds ratios (OR), 95 percent confidence intervals (CI), and p-values. For total antibiotic days, the baseline phase has an IRR of 1. Intervention phase I has an IRR of 0.73 with a 95 percent CI of 0.64-0.83 and a p-value of less than 0.01. Intervention phase II has an IRR of 0.45 with a 95 percent CI of 0.38-0.53 and a p-value of less than 0.01. Congestive heart failure has an IRR of 0.85 with a 95 percent CI of 0.75-0.96 and a p-value of less than 0.05. Home oxygen has an IRR of 1.34 with a 95 percent CI of 1.19-1.51 and a p-value of less than 0.01. Renal insufficiency has an IRR of 1.26 with a 95 percent CI of 1.04-1.52 and a p-value of less than 0.05. Meeting GOLD antibiotic criteria has an IRR of 1.57 with a 95 percent CI of 1.38-1.78 and a p-value of less than 0.01. For hospital LOS, the baseline phase has an IRR of 1. Intervention phase II has an IRR of 0.68 with a 95 percent CI of 0.53-0.88 and a p-value of less than 0.01. Home oxygen has an IRR of 1.28 with a 95 percent CI of 1.06-1.54 and a p-value of less than 0.05. For receiving antibiotics for AECOPD, the baseline phase has an OR of 1. Intervention phase II has an OR of 0.19 with a 95 percent CI of 0.09-0.42 and a p-value of less than 0.01. Meeting GOLD antibiotic criteria has an OR of 5.71 with a 95 percent CI of 2.10-15.49 and a p-value of less than 0.01. For 30-day rehospitalization, hospital LOS has an OR of 1.08 with a 95 percent CI of 1.00-1.17 and a p-value of less than 0.05. Home oxygen has an OR of 3.00 with a 95 percent CI of 1.63-5.53 and a p-value of less than 0.01.
IRR, incident rate ratio; GOLD, Global Initiative for Obstructive Lung Disease; LOS, length of stay.
a Additional variables included in analyses of Total antibiotic days and Hospital LOS outcomes but not statistically associated with any outcome: Age < 65, gender, coronary artery disease, diabetes, days of symptoms before presentation, increased dyspnea on presentation.
b Additional variables included in analyses of Received antibiotics for AECOPD and 30 day rehospitalization but not statistically associated with any outcome: Intervention phase I, Age < 65, gender, renal insufficiency, coronary artery disease, diabetes, days of symptoms before presentation, increased dyspnea on presentation, congestive heart failure.
Discussion
In this pragmatic, interrupted time series the combination of PCT and ASP intervention resulted in significant reductions in antibiotic exposure and hospital LOS beyond those achieved by the introduction of PCT alone, with no impact on all-cause readmissions. To our knowledge, this is the first investigation to evaluate the added impact of a focused ASP intervention to PCT testing in AECOPD.
Intervention phase I of our study demonstrated a significant reduction in the mean total antibiotic days of 1.2 compared to Baseline Phase, however it fell short of the 2.2 and 2.0 day decreases seen in a recent RCT and in a meta-analysis of prior PCT studies, respectively. Reference Sheng, Huang and Gu17,Reference Chen, Pleasants and Pleasants24 Also, in contrast to prior randomized controlled studies, which showed concomitant reductions of 21%–49% in how often antibiotics were initiated for AECOPD, Intervention phase I demonstrated just a 5% decrease in antibiotic initiation compared to baseline. Reference Christ-Crain, Jaccard-Stolz and Bingisser15,Reference Sheng, Huang and Gu17,Reference Schuetz, Christ-Crain and Thomann26 Intervention phase II, however, demonstrated a reduction in mean antibiotic days of 2.6 days compared to the Baseline Phase along with a nearly 25% reduction in antibiotic initiation for COPD, suggesting that, in a real world clinical setting, addition of the ASP intervention may have been needed to produce the results seen in randomized controlled trials.
Our regression analyses support a strong and independent association between the study interventions themselves, particularly Intervention phase II, and reduction in antibiotic days, corroborating the results of the pseudo-experimental interrupted time series study. Although our study did not evaluate all potential predictors of antibiotic use and AECOPD outcomes, the strength and direction of other associations were as expected. For example, the association between congestive heart failure, and shorter antibiotic duration has previously been observed, Reference Schuetz, Christ-Crain and Thomann26,Reference Schuetz, Grolimund, Kutz, Haubitz and Mueller27 whereas home O2 use, a surrogate for advanced COPD, was associated with more antibiotic days, longer LOS and readmission; meeting GOLD criteria predicted more antibiotic days and receipt of antibiotics for COPD.
Median hospital LOS in Intervention phase II was 2.6 days shorter than the baseline and 1.4 days shorter than in Intervention phase I. Although the study by Bremmer et al demonstrated a similar association between use of PCT and shorter hospital LOS, most other studies have found either no difference or longer associated hospital LOS. Reference Bremmer, DiSilvio and Hammer8,Reference Sheng, Huang and Gu17,Reference Chen, Pleasants and Pleasants24 We hypothesize that the reduced LOS we found may have been directly related to reductions in antibiotic exposure associated with the PCT and the ASP interventions. This is supported by a recent study demonstrating that admitted AECOPD patients who avoid in-hospital antibiotics, as more than one third of patients in Intervention phase II did, have shorter LOS compared to those that do receive antibiotics. Reference Vanoverschelde, Van Hoey and Buyle28
Although our study was not designed to look primarily at safety, the results of our readmission outcome are reassuring and in line with previous controlled trials of PCT protocols to reduce antibiotic use in AECOPD. Reference Chen, Pleasants and Pleasants24 All cause readmission was statistically similar between the baseline and our intervention phases, suggesting that use of a PCT protocol for non-severe AECOPD in a real-world setting does not adversely affect patient safety. However, we did observe a small though non-significant increase in readmissions during the intervention phases, highlighting the need for additional data to better establish the safety of this approach. Reference Sheng, Huang and Gu17,Reference Huang, Wang, Gu, Sheng, Wang and Cao29,Reference van der30
Our case-level data demonstrates familiar challenges when it comes to antibiotic stewardship, protocol implementation and modifying clinician prescribing behavior. During Intervention phase II, ASP contact was successful in just 18 of 83 patients with low PCT levels (Figure 2), of whom just 8 then adhered to the protocol (stopping antibiotics) after the pharmacist’s reminder. Nonetheless, there was a significant trend, from Intervention phase I to II, where ED and admitting clinicians’ adherence improved without ASP feedback, prescribing immediate antibiotics less often in Intervention phase II, either because they waited for PCT results before ordering antibiotics, or immediately discontinued them when the PCT returned <0.25 ng/mL. Consequently, 50 of 65 patients (84%) in phase II received ≤1 dose even without ASP intervention, compared to 47 of 114 (41%) in phase I. We propose two explanations for this trend: a natural increase in acceptance of the PCT protocol over time; and improvement in adherence because of the specter of an active real-time reminder from an ASP pharmacist. Reference Hamade and Huang31
Our study has several limitations. The small sample size from a single center with a relatively robust, longstanding ASP, which could affect intervention acceptance and uptake. An inherent limitation of quasi-experimental interrupted time series methodology is the time-span required, during which other potentially confounding developments can occur. In this case, these may have included the COVID-19 pandemic, wider acceptance and use of PCT for other indications, or concomitant initiatives to reduce hospital LOS and/or readmissions. Reference Bourdin, Ahmed and Vachier32 Results of the regression analysis, however, help to rule out some potential confounders. We did not control for interventions that reduce AECOPD LOS that were already well established during the Baseline Phase, like corticosteroids and non-invasive ventilation. 2 Automatically excluding a subset of AECOPD patients without a PCT result in the intervention phases, but not the baseline phase, may have introduced selection bias. Manual chart abstraction of subjective Anthonisen criteria, and similar data elements, can be challenging and subject to bias; abstractors were not blinded to the study hypothesis. Reference Frazee, Singh and Labreche33 Relying on ICD-10 codes to identify eligible patients may have skewed the study population, as suggested by final inclusion of just 18 of the 70 patients who an ASP pharmacist had identified as receiving antibiotics for AECOPD despite a low PCT. Of those 52 not included, lacking a target ICD-10 code was the reason in 39, likely reflecting known limitations of medical coding data. Reference Nouraei, Virk, Hudovsky, Wathen, Darzi and Parsons34
Additional prospective controlled and pragmatic trials establishing the safety of withholding antibiotics in certain patients with AECOPD, using protocols based on PCT or other biomarkers, are needed. Our results suggest that in a real-world setting, ASP intervention is likely necessary to ensure ongoing adherence to such protocols. We hope to see more implementation studies exploring the most effective, efficient and cost-effective way to combine biomarker protocols with ASP interventions. Studies should compare increased ASP staffing (ie, beyond a single weekday shift) that allows more real-time, verbal physician notification, versus allowing pharmacists to directly stop antibiotic orders, versus automated EHR strategies. Future studies might explore how EHRs and artificial intelligence could accurately identify AECOPD cases, assess severity, incorporate biomarker results and provide antibiotic guidance. Our pragmatic study demonstrates that reductions in antimicrobial exposure and hospital LOS, previously demonstrated in controlled trials of PCT use in AECOPD, can also be achieved in a real-world setting. The novel approach of embedding an active ASP intervention into a PCT protocol was likely critical in achieving these results. Additional studies focusing on implementation are needed.
Supplementary material
The supplementary material for this article can be found at https://doi.org/10.1017/ice.2026.10521.
Acknowledgements
None.
Financial support
None reported.
Competing interests
All authors report no conflicts of interest relevant to this article.