Introduction
The killer whale is one of the most widely ranging mammal species on the planet (Rice Reference Rice1998) and can be found in virtually all marine regions from equatorial to polar waters (Jehl et al. Reference Jehl, Evans, Awbrey and Dreischman1980, Thomas et al. Reference Thomas, Leatherwood, Evans, Jehl and Awbrey1981, Branch & Butterworth Reference Branch and Butterworth2001, Pitman & Ensor Reference Pitman and Ensor2003).
In the Ross Sea the killer whale has been described as the most common cetacean (Lillie Reference Lillie1915) and as in the eastern North Pacific, where three ecotypes have been described (resident, transient and offshore; Ford et al. Reference Ford, Ellis and Balcomb2000), three forms of killer whale have been identified here as well (Pitman & Ensor Reference Pitman and Ensor2003). Referred to as types A, B and C, they can be easily distinguished on the basis of body size, colouration pattern, habitat preferences and food habits. It is generally believed that the type A ‘mammal eating form’ apparently specializes on Antarctic minke whales, while type B preys on pinnipeds, and probably penguins (Lauriano et al. Reference Lauriano, Fortuna and Vacchi2007a, Pitman & Durban Reference Pitman and Durban2010), whereas type C is a fish eater, targeting Antarctic toothfish (Dissostichus mawsoni Norman, 1937) (Pitman & Ensor Reference Pitman and Ensor2003) and possibly Antarctic silverfish (Pleurogramma antarcticum Boulenger, 1902) (Lauriano et al. Reference Lauriano, Vacchi, Ainley and Ballard2007b).
In the Ross Sea, Terra Nova Bay (TNB) is a local marine ecosystem known to sustain a considerable variety and density of species, including predators such as birds, fishes and marine mammals (Berkman & Tipton-Everett Reference Berkman and Tipton-Everett2001). Several species, including the leopard seal (Hydrurga leptonyx de Blainville, 1820), Weddell seal (Leptonychotes weddellii Lesson, 1826), crabeater seal (Lobodon carcinophagus Hombron & Jacquinot, 1842), emperor penguin (Aptenodytes forsteri Gray, 1844) and Adélie penguin (Pygoscelis adeliae Hombron & Jacquinot, 1841) are also prevalent in this area. The presence of this high diversity of upper trophic level predators appears to be a natural consequence of the TNB polynya, as well as high local productivity, in terms of phyto-zooplankton and pelagic fish abundances. Here, killer whales have been reported (Andrews et al. Reference Andrews, Pitman and Ballance2008) to frequent the area possibly because of several penguin colonies, including those of Adélie penguins in three different locations (Edmonson Point, Adélie Cove and Inexpressible Island) and that of the emperor penguin at Cape Washington (Barber-Meyer et al. Reference Barber-Meyer, Kooyman and Ponganis2007). Nevertheless, no quantitative or systematic data has been gathered on the presence, occurrence and ecotype of killer whales or other cetacean species in the TNB area.
Terra Nova Bay is bordered to the south by the floating Drygalski Ice Tongue, to the north by Cape Washington and the Campbell Glacier Tongue in the middle. The TNB bottom topography is a deep pit basin, reaching a depth of more than 1100 m, the greatest on the Ross Sea shelf. The seawater is commonly at its freezing point (-1.91°C), with only rare excursions above -1.0°C (Buffoni et al. Reference Buffoni, Cappelletti and Picco2002). Between October and November, the coast of TNB is usually covered by thick seasonal sea ice which begins to break up in December. Offshore waters of TNB are normally ice-free throughout the winter due to the polynya (Van Woert Reference Van Woert1999, Arrigo & Van Dijken Reference Arrigo and van Dijken2003, Martin et al. Reference Martin, Drucker and Kwok2007).
Despite extensive marine research in this area during the last two decades, the existing knowledge on the relative abundance and distribution of cetaceans is still only anecdotal (e.g. Saino & Guglielmo Reference Saino and Guglielmo1999, Ainley et al. Reference Ainley, Ballard and Olmastroni2009). To improve on this a dedicated aerial survey was carried out within the Italian Antarctic Research Programme, from January to February 2004, in the areas surrounding the Italian Mario Zucchelli Station (MZS).
Materials and methods
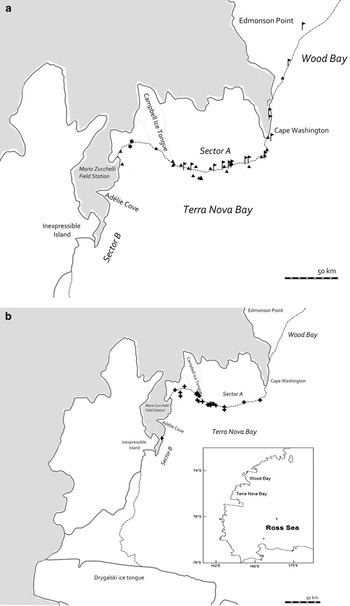
Surveys were carried out from the MZS (74°42′S, 164°07′E) along c. 100 km of coast between Edmonson Point (Wood Bay) and the Drygalski Ice Tongue (Fig. 1). The study area was divided into two sub-areas: northward MZS (sector A), characterized by a seasonal fast ice-edge, and southward MZS (sector B), where a perennial ice shelf is present (Fig. 1). The area was surveyed systematically by helicopter, ‘Squirrel AS 350’, with regular windows. Ancillary flights were carried out irregularly in areas more northward and southward. Flight effort, frequency and locations were chosen based on weather conditions and logistics, including matches with other research projects at the base. Flight altitude ranged from 150–200 m and speed was 150 km h-1. Two experienced observers, one sitting in the co-pilot seat and the other in the rear seats, continuously scanned the sea surface. The rear observer covered the side with a view of the open water. For safety reasons (single-engine aircraft) flights were conducted exclusively over the pack ice-edge and coastal land. Each flight had an outbound leg (o) and a return leg (r). If more than three hours elapsed between the end of the outbound trip and the beginning of the return trip, the results of the two trips were considered independent, otherwise the results of both legs were combined. Fours subsets of independent data for encounter rate (ER) calculations were created accordingly (Ao, Ar, Bo and Br). Encounter rates were calculated within different sectors as follow: ER = Σ encounters/Σ kilometres covered. Encounter rates of killer whales, in each sector, were compared by a t-test.
a. The study area (sector A and B extend northward and southward of the Mario Zucchelli field station respectively) and killer whale encounter (solid circle = killer whale B-ecotype, small flag = C-ecotype, solid triangle = undetermined ecotype). b. All other cetacean encounters (minke whale, Arnoux’s beaked whale and unidentified large whale). The Ross Sea is shown in the small box.

Recorded for each cetacean sighting were species, group size and composition (in terms of age classes). Flight tracks and sighting locations were recorded on a Garmin GPS. Killer whale ecotype identification, both visually and by photographs, was done on the basis of the eye patch size and orientation (Pitman & Ensor Reference Pitman and Ensor2003). When possible, killer whale photo-identification was facilitated by using a Nikon 35 mm reflex camera, equipped with an 80–400 mm, image-stabilized lens. On these occasions, the helicopter landed on the sea ice near its edge and photo-identification was carried out from there. If landing was not deemed safe, the helicopter hovered, reducing its speed and altitude. Only high-quality clear photographs and videos, showing distinctive features, were eventually used for identification of individuals. These features were the shape of the dorsal fin and any other secondary character such as the eye patch (Visser & Mäkeläinen Reference Visser and Mäkeläinen2000), the saddle patch (Baird & Stacey Reference Baird and Stacey1988) and the presence of a yellow cast due to a diatom film.
Results
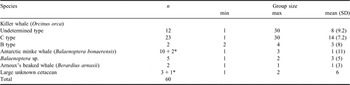
Between 5 January and 2 February 2004, 5272.5 km were systematically covered, producing 57 sightings (Fig. 1, Table I). Killer whales were the most commonly sighted cetacean with 37 sightings (Table I). An additional 952 km was covered northwards (665 km) and southwards (287 km), outside the study area. Three sightings (two minke whales and one large unknown cetacean) occurred in the northern area (none in the southern).
All sightings in the study area (A, B) and outside (*) two way flights (outbound, return).

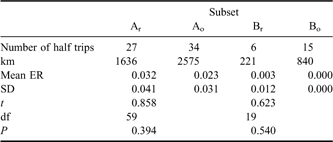
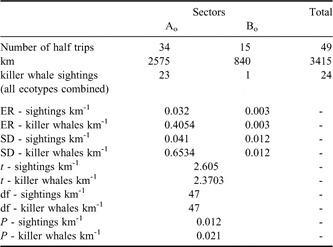
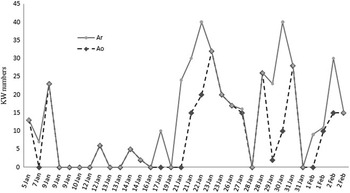
No statistically significant differences existed in ER for all species combined between the outbound and return subsets of data for either the A or B sectors (Table II), whereas the killer whale ERs (all ecotype and sightings combined) differed significantly (Table III; t = 2.6045, P < 0.05) between Ao (with 18 sightings) and Bo (one sighting). Moreover, the killer whale ER in sector A (ER = 0.0316 groups km-1) was of one order of magnitude higher than that of sector B (ER = 0.0031 groups km-1). Killer whales presence in sector A was not constant as indicated by a peak in late January (Fig. 2). A comparable result is also given by considering the ER as individuals per kilometre between the Ao and Bo (Table III; t = 2.3703, P < 0.05).
Comparisons (t-test) of encounter rates of all cetaceans within each of the two sectors (A, B) for all subsets of data.

Killer whale encounter rates (ER) in the two A and B sectors (outbound). Encounter rate is presented by sightings per kilometre (sightings km-1) and individuals per kilometre (individuals km-1).

The killer whale sightings for each trip in sector A (Ar = return, Ao = outbound).

Images suitable for individual identification were collected during 11 sightings of killer whales in sector A only. A total of 17 animals was identified, 13 of which belonged to type C and four to type B. Nine killer whales were identified through permanent marks on their dorsal fin (six type C, three type B) and eight by marks on their saddle patch and body (seven type C, one type B). A high proportion of animals (69%) were only sighted once. The remaining 31% were sighted two or more times (up to five times). Resights occurred only in sector A as much as 11 days apart.
Discussion
Despite the limited duration of our study and small sample size, this study represents a first systematic attempt to describe distribution and relative abundance of cetaceans along the fast ice-edge and shoreline of TNB and adjacent areas. The survey revealed cetacean presence at TNB and Wood Bay, especially around Cape Washington and the Italian field station (sector A, see Fig. 1). The most common species seen was the killer whale, followed by the Antarctic minke whale. Our effort, thus, complements to some degree that carried out in waters around Ross Island, 200 km to the south (see Ainley et al. Reference Ainley, Ballard and Dugger2006, Reference Ainley, Ballard and Olmastroni2009).
Among killer whales in TNB, ecotypes C predominated with 23 sightings (totalling overall 322 individuals of which 13 were identified), whereas type B was encountered on only two occasions (totalling six individuals of which four were identified). This ratio is consistent with that detected near Ross Island, where it dropped from 50/1 in 2005 to 16/1 by 2008, as type Cs became less abundant.
The seasonal peak observed in type C killer whales in TNB occurs after that observed off Ross Island (Ainley et al. Reference Ainley, Ballard and Olmastroni2009). The degree to which the same type C individuals are involved in both areas awaits a co-ordinated identification programme. Satellite tracking does show that the same type Bs are involved (see Andrews et al. Reference Andrews, Pitman and Ballance2008).
The distribution of sea ice in TNB is influenced by katabatic winds that maintain the polynya, while the Drygalski Ice Tongue acts as a barrier for the pack ice advection from the south (Kurtz & Bromwich Reference Kurtz and Bromwich1983). Sector A, extending for about 60 km north of MZS, is characterized by a periodically breaking extended seasonal ice-edge, suddenly increasing local productivity, and a water depth up to 500 m. Here, deep canyons of the shelf break can also have an effect on the deep circulation and may assist intrusions of circumpolar deep waters onto shelf (Smith et al. Reference Smith, Ainley and Cattaneo-Vietti2007). In sector B, the scanty seasonal pack ice breaching zone is bounded to the glacier cliffs being mostly area characterized by rocks. Our results indicate that these characteristics affect the distribution of top predators in the area. The dramatic differences in both killer whale and other cetacean use of the study area underline the richness of the northern sector, especially between the Campbell Glacier Tongue and Cape Washington (A), compared to the southern sector (B).
In sector A seals and penguins are also commonly present. The large numbers of predators crowding sector A may in part be explained by the abundance of Antarctic silverfish, it being a known spawning area for this important fish species (Granata et al. Reference Granata, Cubeta, Guglielmo, Sidoti, Greco, Vacchi and La Mesa2002, Vacchi et al. Reference Vacchi, La Mesa, Dalù and Macdonald2004). Pleurogramma antarcticum constitutes more than 90% of the abundance and biomass of mid-water fish in waters overlying the Ross Sea shelf (DeWitt Reference DeWitt1970) and may dominate the energy transfer within the water column (e.g. Eastman Reference Eastman1985, Ainley et al. Reference Ainley, Ballard and Dugger2006, La Mesa et al. Reference La Mesa, Eastman and Vacchi2004). The Antarctic silverfish, in fact, represents the most important prey for Cape Washington emperor penguins (Cherel & Kooyman Reference Cherel and Kooyman1998), as well as for Adélie penguins at Edmonson Point (Clarke et al. Reference Clarke, Manly, Kerry, Gardner, Franchi, Corsolini and Focardi1998). This species also represents the main prey of the Antarctic toothfish, other bird species, the Weddell seals, and the Antarctic minke whale (Eastman Reference Eastman1985, La Mesa et al. Reference La Mesa, Eastman and Vacchi2004, Ainley et al. Reference Ainley, Ballard and Dugger2006). A relationship between silverfish presence and that of type C killer whales in the area has been suggested by direct observation of a foraging event in the pack ice (Lauriano et al. Reference Lauriano, Vacchi, Ainley and Ballard2007b).
Likewise, the high concentration of marine mammals and penguin colonies in the northern sector of the study area may help to explain the presence of type B killer whales. This ecotype has been observed attacking Weddell, leopard and crabeater seals, minke and humpback (Megaptera novaeangliae Borowski, 1781) whales (Pitman & Ensor Reference Pitman and Ensor2003, Ainley et al. Reference Ainley, Ballard and Olmastroni2009) and possibly Adélie penguins (Lauriano et al. Reference Lauriano, Fortuna and Vacchi2007a, Pitman & Durban Reference Pitman and Durban2010). On the other hand, the relatively low presence of type B is consistent with the report of Andrews et al. (Reference Andrews, Pitman and Ballance2008), who tracked type B killer whales from McMurdo Sound to the Cape Washington area. The whales travelled quickly and did not remain present in any one spot for more than a few hours. Tracking of type Cs showed them to remain for days in a given area.
Further and more extensive fieldwork is clearly needed in order to assess in detail the presence, distribution and foraging movements of cetaceans, in this area. In addition, systematic studies on cetacean abundance should be carried out, given the present lack of this fundamental information and the importance of the killer whale ecotype C in the Ross Sea (Ainley et al. Reference Ainley, Ballard and Olmastroni2009).
Acknowledgements
The study was possible thanks to the logistic and economic support of the Italian Antarctic Programme (Project PNRA 2002/8.5 U.O.SPEZIE-LAURIANO). We are grateful to the staff of the Italian Mario Zucchelli station and to the team of New Zealand Helicopters for their invaluable, tireless and enthusiastic work. We thank R. Canneri for sorting the photo-identification catalogues. N. Pierantonio improved the structure of an early draft of the paper. A special thanks goes to David Ainley and Robert Pitman for their helpful comments and suggestions.