


1 Introduction
Dynamic stall refers to the unsteady separation of an airfoil boundary layer in a scenario where the time scales of the airfoil motion are of similar order to, or faster than, the times scales of the flow (inviscid and viscous). These events encompass a rich set of interactions that depend on a large parameter set including flow (Reynolds and Mach numbers), motion (pitch rate) and geometric (airfoil thickness and camber) parameters, to highlight the most prominent. This complex dependency makes successful prediction difficult. Large load fluctuations associated with abrupt flow changes and the development of large vortex structures make this a problem of continuing interest to vehicle designers. Comprehensive reviews of experimental test campaigns and computational approaches can be found in McCroskey (Reference McCroskey1982), Carr (Reference Carr1988) and Ekaterinaris & Platzer (Reference Ekaterinaris and Platzer1997).
The dynamic stall literature is vast and extends over more than a half-century. Due to the nature of the current work this brief review is mostly limited to works that have studied dynamic stall in a low-Mach number (
 $M_{\infty }\leqslant 0.2$
) environment such that compressibility effects can be safely ignored. Ham (Reference Ham1967) is considered the first study to describe the phenomenon of dynamic stall as a fundamental and generic fluid dynamic process encompassing a number of engineering concerns such as the stall-flutter instability and wing/gust interactions. The work isolates the delay of stall for an airfoil rapidly pitching above the static stall angle. This leads to the classic description of a continued increase in lift as the airfoil pitches above the static stall angle, culminating in the shedding of a low-pressure disturbance emanating from near the airfoil leading edge. This disturbance is the result of a shed vortex structure, which causes a transient lift increase and, as the vortex convects across the airfoil chord, a strong nose-down pitching moment. Later work by Ham (Reference Ham1972) first linked the development of this leading-edge dynamic stall vortex (DSV) structure with the presence of a laminar separation bubble (LSB) within the leading-edge suction surface boundary layer, prior to stall. These results, on the NACA 0012 airfoil at chord Reynolds number (
 $Re_{c}$
) of
 $0.3\times 10^{6}$
, suggested that a bursting processes within the LSB was the mechanism for leading-edge vortex development. Similar observations have been made by additional experiments within a similar range of
 $Re_{c}$
(Chandrasekhara, Carr & Wilder Reference Chandrasekhara, Carr and Wilder1994; Schreck, Faller & Robinson Reference Schreck, Faller and Robinson2002; Lee & Gerontakos Reference Lee and Gerontakos2004). Martin et al. (Reference Martin, Empey, McCroskey and Caradonna1974) also showed the presence of the LSB on the airfoil suction surface prior to stall, but could not experimentally resolve the bursting process. Their study included a range of
 $Re_{c}$
spanning
 $0.3{-}3.0\times 10^{6}$
and showed a strong sensitivity of the dynamic stall behaviour to
 $Re_{c}$
, indicating that this range encompassed different types of stall processes. These results prompted a more extensive experimental campaign at the NASA Ames Research Center to perform parameter studies at more realistic
 $Re_{c}$
as presented in Carr, McAlister & McCroskey (Reference Carr, McAlister and McCroskey1977) and McAlister, Carr & McCroskey (Reference McAlister, Carr and McCroskey1978) and later on at higher Mach number and for various airfoil sections (McAlister et al.
Reference McAlister, Pucci, McCroskey and Carr1982; McCroskey et al.
Reference McCroskey, McAlister, Carr and Pucci1982; Carr et al.
Reference Carr, McCroskey, McAlister, Pucci and Lambert1982). Carr et al. (Reference Carr, McAlister and McCroskey1977) focuses on the NACA 0012 airfoil at
 $Re_{c}\geqslant 10^{6}$
and coins the phrase ‘abrupt leading-edge separation’ to describe the dynamic stall process at these higher
 $Re_{c}$
. In this process, a leading-edge vortex is formed as the turbulent-separation point rapidly propagates upstream to the airfoil leading edge causing leading-edge suction collapse. This description is opposed to the mechanism of LSB bursting, which had been the primary understanding of leading-edge separation, especially in the case of static stall.
These interactions are of relevance to the attempt to link dynamic stall characteristics to previous classifications of static stall processes, most prominently leading-edge and trailing-edge stall types (Jones Reference Jones1934; McCullough & Gault Reference McCullough and Gault1951). In leading-edge stall, the LSB contracts with increasing angle of attack (
 $\unicode[STIX]{x1D6FC}$
) to a point at which it is no longer able to facilitate turbulent reattachment due to the increasing pressure gradient. This results in a sudden separation of the airfoil boundary layer due to the bursting of the LSB. Leading-edge stall is associated with abrupt lift and moment stalls as well as a hysteresis between pitching directions. Trailing-edge stall, by contrast, occurs in a situation of no LSB or a stable LSB and describes the relatively slow upstream propagation of turbulent boundary-layer separation from the airfoil trailing edge up to the leading edge, resulting in gradual lift and moment stall with little hysteresis. The dynamic counterpart of trailing-edge separation would not necessarily be expected to generate a leading-edge vortex structure. This results in the use of the term abrupt leading-edge separation to contrast the development of a leading-edge vortex from a trailing-edge stall type process instead of a leading-edge stall behaviour. A discussion is included in McCroskey, Carr & McAlister (Reference McCroskey, Carr and McAlister1976) on the role of the LSB in abrupt leading-edge separation where the use of a boundary-layer trip, a reduced leading-edge radius and a cambered leading-edge are each used to contrast the stall behaviour under direct manipulation of the state of the leading-edge LSB. It was concluded that the LSB played little role in the dynamic stall process. However, the process relies on the rapid movement of the turbulent separation upstream from approximately 10 % chord to the leading edge. This process would be facilitated by the turbulent separation interacting with a laminar separation bubble. McCroskey et al. (Reference McCroskey, Carr and McAlister1976) alludes to this and references earlier works by Evans & Mort (Reference Evans and Mort1959) and Wallis (Reference Wallis1962) which describe interactions between turbulent separation and a leading-edge LSB that could be characterised as a ‘second’ type of leading-edge stall. However, at this scale, these boundary-layer mechanics could not be fully visualised or measured experimentally and the discussion relies on semi-empirical computations and inferences from parametric studies. Furthermore, later works (Chandrasekhara, Wilder & Carr Reference Chandrasekhara, Wilder and Carr1996) discussed the particular difficulty in effectively tripping the suction-surface boundary layer in a dynamic stall situation which calls into question whether or not the LSB was entirely removed in the parametric study of McCroskey et al. (Reference McCroskey, Carr and McAlister1976).
Leishman (Reference Leishman1984, Reference Leishman1990) highlighted similar inconsistencies when comparing the dynamic stall behaviour of the NACA 23012 airfoil at
 $Re_{c}=1.5\times 10^{6}$
to its static stall counterpart. He reported a leading-edge type stall behaviour in the dynamic scenario when the airfoil was otherwise classified to exhibit trailing-edge stall in static conditions. Leishman (Reference Leishman1990) presented instantaneous wall pressure histories that show a strong, rapid ‘sharp transient’ in suction just prior to the development of the dynamic stall vortex. In this article, Leishman describes this sharp transient as an upstream effect of a DSV that develops at approximately 10 % chord downstream of the leading edge, however no flow field measurements are available to support this statement. Further data in Leishman (Reference Leishman1984) showed this feature to be consistent over variations in pitching parameters given a high maximum angle and a high pitch rate. Recent experimental results (Gupta & Ansell Reference Gupta and Ansell2018) have recovered the same low-pressure transient. This feature appears to be unique to the abrupt leading-edge separation process and is so far unexplained. Prior to leading-edge suction collapse, studies such as Lorber & Carta (Reference Lorber and Carta1988) at
 $Re_{c}=2.0\times 10^{6}$
have noted increased unsteadiness in pressure near the leading edge. Recent computations at
 $Re_{c}=0.2\times 10^{6}$
and
 $0.5\times 10^{6}$
by Visbal & Garmann (Reference Visbal and Garmann2018) and Visbal (Reference Visbal2014a
) recovered the same unsteadiness linking it to acoustic radiation emanating from the leading-edge LSB. This unsteadiness was also noted by Gupta & Ansell (Reference Gupta and Ansell2018) experimentally at both
 $Re_{c}=0.5\times 10^{6}$
and
 $1.0\times 10^{6}$
.
Modern experiments that rely heavily on the use of particle image velocimetry, such as those by Mulleners & Raffel (Reference Mulleners and Raffel2012, Reference Mulleners and Raffel2013) and Pruski & Bowersox (Reference Pruski and Bowersox2013), have focused on the formation process of the DSV. Using these techniques, the DSV is shown to develop through the amalgamation of turbulent structures and can be, for a brief period of time, fed by the leading-edge separated shear layer before convecting downstream. Pruski & Bowersox (Reference Pruski and Bowersox2013) specifically observed Kelvin–Helmholtz-type structures in the separated shear layer feeding into the DSV. Mulleners & Raffel (Reference Mulleners and Raffel2013) described the breakdown of the separated turbulent shear layer above the thin region of reverse flow and the process by which these structures merge in the development of the DSV.
The lack of understanding of these complex interactions highlights the need for a research technique that is capable of resolving the rapid events which occur within the transitional boundary layer. Wall-resolved large-eddy simulation (LES) is particularly well suited to provide better information about these details. Recent advances in efficient numerical techniques as well as a greater availability of computational resources have made it possible to approach the type of problems described above with LES. Visbal (Reference Visbal2014b
, Reference Visbal2015) and Visbal & Garmann (Reference Visbal and Garmann2018) recently introduced the use of wall-resolved LES in the study of the events that lead to the onset of dynamic stall for a NACA 0012 airfoil operating at
 $Re_{c}=0.2{-}0.5\times 10^{6}$
. For these conditions, a leading-edge LSB was shown to contract to a length approaching 3 %–7 % chord before bursting to form the DSV. At
 $Re_{c}=0.5\times 10^{6}$
a region of separated flow near the trailing edge developed and began to propagate upstream. However, it was shown that LSB bursting occurred before the separation point reached the LSB. These studies also noted hysteresis in the upstream movement of the suction-surface transition point while pitching up from a low angle of attack. These non-equilibrium turbulent features, the aforementioned high-frequency acoustic radiation, as well as the small spatial scales of the LSB highlights the needs for high-fidelity computations capable of resolving each of these features.
Given that there is experimental evidence of the presence of suction surface LSBs up to Reynolds numbers of the order of
 $10^{7}$
(Tani Reference Tani1964), the present study seeks to extend the use of wall-resolved LES to higher
 $Re_{c}$
. Trends at lower
 $Re_{c}$
suggest that an increase in Reynolds number delays pressure-gradient-induced bursting of the LSB to higher
 $\unicode[STIX]{x1D6FC}$
, thus allowing for separation development within the turbulent boundary layer. The present work (preliminary data were presented in Benton & Visbal Reference Benton and Visbal2017) extends the work of Visbal & Garmann (Reference Visbal and Garmann2018) to the much higher
 $Re_{c}$
of
 $1.0\times 10^{6}$
. For the first time, the unsteady boundary-layer interactions that initiate the eventual formation of the DSV, at this condition, are described. It is settled that a direct interaction between a small leading-edge LSB and the upstream-propagating turbulent separation results in a complex leading-edge stall process. The interplay between these boundary-layer features helps to elucidate the mechanisms responsible for the sensitivity of the dynamic stall process to
 $Re_{c}$
within the range of
 $10^{5}{-}10^{6}$
. Note that in this methodology, a three-dimensional finite-span domain with periodic boundary conditions is specified. In order to allow for a practical simulation, the span is extended to the point at which all important scales in the transitional and turbulent boundary layer are resolved, but is otherwise limited such that very long-wavelength behaviours, such as stall cells, are precluded. The simulation begins with a statistically stationary solution at
 $\unicode[STIX]{x1D6FC}=8^{\circ }$
and
 $Re_{c}=1.0\times 10^{6}$
. Through a brief acceleration period the airfoil pitch rate is increased to the constant, non-dimensional value of
 $\unicode[STIX]{x1D6FA}_{0}=\unicode[STIX]{x1D6FA}c/U_{\infty }=0.05$
. Section 2 discusses the numerical approach used in this work and § 3 describes the problem specification and the grid details. In the results (§ 4) the flow development is described in chronological order beginning with the initial condition (§ 4.1) and an overview of the dynamic stall process (§ 4.2). This leads into descriptions of the contraction of the LSB and the upstream propagation of the turbulent separation as the airfoil pitches (§§ 4.3 and 4.4). When these two features meet, a bursting process occurs (§ 4.5) which results in a system of vortex structures that merge to form the DSV (§ 4.6). Finally, concluding statements are made in § 5.
2 Numerical approach
The governing equations are the fully three-dimensional, compressible, unfiltered, Navier–Stokes equations cast in the strong conservative form utilising a general time-dependent curvilinear coordinate transformation from physical to computational space (Vinokur Reference Vinokur1974; Steger Reference Steger1978). Non-dimensionalisation is performed using the free-stream values and the airfoil chord (
 $c$
), with the exception of static pressure which is non-dimensionalised by twice the free-stream dynamic pressure
 $\unicode[STIX]{x1D70C}_{\infty }U_{\infty }^{2}$
. Pressure, density and temperature are related through the ideal gas law.
All simulations are performed with the extensively validated high-order Navier–Stokes solver FDL3DI (Gaitonde & Visbal Reference Gaitonde and Visbal1998; Visbal & Gaitonde Reference Visbal and Gaitonde1999). In this code, a finite-difference approach is employed to discretise the governing equations, and all spatial derivatives are obtained with sixth-order compact-differencing schemes (Lele Reference Lele1992). Time marching is accomplished through a second-order, iterative, implicit, approximately factored method (Beam & Warming Reference Beam and Warming1978).
For the case of a pitching airfoil, the grid is moved in a rigid fashion using the prescribed airfoil motion. To ensure that the geometric conservation law is satisfied, the time metric terms are evaluated employing the procedures described in Visbal & Gaitonde (Reference Visbal and Gaitonde2002).
In order to eliminate spurious components, a high-order lowpass spatial filtering technique (Gaitonde, Shang & Young Reference Gaitonde, Shang and Young1999; Visbal & Gaitonde Reference Visbal and Gaitonde1999) is introduced. A compact formulation based on templates proposed by Lele (Reference Lele1992) and by Alpert (Reference Alpert1981) and with proper choice of coefficients, provides a
 $2N$
th-order formula on a
 $2N+1$
point stencil. These coefficients, along with representative filter transfer functions, can be found in Gaitonde & Visbal (Reference Gaitonde and Visbal1998). The filter is applied to the conserved variables along each transformed coordinate direction once after each time step or sub-iteration.
The above numerical methods are applied to the original unfiltered Navier–Stokes equations, and are used without change in laminar, transitional, or fully turbulent regions of the flow. For turbulent regions of the flow field these high-fidelity spatial algorithmic components provide an effective implicit LES approach in lieu of traditional sub-grid stress models, as demonstrated in Visbal & Rizzetta (Reference Visbal and Rizzetta2002), Rizzetta, Visbal & Blaisdell (Reference Rizzetta, Visbal and Blaisdell2003) and Garmann, Visbal & Orkwis (Reference Garmann, Visbal and Orkwis2013). In regions of laminar and early-stage transition this methodology is effectively a direct numerical simulation of the Navier–Stokes equations, therefore this approach is well suited for the study of unsteady flows highly coupled to transitional processes.
3 Problem specification
3.1 Preliminary considerations
Computations are performed for the NACA 0012 wing section. This symmetric section with 12 % maximum thickness and leading-edge radius
 $r/c=0.0158$
has been used in numerous experimental and computational dynamic stall investigations. In order to avoid major compressibility effects, a low free-stream Mach number
 $M_{\infty }=0.1$
is specified.
The grid is shown in figure 1. The original sharp trailing edge is rounded with a very small circular arc (
 $r/c=0.0018$
) in order to facilitate the use of an O-mesh topology. Sectional two-dimensional grids are used to construct the three-dimensional mesh in the spanwise direction, with uniform
 $\unicode[STIX]{x0394}z$
spacing, to a spanwise extent of
 $S/c=0.05$
. This O-grid is then divided into a system of four nested O-grid blocks. The Chimera overset technique with high-order interpolation (Sherer & Visbal Reference Sherer and Visbal2007) is applied to transfer information between blocks. This allows for successive coarsening in the azimuthal and spanwise directions in regions far from the airfoil, which would otherwise be restricted to resolution requirements dictated by the turbulent boundary layer. The grid used in the current study is comprised of
 $267\times 10^{6}$
nodes. Further details on grid dimensions, spacing, and sensitivity are discussed in detail in appendix A, along with an extended discussion of the choice of spanwise domain size.
Isometric (a) and side (b) views of nested O-grid topology, every fourth point shown.

Along the airfoil surface, a no-slip adiabatic condition is employed in conjunction with a zero normal pressure gradient. The surface velocity components are determined from the imposed pitching motion, and are otherwise set to zero for static cases. Along the far field boundary, located 100 chords away from the airfoil, free-stream conditions are specified. In the far field an absorbing sponge zone, as described by Zhou & Wang (Reference Zhou and Wang2010), is introduced. This region is slowly implemented between
 $50c$
and
 $70c$
away from the airfoil at which point it is fully applied to the end of the domain. Spatially periodic conditions were enforced in both the azimuthal and spanwise (homogeneous) directions using five-plane overlaps.
Computations are performed with a time step of
 $\unicode[STIX]{x0394}tU_{\infty }/c=1\times 10^{-5}$
. This results in nearly 35 000 time steps per degree of rotation. For pitching simulations the entire flow solution is output at a non-dimensional time of 0.02. Additionally, flow properties on the airfoil suction surface and the three nearest grid planes (in order to compute wall velocity gradients) are output corresponding to a non-dimensional time of 0.001.
3.2 Pitching motion
This study examines dynamic stall onset on an airfoil pitching at a constant rate. The solution is initiated with a statistically stationary solution at
 $\unicode[STIX]{x1D6FC}=8^{\circ }$
. To transition into the ramp-type motion, the angular velocity is slowly increased from zero to the constant value of
 $\unicode[STIX]{x1D6FA}_{0}=0.05$
. This is accomplished using the expression
 $$\begin{eqnarray}\dot{\unicode[STIX]{x1D6FC}}(t)=\unicode[STIX]{x1D6FA}_{0}(1-\text{e}^{-4.6t/t_{0}}),\end{eqnarray}$$
where
 $\unicode[STIX]{x1D6FA}_{0}$
is the eventual constant pitch rate and the angular velocity reaches 99 % of its final value within the initial time window specified by
 $t_{0}$
(Visbal & Shang Reference Visbal and Shang1989). Equation (3.1) is integrated to give the instantaneous angle of attack (3.2):
 $$\begin{eqnarray}\unicode[STIX]{x1D6FC}(t)=\unicode[STIX]{x1D6FA}_{0}[t+t_{0}/4.6(\text{e}^{-4.6t/t_{0}}-1)]+\unicode[STIX]{x1D6FC}_{0}.\end{eqnarray}$$
For the ramp-type motion in this document, pitching begins at
 $\unicode[STIX]{x1D6FC}_{0}=8^{\circ }$
, the constant pitch rate is set at
 $\unicode[STIX]{x1D6FA}_{0}=0.05$
and the acceleration decays within the first
 $t_{0}=0.5$
. Pitching is performed about the airfoil quarter-chord location. To facilitate conversion between reported
 $\unicode[STIX]{x1D6FC}$
and time, it is noted that this pitch rate corresponds to
 $2.86^{\circ }$
per convective time or 0.35 time units per degree.
4 Results
4.1 Initial condition at
 $\unicode[STIX]{x1D6FC}=8^{\circ }$

To begin, a statistically stationary solution at
 $\unicode[STIX]{x1D6FC}=8^{\circ }$
is computed. The grid is oriented such that the airfoil is horizontal (as shown in figure 1
b) with the initial
 $\unicode[STIX]{x1D6FC}$
being set in the free stream. At this condition, the airfoil boundary layer is characterised by a small LSB near the leading edge that is responsible for the transition of the upper surface boundary layer to turbulence. The signature of the bubble is shown in figure 2 in both the pressure and skin-friction coefficients. As can be inferred from the inset in figure 2, the boundary layer separates at
 $x/c=0.018$
and reattaches at
 $x/c=0.05$
, giving a bubble length (in surface distance) of
 $L/c=0.034$
. The pressure surface boundary layer is laminar from the stagnation point to the trailing edge.
Time-mean wall pressure coefficient for the static solution at
 $\unicode[STIX]{x1D6FC}=8^{\circ }$
. The inset shows the wall skin-friction coefficient in the vicinity of the laminar separation bubble.

This condition of
 $\unicode[STIX]{x1D6FC}=8^{\circ }$
is chosen to minimise computational requirements for the simulation of the onset of dynamic stall at computationally demanding Reynolds numbers of
 $O(10^{6})$
. The angle is high enough to ensure a laminar boundary layer on the pressure surface for the entirety of the computation, but low enough such that the constant pitch rate can be achieved well below the point at which the airfoil pitches above the static stall angle,
 $\unicode[STIX]{x1D6FC}=12^{\circ }{-}14^{\circ }$
(Critzos, Heyson & Boswinkle Jr Reference Critzos, Heyson and Boswinkle1955; Sheldahl & Klimas Reference Sheldahl and Klimas1981).
4.2 Overview of dynamic stall development
A general overview of the dynamic stall process is first given before a more in-depth discussion of the specific boundary-layer and vortex interactions are presented. Beginning at
 $\unicode[STIX]{x1D6FC}=8^{\circ }$
, a short acceleration period is specified. This transitions the airfoil motion to the constant pitch rate of
 $\unicode[STIX]{x1D6FA}_{0}=0.05$
, which is then maintained to the point at which the simulation is terminated. All visualisations of the flow solution are presented with the grid pitched relative to the initial condition of
 $\unicode[STIX]{x1D6FC}=8^{\circ }$
.
The force history for the manoeuvre is shown in figure 3 with shaded regions highlighting the various stages of boundary-layer and vortex development that describe the onset of dynamic stall. Each of these stages is described in detail in the following sections. Many of the trends in the force history are classic in dynamic stall research namely the high normal force coefficient (
 $C_{n}$
) above the static stall angle with a peak that corresponds to vortex development. Note that when the simulation is terminated (
 $\unicode[STIX]{x1D6FC}\approx 30^{\circ }$
), the DSV has propagated to
 $x/c=0.6$
and
 $C_{n}$
would be expected to drop suddenly once the vortex has convected past the trailing edge. At approximately
 $\unicode[STIX]{x1D6FC}=20^{\circ }$
there is a sudden rise in the drag coefficient (
 $C_{d}$
) as well as a roll off in the quarter-chord moment coefficient (
 $C_{m,c/4}$
), both of which are due to the effective thickening of the airfoil upper surface due to the reversed flow within the turbulent boundary layer. A brief reversal of the trend in moment coefficient is noted at the point of vortex development. This transitions to a rapid increase in the negative moment once the DSV begins to convect downstream.
Force coefficients as a function of
 $\unicode[STIX]{x1D6FC}$
showing the dynamic stall process.

For
 $Re_{c}=1.0\times 10^{6}$
the stages of the onset of dynamic stall listed and highlighted in figure 3 are visualised in figures 4(c) and 5. In figure 4, a spatio-temporal contour of skin-friction coefficient (
 $C_{f}$
) illustrates the contraction of the small region of reverse wall shear associated with the leading-edge LSB, which occurs for each
 $Re_{c}$
. At
 $\unicode[STIX]{x1D6FC}\approx 15^{\circ }$
, turbulent separation (TS) appears near the trailing edge. This is marked with a dashed line and is shown to propagate upstream. Figure 4(a,b) show similar LSB contraction and upstream TS propagation at the lower Reynolds numbers of
 $Re_{c}=0.2\times 10^{6}$
and
 $0.5\times 10^{6}$
. At each lower
 $Re_{c}$
shown here, dynamic stall develops from the bursting of the leading-edge LSB (Visbal Reference Visbal2014b
; Visbal & Garmann Reference Visbal and Garmann2018). It should be noted that these data at lower
 $Re_{c}$
are from new computations beginning with
 $\unicode[STIX]{x1D6FC}_{0}=8^{\circ }$
to allow for direct comparison to
 $Re_{c}=1\times 10^{6}$
. Comparison with the previous results (which began at
 $\unicode[STIX]{x1D6FC}_{0}=4^{\circ }$
) from Visbal (Reference Visbal2014b
) and Visbal & Garmann (Reference Visbal and Garmann2018) are excellent. With increasing
 $Re_{c}$
the LSB is more stable to the bursting process which allows for further upstream propagation of TS before the DSV develops.
The case of
 $Re_{c}=1.0\times 10^{6}$
represents a transition to a new form of dynamic stall within which the LSB exists but is stable to the bursting process and TS is able to propagate upstream to the LSB. The development of the vortex structures from these boundary-layer interactions is illustrated using select instantaneous mid-span contours of entropy in figure 5 (a corresponding animation is made available in the supplementary material at https://doi.org/10.1017/jfm.2018.939). At
 $\unicode[STIX]{x1D6FC}=24^{\circ }$
the TS point has propagated upstream and meets the turbulent reattachment point of the LSB (event 1 in figure 5). This causes a bursting event that results in the development of a small leading-edge vortex (LEV) structure. Meanwhile, the turbulent boundary layer is separated over nearly 98 % of the airfoil suction surface and has begun to roll up to form a second vortex structure termed the turbulent-separation vortex (TSV) in this work (event 2). These structures merge as the LEV wraps up the TSV, pulling it slightly upstream (event 3). This final vortex structure is referred to as the DSV, in the classical sense used in the literature. The DSV then propagates downstream as is typically observed. After formation of the DSV, the simulation is terminated as it is known that the interaction between the DSV and the trailing edge, is highly dependent on full wing geometry and longer-wavelength instabilities not captured in the current spanwise-periodic slice.
Spatio-temporal (
 $x{-}\unicode[STIX]{x1D6FC}$
) contours of span-averaged wall skin-friction coefficient on the airfoil suction surface. Data at the lower Reynolds numbers of
 $Re_{c}=0.2\times 10^{6}$
(a) and
 $0.5\times 10^{6}$
(b) are included for comparison.

Instantaneous contours of entropy at the mid-span showing overall process of dynamic stall. Numbers refer to the list of events in figure 3. An animation of this contour is included in the supplementary material.

The following sections describe these events in further detail with an emphasis on the unsteady boundary-layer mechanics that result in the onset of dynamic stall. At
 $Re_{c}$
of
 $O(10^{6})$
the boundary layer becomes increasingly difficult to resolve experimentally due to its decreasing thickness and the unsteady motion of the airfoil surface. This indicates that high-fidelity computations, such as the current study, are particularly well suited to study these events.
4.3 Laminar separation bubble development
A primary conclusion of the current study is that, despite a relatively high airfoil
 $Re_{c}$
and a very small LSB, the LSB is crucial in the overall development of the DSV and ultimately sets the inception point of the DSV. Accurately accounting for the effect of the LSB is key to locating the DSV and predicting the pressure loads during the unsteady stall process.
As described for the static condition at
 $\unicode[STIX]{x1D6FC}=8^{\circ }$
the LSB is located near the leading edge with an initial length of
 $L/c=0.034$
. As the airfoil pitches up, the flow acceleration around the leading edge increases, resulting in a higher peak suction as well as a stronger adverse pressure gradient across the LSB. Plots of LSB length and suction-surface minimum pressure coefficient (
 $C_{p,min}$
) are included in figure 6. For reference, similar data at lower
 $Re_{c}$
are included. At each of the lower
 $Re_{c}$
a sharp increase in the LSB length occurs associated with the onset of pressure-gradient-induced LSB bursting. This does not occur at
 $Re_{c}=1.0\times 10^{6}$
, where the LSB breaks down due to interaction with the turbulent separation. With increasing
 $Re_{c}$
there is a strong reduction in the LSB length, corresponding to the strong sensitivity of the dynamic stall process to
 $Re_{c}$
within the range presented here. For
 $\unicode[STIX]{x1D6FC}=8^{\circ }$
the length of the LSB as a function of
 $Re_{c}$
is shown to be proportional to
 $Re_{c}^{-1/2}$
as might be expected. This suggests (preliminary computations at
 $Re_{c}=1.5\times 10^{6}$
confirm this) that the sensitivity of the dynamic stall process for
 $Re_{c}>1.0\times 10^{6}$
is likely reduced as suggested by Carr et al. (Reference Carr, McAlister and McCroskey1977) and Leishman (Reference Leishman1990).
LSB length (a) and span-averaged minimum suction surface
 $C_{p}$
(b) each as a function of
 $\unicode[STIX]{x1D6FC}$
. Data at lower
 $Re_{c}$
are included for comparison.

Before vortex development, the leading-edge flow structure is characterised by a contraction of the LSB from
 $L/c=0.034$
to 0.02. Simultaneously, peak suction increases from
 $C_{p}=-4$
to
 $-15$
suggesting flow acceleration up to four times
 $U_{\infty }$
resulting in a local Mach number as high as
 $M_{\infty }=0.5$
, despite the low free-stream Mach number of 0.1. The fact that under this high adverse pressure gradient, no pressure-gradient-induced bursting is observed is an interesting conclusion. Preliminary attempts to apply bursting criteria from the literature (Tani Reference Tani1964; Diwan, Chetan & Ramesh Reference Diwan, Chetan, Ramesh and Govindarajan2006) were made, but with little success. It is likely that a successful bursting criteria in the current situation must take into account the effects of the unsteady motion. This is an area requiring further study.
4.4 Trailing-edge separation movement
For
 $Re_{c}=1.0\times 10^{6}$
, turbulent separation begins to appear at the trailing edge as the airfoil pitches past
 $\unicode[STIX]{x1D6FC}\approx 15^{\circ }$
. Turbulent separation is marked by a black dashed line in figure 4 with a grey shaded region that represents two standard deviations of the recorded instances of zero wall shear. This relative unsteadiness of the separation location decreases as the TS point moves upstream with increasing
 $\unicode[STIX]{x1D6FC}$
. After appearing at the trailing edge, the TS propagates upstream at a rate of
 $0.3U_{\infty }$
with a slight acceleration to
 $0.5U_{\infty }$
by the time separation reaches mid-chord. After this point, upstream propagation decelerates and continues at a mostly constant rate of
 $0.4U_{\infty }$
toward the leading edge. From approximately
 $x/c=0.06$
to the reattachment point of the LSB the TS movement accelerates rapidly, as shown in the inset figure in figure 4(c) and discussed further in the next section. This is the precursor to LEV development.
Turbulent-separation location (a) and pitch rate comparison against Carr et al. (Reference Carr, McAlister and McCroskey1977) (b) each as a function of
 $\unicode[STIX]{x1D6FC}$
. Data at lower
 $Re_{c}$
are included for comparison.

As an implicit validation of the current simulation, as well as a demonstration of the applicability of the current ramp-type motion to understanding sinusoidal pitching, the location of the TS is compared against data presented by Carr et al. (Reference Carr, McAlister and McCroskey1977) at the same
 $Re_{c}$
. This comparison is made as a function of
 $\unicode[STIX]{x1D6FC}$
in both figures 4(c) and 7(a). A comparison of the pitch rate as a function of
 $\unicode[STIX]{x1D6FC}$
is included in figure 7(b), where a thin dashed line shows the sinusoidal motion prescribed experimentally and black squares highlight the points in the motion where the location of the TS had been recorded. The comparison between the two motions is facilitated by the generally similar pitch rates (within the range
 $10^{\circ }\leqslant \unicode[STIX]{x1D6FC}\leqslant 20^{\circ }$
) and the observation made experimentally (Carr Reference Carr1988) that favourable comparisons of dynamic stall behaviour are observed when the pitch rate at the static stall angle is consistent. Given the highly unsteady location of the TS and the somewhat large experimental uncertainty documented by Carr et al. (Reference Carr, McAlister and McCroskey1977) this agreement is excellent. This comparison suggests that the turbulent boundary layer is properly resolved in order to predict the large momentum containing structures that determine averaged features such as turbulent separation.
4.5 Bursting due to LSB/TS interaction
Regions of reverse flow (
 $U_{x}<0$
, black) in the airfoil frame of reference for select instances leading to LEV development. Note in the expanded figures on the left, the
 $y$
-direction is scaled by a factor of two for clarity.

Spatio-temporal contour of span-averaged skin-friction coefficient (a) alongside instantaneous skin-friction profiles (b) and instantaneous contours of spanwise vorticity (c) each illustrating the development of the LEV from the leading-edge LSB. Carets mark
 $x/c$
locations in increments of
 $0.01c$
in (c).

At the point at which the TS reaches the turbulent reattachment point of the LSB a complex series of events are initiated. Regions of span-averaged reverse flow (
 $U_{x}<0$
, airfoil frame of reference) are highlighted in figure 8. As described by Carr et al. (Reference Carr, McAlister and McCroskey1977) a thin region of reverse flow develops over the majority of the airfoil suction surface. Periodic undulations in the outer boundary indicate low-frequency large structures in the separated turbulent boundary layer, a feature that was also noted using smoke visualisations in Carr et al. (Reference Carr, McAlister and McCroskey1977). The expanded views on the left of figure 8 show the upstream extent of the TS point and the small region associated with the recirculating flow within the LSB. At
 $\unicode[STIX]{x1D6FC}=24.08^{\circ }$
the two regions meet and by
 $\unicode[STIX]{x1D6FC}=24.36^{\circ }$
a distinct feature associated with the LEV is apparent. This interaction is expanded further in figure 9 to illustrate the development of the LEV directly from the LSB. The region of strong reverse flow, which terminates the chordwise extent of the LSB, develops continuously into the reverse flow associated with the LEV. This transition is shown through instantaneous snapshots of the skin-friction profile in the leading-edge region as well as contours of instantaneous vorticity in figures 9(b) and 9(c), respectively. During the formation of the LEV (illustrated in figure 9
c) vorticity is fed into this vortex structure directly from the leading-edge shear layer as well as the roll up of the near-stagnant turbulent boundary layer vorticity just downstream of the LSB.
Contours of entropy showing rapid development of LEV.

A series of instantaneous mid-span contours of entropy are included in figure 10 to illustrate the development of the LEV and TSV structures. Corresponding span-averaged wall pressure coefficient distributions are included in figure 11. The development of the LEV structure is very rapid, occurring in the span of
 $\unicode[STIX]{x0394}\unicode[STIX]{x1D6FC}=0.2^{\circ }$
(
 $\unicode[STIX]{x0394}t=0.07$
, figure 9). Experimental evidence for the LEV structure is mixed, given the difficulty in capturing such a small, rapidly developing flow feature. However, it is alluded to in the classical sketches in Carr et al. (Reference Carr, McAlister and McCroskey1977) through the depiction of a small vortex near the leading edge following the upstream spread of turbulent separation. Furthermore, at a similar Reynolds number on the OA209 airfoil, Mulleners & Raffel (Reference Mulleners and Raffel2013) described a ‘primary instability stage’ whereby, after reverse flow spread over much of the airfoil chord, the shear layer broke down into a system of substructures that mutually engulf each other to form a single DSV structure. Although no specific inference was made to an LSB in their work, a small vortex emanating from the leading edge is observed which convects downstream at a rate much quicker than the other similarly sized vortices. Previous research on this airfoil (Richez et al.
Reference Richez, Mary, Gleize and Basdevant2008; Le Pape et al.
Reference Le Pape, Costes, Joubert, David and Deluc2012), spanning the same flow conditions, specifically focused on the presence and behaviour of a small leading-edge LSB, indicating a similar boundary-layer topology as that described in the current computations. It should be noted that of the various pitching motions analysed in Mulleners & Raffel (Reference Mulleners and Raffel2013), the maximum pitch rate is a factor of 2–3 less than that used in the current study. At the same pitch rate and ramp-type motion as that of the current study, Gupta & Ansell (Reference Gupta and Ansell2018), using particle image velocimetry, show both leading-edge and turbulent-separation vortices which interact to form the DSV.
Suction-surface pressure coefficient showing suction collapse, LEV development and TSV development. Time instances approximately correspond to the contours in figure 10.
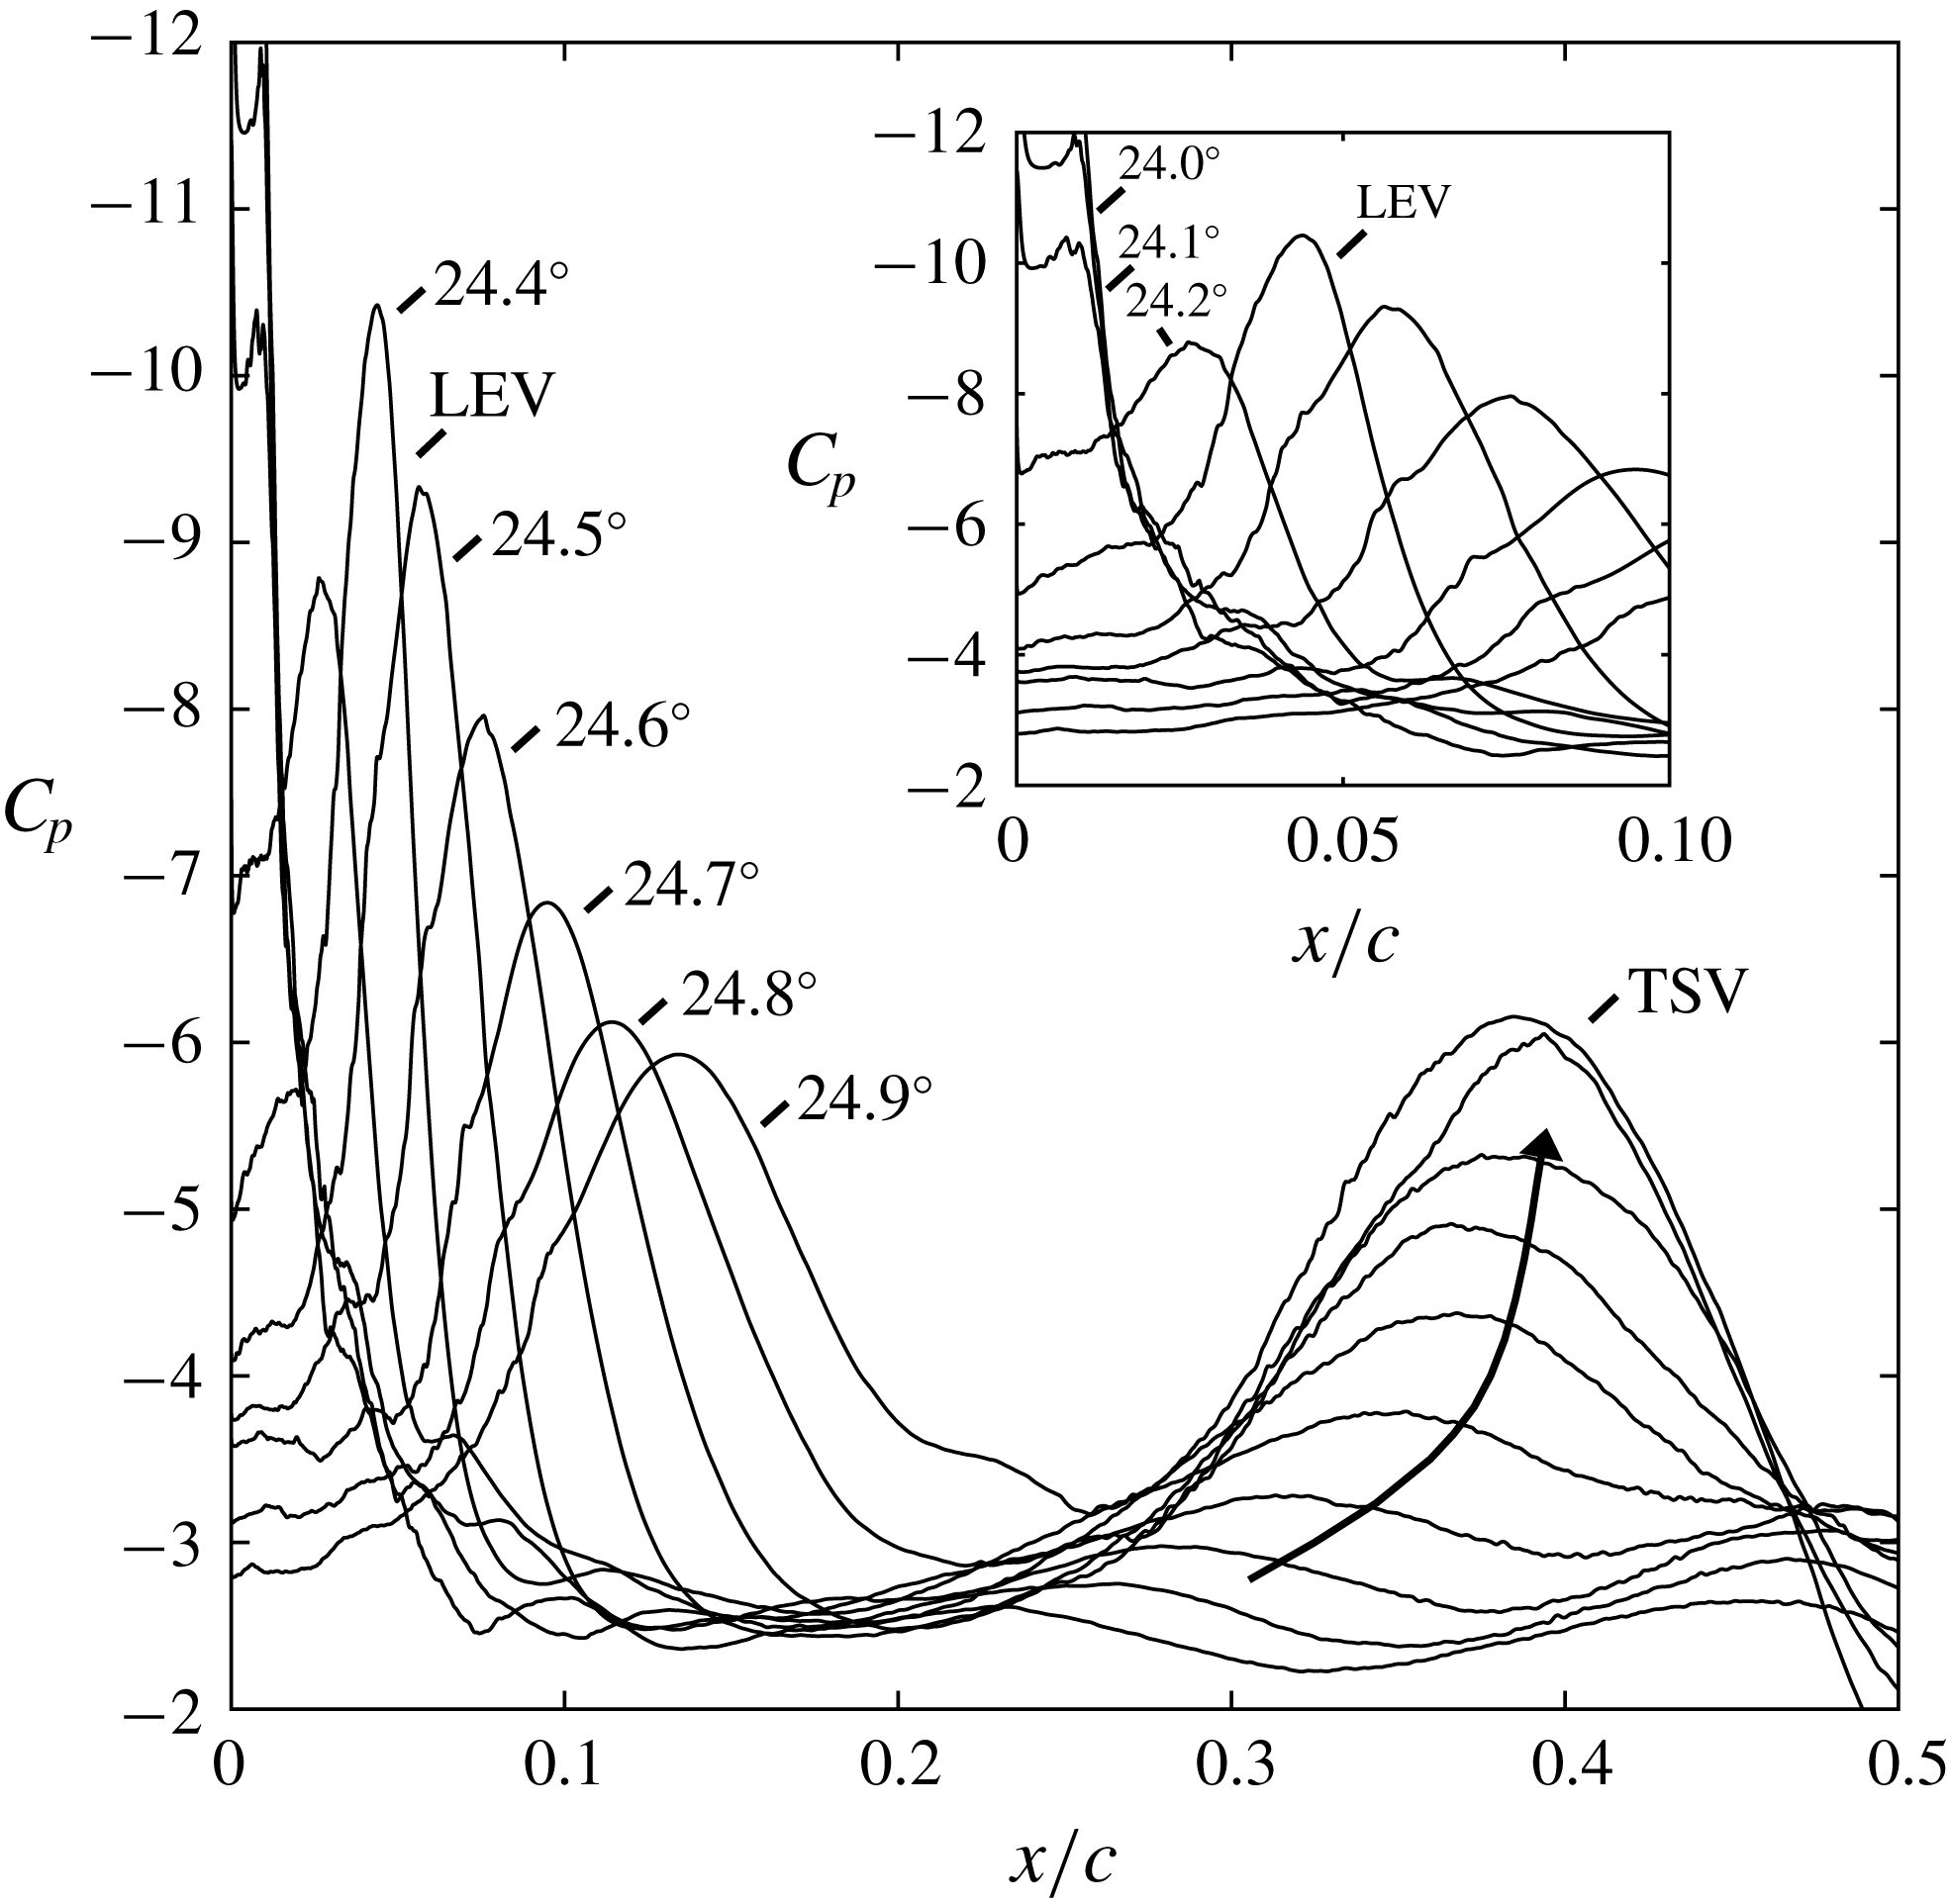
A distinct suction peak associated with the LEV is apparent starting at
 $\unicode[STIX]{x1D6FC}=24.2^{\circ }$
at
 $x/c=0.03$
in figure 11. Up to
 $\unicode[STIX]{x1D6FC}=24.4^{\circ }$
the magnitude of the suction peak grows in strength and then begins to weaken and widen as the LEV convects downstream and departs from the airfoil surface. For a small region of the flow just downstream of the LSB (
 $0.025\leqslant x/c\leqslant 0.10$
) a distinct ‘spike’ or ‘suction transient’ is observed in the wall pressure coefficient as a function of
 $\unicode[STIX]{x1D6FC}$
(see figure 12, marked ‘LEV’). Skin-friction coefficient time histories in figure 12 show that this event is associated with strong reverse flow corresponding to the passing of the LEV. The histories at
 $x/c=0.03$
are initially downstream of the LSB at the point at which the bursting occurs. Tracking the extrema of these events shows that the LEV initially convects downstream at a velocity of
 $0.48U_{\infty }$
. Recent experimental data have captured this pressure transient in a high-frequency wall pressure signal (Gupta & Ansell Reference Gupta and Ansell2018) and it is also noted in the work of Leishman (Reference Leishman1990) who provided wall pressure data for a single cycle of the pitching motion. This sharp transient associated with the LEV is most easily visualised just downstream of the LSB reattachment as the LEV develops, where the slow roll off in suction is distinct from the rapid suction as the LEV passes (figure 12,
 $x/c=0.03{-}0.05$
). The brief pressure minimum is also visible in figure 6(b) in the plots of
 $C_{p,min}$
where the LEV development temporarily increases the peak suction level after the collapse of leading-edge suction. Also visible in figure 12 at
 $x/c=0.01$
is a period of rapid pressure fluctuation prior to suction collapse. This is noted in the experiments of Lorber & Carta (Reference Lorber and Carta1988) at
 $Re_{c}=2.0\times 10^{6}$
and has been shown to be associated with increased acoustic radiation emanating from the LSB which may be considered as a precursor to the onset of dynamic stall (Visbal & Garmann Reference Visbal and Garmann2018).
Span-averaged wall pressure coefficient (upper) and skin-friction coefficient (lower) at
 $x/c=0.01$
, 0.03 and 0.05 (left to right) as a function of
 $\unicode[STIX]{x1D6FC}$
. A moving mean filter with a time window of 0.02 is applied to the skin-friction coefficient to better visualise sharp transitions.

A second feature in figure 10 is the TSV structure that develops over approximately
 $\unicode[STIX]{x0394}\unicode[STIX]{x1D6FC}=0.5^{\circ }$
(
 $\unicode[STIX]{x0394}t=0.17$
). This structure develops due to the roll up of the turbulent separated boundary layer. Starting at
 $\unicode[STIX]{x1D6FC}=24.5^{\circ }$
, when the suction peak is beginning to decay (figure 6
b), the turbulent shear layer appears to break up into a system of separate structures. At least four structures are noted clearly in the contours of entropy. These structures then wrap up together to form the TSV structure (
 $\unicode[STIX]{x1D6FC}=24.8^{\circ }$
, figure 10). This agrees well with the so-called ‘primary instability’ mechanism captured by Mulleners & Raffel (Reference Mulleners and Raffel2013). Figure 11 shows a distinct suction peak associated with the TSV starting at
 $\unicode[STIX]{x1D6FC}=24.5^{\circ }$
. At approximately
 $x/c=0.35$
this peak only slightly moves downstream as it develops in strength.
Comparison of contours of vorticity (upper) compared to entropy (lower) highlighting strength and coherence of LEV compared to TSV.

Figure 13 shows a comparison of vorticity contours contrasted against entropy contours for select stages within the LEV and TSV development process. This depiction highlights the increased strength and coherence of the LEV as compared to the TSV, something which is somewhat obscured through the entropy visualisations. This imbalance in strength sets the dynamics that occurs during the merging process.
4.6 Merging of LEV and TSV
The merging of the LEV and TSV structures is described next. This interaction is key in setting the initial position and strength of the DSV prior to its convection downstream, which is important for the prediction of the force histories throughout the unsteady motion.
The origin of both the TSV and LEV structures is the generation of strong clockwise vorticity in the favourable pressure gradient region of the boundary layer between the stagnation point and the location of peak suction. Until the development of the LEV from the LSB breakdown, the separated turbulent shear layer is continuously fed by the leading-edge vorticity source. This continues as the TSV begins to develop, however at the point at which LEV development occurs, this source of vorticity no longer feeds the TSV resulting in a saturation of total circulation of this structure. Instead leading-edge vorticity feeds the LEV structure which grows in strength to a point at which its total circulation is of similar order to the TSV before it detaches to move downstream.
As the LEV begins to move downstream, the TSV structure is pulled upstream and swept underneath the LEV structure, causing the LEV to lift further from the airfoil surface. This is illustrated from
 $\unicode[STIX]{x1D6FC}=24.9^{\circ }$
to
 $\unicode[STIX]{x1D6FC}=25.5^{\circ }$
in figure 14. Over this same time period figures 15 and 16 show the merging of the local suction peaks associated with these turbulent structures. At
 $\unicode[STIX]{x1D6FC}=24.9^{\circ }$
, the suction peak associated with the LEV is positioned at
 $x/c=0.12$
and the TSV at
 $x/c=0.4$
. Through the merging process the TSV suction peak is pulled upstream and the two peaks merge at
 $x/c=0.25$
. At this point (
 $\unicode[STIX]{x1D6FC}=25.5^{\circ }$
) the two vortex cores (visualised using entropy, figure 14) have yet to merge, but are simply stacked on top of each other. As the cores merge, the suction peak associated with the DSV decreases in strength, widens slightly and begins to convect downstream. A convection speed of
 $0.25U_{\infty }$
was estimated for the DSV based upon
 $x$
-location of minimum
 $C_{p}$
over the time window
 $6.6\leqslant t\leqslant 8.0$
.
Contours of entropy showing merging process of the LEV and the TSV.

Suction-surface pressure coefficient showing merging process between LEV and TSV. Time instances correspond to the contours in figure 14.

Spatio-temporal contour of span-averaged wall pressure coefficient showing the merging process of the LEV and TSV structures.

This process, which sets the initial location of the DSV at
 $x/c=0.2{-}0.3$
, occurs over the span
 $24^{\circ }\leqslant \unicode[STIX]{x1D6FC}\leqslant 26^{\circ }$
in which the average location of the wall suction related to the vortex structures is primarily fixed. The effects of this interaction are observed in the force histories in figure 3, where the roll off of the moment coefficient is briefly reversed and a high normal force coefficient is maintained. As the airfoil continues to pitch above
 $\unicode[STIX]{x1D6FC}=26^{\circ }$
the DSV begins to convect downstream, shifting the location of peak suction. Accurate prediction of these events leading to the initial DSV location is important to predict the later time series of the forces in which the strength and position of the DSV is paramount. A similar observation of an extended time period of vortex amalgamation prior to downstream convection is included in Pruski & Bowersox (Reference Pruski and Bowersox2013). For the NACA 0012 airfoil at
 $Re_{c}=1.0\times 10^{6}$
, Pruski & Bowersox (Reference Pruski and Bowersox2013) discuss observations of a seemingly ‘suspended’ DSV that ‘forms and gathers strength’.
Span-averaged wall pressure coefficient as a function of
 $\unicode[STIX]{x1D6FC}$
at
 $x/c=0.3$
, 0.4 and 0.5 (a–c) showing suction peaks associated with the TSV and DSV structures.

The span-averaged wall pressure coefficient versus
 $\unicode[STIX]{x1D6FC}$
is plotted in figure 17 over the range
 $x/c=0.3{-}0.5$
. It is important to point out that the separate development of the TSV and the fact that it is pulled upstream creates a situation where single-point time histories of wall pressure are difficult to interpret. At
 $x/c=0.4$
pressure decreases in association with the development of the TSV. As described previously, this structure is pulled upstream by the LEV and merges to form the DSV. The pressure rises when the TSV moves upstream and then drops again as the DSV passes. The high temporal and spatial resolution of these computations allow for these two events to be fully characterised.
5 Conclusion
Wall-resolved large-eddy simulations of the unsteady boundary-layer dynamics leading to the onset of dynamic stall on a pitching NACA 0012 airfoil at
 $Re_{c}=1.0\times 10^{6}$
have been performed. The boundary-layer development prior to stall is characterised by a contracting LSB and upstream propagation of turbulent separation. Prior to the development of the LEV structure, turbulent separation covers over 95 % of the airfoil surface. At this point, leading-edge suction is still maintained by the streamline turning provided by the LSB. When the turbulent separation reaches the turbulent reattachment of the separation bubble, airfoil suction suddenly collapses resulting in the rapid generation of the LEV. This structure is small, with diameter of the order of the length of the separation bubble when it initially appears. During this process the turbulent separated shear layer breaks up into a series of vortical structures that coalesce into a single structure (the TSV). This second vortex structure is larger and more diffuse. A complex merging process then takes place where the LEV pulls the TSV upstream. These two structures eventually merge to form the well known DSV.
The generation of a small LEV structure due to turbulent-separation-induced bursting of a small LSB is a feature previously unconfirmed in the literature at these
 $Re_{c}$
. This is the cause for the rapid suction transient, visible in the wall pressure signals of Leishman (Reference Leishman1984, Reference Leishman1990) and is also likely the mechanism for vortex formation described in Carr et al. (Reference Carr, McAlister and McCroskey1977). At high
 $\unicode[STIX]{x1D6FC}$
it is expected that a small LSB may persist for
 $Re_{c}$
as high as
 $10^{7}$
suggesting that this is a robust stall mechanism. Further examination of the parameter study performed in Leishman (Reference Leishman1984) suggests that this behaviour is primarily a form of leading-edge stall unique to dynamic motions.
This stall process at
 $Re_{c}=1.0\times 10^{6}$
is contrasted against the stall processes at
 $Re_{c}=0.2{-}0.5\times 10^{6}$
where the DSV develops solely from pressure-gradient-induced bursting of the leading edge LSB. A comparison of all three
 $Re_{c}$
shows further upstream penetration of the reverse flow region as
 $Re_{c}$
is increased. This characterisation helps to explain the relatively strong sensitivity to
 $Re_{c}$
noted within this range in the literature. It also helps to explain the transition from ‘classical’ leading-edge stall at lower
 $Re_{c}$
to the abrupt leading-edge stall process described for
 $Re_{c}=1.0\times 10^{6}$
.
These complex interactions highlight the need for high-fidelity computations that fully resolve the boundary-layer physics leading to the onset of dynamic stall. Low-order models that predict airfoil forces must take into account these transitional and non-equilibrium events in order to accurately predict the rate and magnitude of force excursions associated with airfoil dynamic stall. Future work to study the sensitivity of this process to motion parameters, airfoil shape, compressibility effects and further increases in Reynolds number is necessary.
Acknowledgements
This work was sponsored in part by AFOSR under Task FA9550-17RQCOR393 monitored by Dr D. Smith and also by a grant of HPC time from the DoD HPC Shared Resource Centers at AFRL and ERDC. This research was performed while Dr S. Benton held an NRC Research Associateship award at AFRL. Special thanks to Dr D. Garmann of AFRL for assistance in operating FDL3DI.
Supplementary movie
Supplementary movie is available at https://doi.org/10.1017/jfm.2018.939.
Appendix A
This appendix reviews a systematic study of the sensitivity of the results described in the body to various aspects of the computational grid. Three grids of increasing resolution are evaluated both at the static initial condition as well as during the ramp-type pitching motion. Perturbations on the coarse grid including increased resolution in the spanwise direction as well as an extended spanwise domain size to
 $S/c=0.1$
(double) and
 $S/c=0.2$
(quadruple) are used to demonstrate the sensitivity of the results to these aspects of the grid system. For all results reported in the body of this document, the ‘fine’ grid with a spanwise extent of
 $S/c=0.05$
is used.
A.1 Grid resolution
The nested O-grid system of the fine grid is shown in figure 1. The dimensions of this four-block system are given in table 1 along with additional grid spacing values for important aspects of the grid specification. In table 1,
 $N_{U}$
refers to the number of points on the airfoil suction surface and
 $\unicode[STIX]{x0394}n$
refers to the initial wall-normal spacing.
 $\unicode[STIX]{x0394}s$
refers to the spacing along the airfoil suction surface. Points are clustered (
 $\unicode[STIX]{x0394}s_{min}$
) near the leading edge to properly resolve the LSB and the transition process. These requirements are slightly relaxed to
 $\unicode[STIX]{x0394}s_{max}$
as the turbulent boundary layer begins to grow. Grid spacing in the streamwise direction is considerably larger on the pressure surface due to the laminar boundary layer.
 $N_{i},N_{j}$
and
 $N_{k}$
refer to grid dimensions in the azimuthal, wall-normal and spanwise directions respectively, the fine grid is comprised of
 $267\times 10^{6}$
nodes.
Dimensions of the four-block O-grid system for the fine grid.

Using the same grid topology as the fine grid, ‘coarse’ and ‘medium’ grids are also developed. These grids total 94 and 174 million points, respectively. Perturbations of the coarse grid are also developed in which the spanwise resolution is increased to that of the fine grid (‘Coarse_ZR’), the spanwise domain is doubled (‘Coarse_S0.1’), or the spanwise domain is quadrupled (‘Coarse_S0.2’). The dimensions and grid spacing values for the inner, body-fitted, block within each these grid systems are given in table 2 to compare against the values used for the fine grid.
Dimensions of the body-fitted interior block of the auxiliary grids used to validate the fine grid in table 1.

Grid resolution in wall units evaluated at
 $\unicode[STIX]{x1D6FC}=8^{\circ }$
within the turbulent portion of the suction surface boundary layer.

Grid resolution in wall units evaluated at
 $x/c=0.025$
at the point in the pitching motion when turbulent separation is near
 $x/c=0.25$
. Values averaged over a centred time window with width
 $\unicode[STIX]{x0394}tU_{\infty }/c=0.1$
.

For the initial static solution at
 $\unicode[STIX]{x1D6FC}=8^{\circ }$
, average and maximum values of the wall resolution in wall units are presented in table 3. These values are on the lower end of the range typically put forward in the literature by Piomelli & Balaras (Reference Piomelli and Balaras2002) and Georgiadis, Rizzetta & Fureby (Reference Georgiadis, Rizzetta and Fureby2010), indicating sufficient resolution for a wall-resolved LES. Wall units at a higher
 $\unicode[STIX]{x1D6FC}$
are also presented in table 4. Due to the slight mismatch in the onset of dynamic stall for the grids evaluated here, time instances are chosen where turbulent separation has propagated from the trailing edge up to a location of
 $x/c=0.25$
. The grid resolution in wall units is evaluated downstream of the LSB reattachment point at
 $x/c=0.025$
. Values are from a span-averaged flow solution and are averaged in time over a centred window with a width of
 $\unicode[STIX]{x0394}t=0.1$
.
The drag coefficient for each grid with a spanwise domain of
 $S/c=0.05$
is shown in figure 18(a). It is shown that increased grid resolution results in a slightly earlier onset of the dynamic stall process. For each solution the qualitative aspects of the process are unchanged. Through the use of grid Coarse_ZR, it is shown that an increase in
 $z$
-resolution is a primary driver of this earlier onset. The close agreement between the Fine, Medium, and Coarse_ZR grids suggests convergence of the solutions.
Drag coefficient development comparing various grid resolutions (a) as well as spanwise domain size (b).

A.2 Spanwise domain size
Effects of spanwise extent on the ‘coarse’ grid. Top view of
 $Q$
-criterion iso-surfaces coloured by velocity magnitude (a), side views of entropy for reference (b) and spanwise averages pressure coefficient on the airfoil suction surface (c) at three instances in time covering the development of the DSV.

The use of a limited spanwise domain to minimise grid requirements is a common practice in large-eddy simulation of airfoil flows. Visbal & Garmann (Reference Visbal and Garmann2017, Reference Visbal and Garmann2018) compared this flow configuration with common wind-tunnel configurations (including a fixed end wall and various end-gap arrangements) and various spanwise domain lengths. It was shown that the spanwise-periodic simulation was able to accurately predict the onset of dynamic stall regardless of end effects or spanwise length (given proper simulation of the turbulent boundary layer prior to stall). The interactions between the dynamic stall vortex and the airfoil trailing-edge flow as well as the reattachment process (for a sinusoidal motion) were highly dependent on spanwise end effects and long-wavelength behaviours not captured in the truncated domain. At a similar high Reynolds number as the current study, Asada & Kawai (Reference Asada and Kawai2018) evaluated the use of grids with spanwise extent
 $S/c\leqslant 0.05$
. The adverse effects of too small of a span are noted primarily as an accentuated turbulent separation near the trailing edge, however given proper resolution, little difference was shown between the flow fields for
 $S/c=0.0243$
versus
 $S/c=0.0493$
indicating
 $S/c\geqslant 0.025$
is sufficient for these high Reynolds number flows.
A span study is performed here using the coarse grid in the form of a doubled (
 $S/c=0.10$
) and a quadrupled (
 $S/c=0.20$
) spanwise domain. The drag coefficient history is shown in figure 18(b) and is indistinguishable between the three domain sizes. Figure 19 shows the span-averaged pressure coefficient and top views of
 $Q$
-criterion for three time instances during the onset of dynamic stall. In each case, very little differences are noted between grids and the flow structure appears fairly spanwise homogeneous. For the purposes of the current study, with a focus on the interactions leading to the onset of dynamic stall, a spanwise extent of
 $S/c=0.05$
is deemed appropriate.



