





Since Xi Jinping 习近平 took office in November 2012, the Chinese regime has expanded its efforts to steer public expression of grievances away from contentious activism and towards state-run petition institutions (xinfang 信访).Footnote 1 Under Xi, the state has intensified repression of unsanctioned contention while simultaneously elevating the National Complaints and Proposal Administration to ministerial status, legally mandating officials to respond to citizen petitions, and deploying online appeal platforms more extensively than at any previous point in the history of the People’s Republic of China (PRC).Footnote 2
Despite this institutional expansion, systematic longitudinal evidence on how citizens and officials interact within petition institutions remains scarce. In particular, it is unclear whether – and if so, how – citizens have deepened their engagement with these institutions over time, for example by reporting a wider range of issues or appealing to a more diverse set of authorities. We also know little about how engagement with these institutions varies across socio-demographic groups.
Equally important, existing research offers limited evidence on whether government responsiveness within petition institutions has improved over time, especially when responsiveness is defined as substantive resolution of citizens’ problems. Understanding longitudinal trends in government resolution is important because, given the state’s active promotion of these institutions, failure to provide substantive assistance risks eroding public confidence in state commitments and, over time, institutional legitimacy. Without longitudinal evidence on both citizen participation and government responsiveness, it remains difficult to assess whether the regime’s investment in petition institutions has meaningfully reshaped citizen–state engagement or merely expanded appeal channels without improving outcomes.
To address these gaps, this research report presents decade-long, nationwide evidence of changes to citizen participation and government responsiveness within official petition institutions. We do so by systematically analysing the content, petitioner characteristics and official responses associated with more than four million citizen appeals submitted between 2011 and 2023, inclusive, to the Message Board for Leaders (Renminwang lingdao liuyanban 人民网领导留言板, MBL hereafter), China’s largest online petition platform. We find that over these 13 years, the platform recorded a twelvefold increase in petition volume and a fivefold increase in unique petitioners, driven largely by urban residents from economically developed eastern provinces. The scope of requests also broadened considerably, with the most rapid growth occurring in housing and property-related requests. At the same time, our results show that petitioners became more strategic, contacting a wider range of subnational authorities and increasingly directing their appeals to Party officials rather than their state counterparts. Finally, we find that this expansion of citizen participation was accompanied by greater government responsiveness. Between 2011 and 2023, the official response rate to MBL appeals rose from 50 per cent to 98 per cent, while the average response time declined from 176 days to 19 days. More importantly, the share of appeals receiving a substantive resolution nearly doubled, increasing from 17 per cent to 31 per cent.
Our findings contribute to the scholarship on public participation, e-governance institutions and state responsiveness in authoritarian regimes, much of which focuses on explaining the causes of government responsiveness.Footnote 3 We extend this literature by presenting a longitudinal perspective on online citizen engagement and official responsiveness, tracing the use of a major e-petition institution across Xi Jinping’s first 12 years in power. Although heightened repression has been a feature of Xi’s rule,Footnote 4 and prior research emphasizes that autocrats use petition institutions primarily to reinforce political control rather than serve the public,Footnote 5 our analysis suggests that over the past decade, these institutions have become more effective in resolving reported grievances while simultaneously attracting broader public engagement. Additionally, this study shows that the MBL dataset, which previously was primarily used for aggregate analysis of responsiveness, can inform longitudinal analyses of both citizen participation and state responsiveness, as well as facilitate research into how these longitudinal dynamics vary across issue areas and geographic regions. We highlight the additional opportunities that this dataset offers for qualitative and quantitative research on Chinese state–society relations in the conclusion.
Empirical Strategy
To understand the longitudinal trends in online appeals, we collected all citizen appeals and government responses published on the MBL from January 2011 up to and including January 2024. In total, we gathered 4,418,264 appeals and 3,724,987 responses.Footnote 6 The MBL was launched in 2008 by the official website of People’s Daily (People.cn, Renminwang 人民网). It aims to offer a national online portal for citizens to contact officials at provincial, prefectural and county levels.Footnote 7 Each of the subnational MBL platforms across China hosts two message boards: one for Party leaders and the other for government leaders. Individuals can post a variety of appeal types (complaints, enquiries and suggestions) to these message boards.Footnote 8Figure 1 shows a snapshot of the Beijing government’s MBL.
MBL Appeal Submission Portal to Beijing Officials

Several features of the MBL appealed to us as a primary data source. First, it has been in operation for over 17 years and covers all localities in China at and above the county level. This comprehensiveness provides the opportunity to compare patterns of public participation and government responsiveness across regions and over an extended period of time, a capability that local-level platforms are unable to provide. Second, since its creation, national media outlets have promoted the MBL as the primary portal for petitions, including by publishing notable petitions on the People.cn homepage daily.Footnote 9 Such exposure means that citizens across China are likely to be aware of the platform. Third, given that the MBL is administered by a central agency, local officials cannot selectively display or delete posts, as they often do on local-level platforms.Footnote 10 In their interviews with MBL staff, Junyan Jiang and colleagues found that the platform only blocks citizen requests if they contain explicit criticism of central government leaders, vulgar language or dissent directed at national-level policies.Footnote 11 These attributes – national publicity, comparability between localities and across time, and robustness to local interference – position the MBL as a primary data source capable of facilitating a macroscopic and largely complete picture of citizen–government online interactions across China. For additional data validation, see the online Appendix A.1.1.
We collected the full text and a rich set of metadata for each appeal submitted to the MBL, including submission time, issue area (as chosen by the petitioner), petitioner IP address, organization and official to which the appeal was submitted, and the official’s response text and response time (if any).
We use these data fields to assess the scale and depth of citizen engagement with the MBL, as well as the responsiveness of government. Specifically, we measure citizen engagement via petition volume, user geographies, topic diversity and petitioners’ strategy in whom they address to resolve their problems. We measure government responsiveness by how quickly the government responds, and whether those responses substantively resolved the reported issues. We detail these operationalizations in the next three sections.
Analysing petitioner geographies
Given the economic inequalities across provinces and between rural and urban areas in China, a Chinese citizen’s residential location is often strongly associated with their socio-economic status. As a result, assessing the geographic distribution of MBL petitioners can provide clues about which socio-economic strata engage most frequently with digital petition institutions, and how these strata may have changed over time.Footnote 12
To calculate petitioners’ locations, we used geographic information system (GIS) techniques to match each petitioner’s IP address to a specific county (xian 县) or district (qu 区).Footnote 13 Specifically, we used IP-to-location lookup tools to generate latitude and longitude estimates for all 512,767 unique IP addresses in the dataset.Footnote 14 We then placed these location coordinates inside a shapefile (a geospatial map showing the latitudes and longitudes for all Chinese administrative borders) to generate their corresponding administrative locations. Our method successfully linked 97.6 per cent of IP addresses to a Chinese county or district. Another 0.4 per cent of IPs pointed to locations outside of mainland China, and the remaining 2 per cent were from private networks or other de-identified IP addresses that did not generate location coordinates. For additional details, see online Appendix A.1.2.
In the second step, we coded the locations of those 97.6 per cent of petitioners whose IP addresses identified a specific county or district into two variables: a “rural” variable, indicating whether the petitioner lives in a rural locality,Footnote 15 and an “IP province” variable, indicating which province the petition emanated from. Previous studies have used these two geographical attributes as proxies for socio-economic status.Footnote 16 Compared to residents in rural areas (inland provinces), people living in urban areas (coastal provinces) are, on average, wealthier, better educated and have access to better social welfare.
Classifying appeal topics
We used a structural topic model (STM) – an unsupervised machine learning algorithm – and human validation to classify appeal topics. STM is widely used for text classification in social science research owing to its transparency, precision and replicability. Like most unsupervised topic models, estimating STM involves researcher discretion for some parameter values and hence demands human validation.Footnote 17
We followed three steps to implement STM on appeals. First, we randomly sampled 2 per cent of our data (87,895 citizen appeals) using stratified sampling by year. We only applied STM to this random subset because a larger sample would have been too computationally expensive for the algorithm to handle. Next, we selected the STM model size that produced the most coherent topic choices. To do so, we estimated a series of 46 STM models with an increasing number of topics, starting at five and continuing to 50. Among these 46 models, we selected the 11-topic model on the basis of semantic coherence and topic exclusivity.Footnote 18 Finally, for each of the 11 topics from the chosen model, two Chinese speakers independently selected a topic label based on the topic’s keywords and most representative appeals. The two coders agreed on labels for 9 out of the 11 topics. We also prompted a large language model (GPT-4o) to label the 11 topics by querying it with the same STM output that the human coders reviewed.Footnote 19 GPT agreed with each coder on 10 out of 11 topics; we used GPT’s labels for the two topics on which the coders disagreed. Table 1 shows the final labels of the 11 appeal topics.
Appeal Topics from STM

Table 1 Long description
The table lists eleven appeal topics and assigns each a numeric label from one to eleven. Transportation is labeled one and Education is labeled two. Employment and Wages is three, followed by Government Corruption at four and Pollution at five. Utilities is six and Healthcare and COVID-19 is seven. Property Management and Property Development are labeled eight and nine, with Rural Development at ten. Civil Service Exams is labeled eleven. The numbers function as identifiers rather than indicating frequency, ranking, or importance.
We conducted a variety of tests to assess the validity of these algorithm-generated topic clusters. First, we measured the stability of our preferred model (K=11) by re-estimating it ten times with the same parameters and different random initializations. Results suggest that the model’s stability is moderately strong, with the average correlation of topic proportions being 0.5 (on a scale of -1 to 1) across runs. Second, to assess whether STM-generated topics adequately reflect appeal content, we conducted three validation tests – word intrusion, word set intrusion and topic intrusion – for our chosen model (K=11) and three alternative models (K=20, 30, 50).Footnote 20 Across the three tests, the chosen model’s performance exceeds all tested alternatives as well as the benchmarks suggested in the literature,Footnote 21 indicating that it assigns the most accurate topics to appeals among the tested models. Additionally, we asked two experts on Chinese citizen appeals to develop their ideal topic categories without reference to the STM results. These expert-derived topics largely align with the STM-generated topics, and indeed, they overlap on nine of the 11 topics in Table 1. For additional details of model validation, see online Appendix A.2.
It is important to note that these tests should not be interpreted as evidence that the machine-generated topics in Table 1 are objective or uniquely correct. To create topic proportions, STM assumes that all documents are generated from a fixed distribution of “latent” topics, an assumption which, while useful for researchers, is an oversimplification of the text generation process. In addition, the results of STM, like other unsupervised models, depend on random initializations and researcher-set model parameters, which inevitably reflect some degree of researcher discretion and randomness. Therefore, we encourage readers to treat these algorithmically generated results as a useful high-level summary but to interpret them with caution.
Assessing government responsiveness
We define government responsiveness as the timely and substantive resolution of a citizen’s appeal. We measured timeliness using the hours elapsed from request submission to government response. To assess substantiveness, we combined human annotation with supervised machine learning to independently evaluate whether each official reply resolved the reported issue.Footnote 22 First, we asked two Chinese native speakers to independently code a random sample of 1,760 petition–response pairs, labelling whether the issue reported by each petitioner had been resolved. We define a petition as “resolved” if the responding official explicitly describes how they delivered the goods and/or services requested by the petitioner, penalized the actor responsible or halted the reported behaviour; otherwise, the petition is coded as “unresolved” (see online Appendix A.3 for the full coding rubric and example responses). The inter-coder agreement for this sample was 86 per cent.
We then trained and validated a deep learning classifier (Chinese DeBERTa with Whole Word Masking) to extend this human coding to the entire dataset. The model was trained on 74 per cent of the human-annotated sample and evaluated on the remaining 26 per cent, achieving an acceptable F1 score of 0.76 in reproducing human coding decisions. We then applied this classifier to the remaining unlabelled petition–response pairs (over 3.7 million) to code whether the responses resolve the reported issues.
Results
We find that over the studied time period, the Chinese public substantially increased its engagement with the state-sanctioned MBL petition forum, as evidenced by rising volumes of petitions and petitioners, greater diversity of appeals and the more strategic selection of petitioned officials. Alongside this surge in citizen participation, we find that local authorities also become more responsive.
Petition and user volumes increase
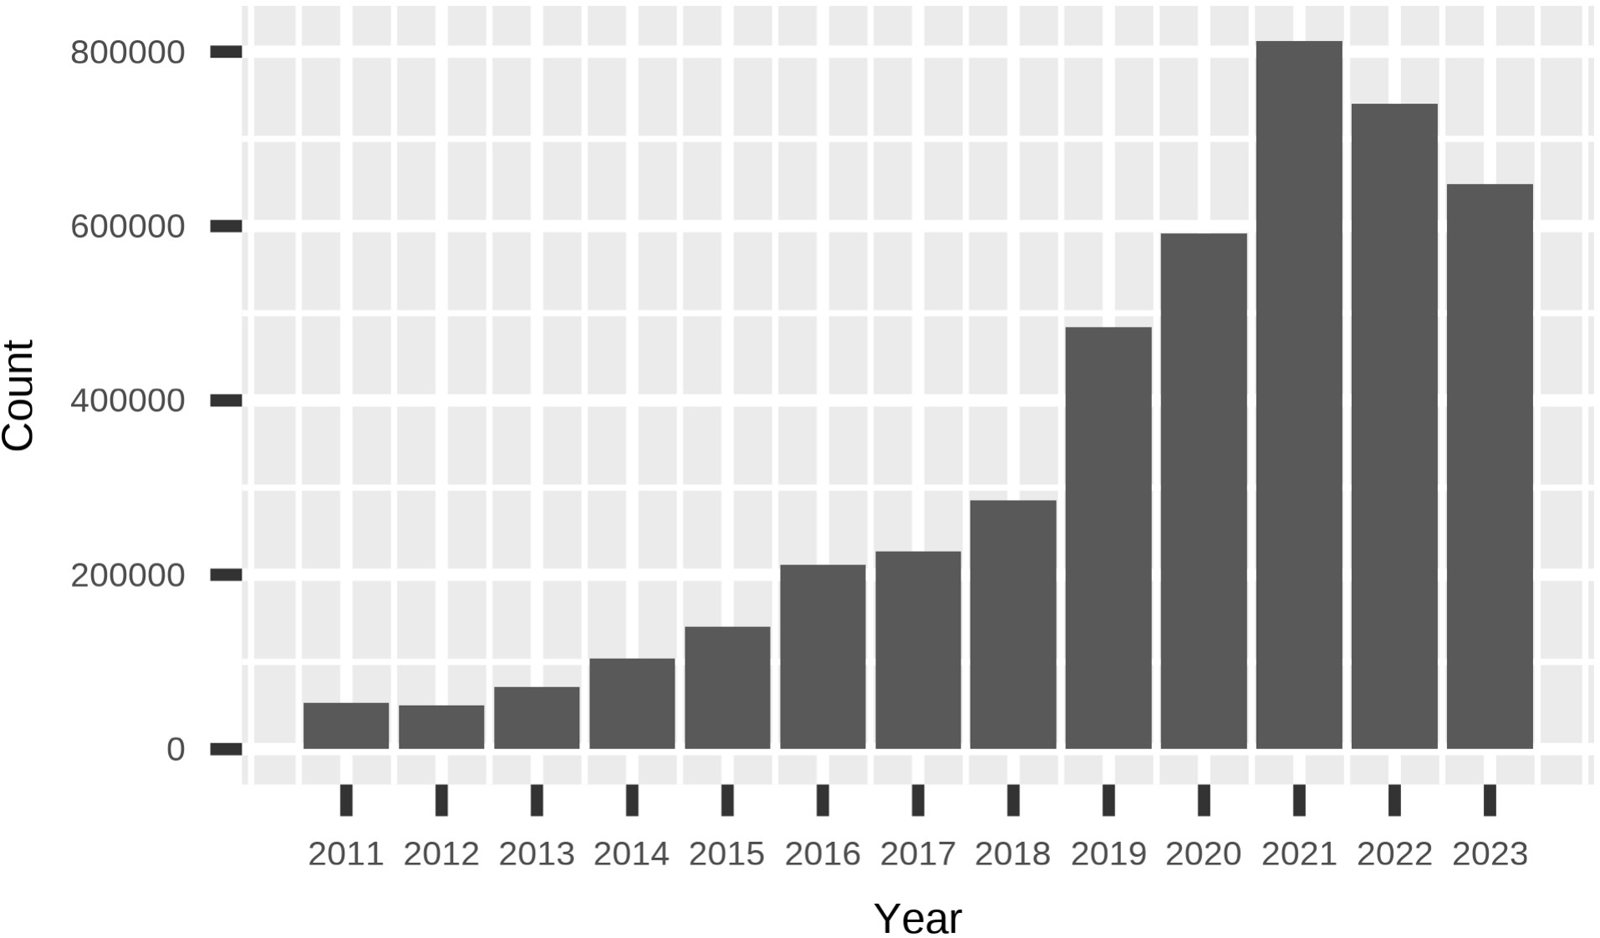
The number of petitions lodged on the MBL grew from 52,750 appeals in 2011 to 653,498 appeals in 2023. Figure 2 shows that the number of appeals steadily increased from 2011, peaking at 812,232 posts in 2021. The drastic growth between 2020 and 2021 may reflect heightened citizen grievances and reduced participation options, particularly offline activities, during the COVID-19 pandemic and government lockdowns. Meanwhile, the small dip in 2022 and 2023 may be related to the MBL’s August 2022 requirement that all users register their national ID number before lodging a new petition.Footnote 23 Petition volumes increased across all 31 provinces between 2011 and 2023, with the smallest growth occurring in Hunan (2.2 times larger) and the largest in Yunnan (39 times larger). Henan remained the top source of appeals throughout these 13 years.
Number of Petitions by Year, 2011–2023

We find that this rise in petitions occurs alongside an expansion of users on the platform. Figure 3 presents the number of unique IP addresses submitting requests to the MBL by year. Over Xi’s first two terms (2012–2022), the number of unique user IP addresses proliferated, from 34,387 to 203,911 (4.9 times larger). This growth rate far outpaces the growth of internet penetration (19 per cent) and national population (4.4 per cent) over the same period.Footnote 24 Moreover, the number of unique users on the MBL is probably even more substantial than the number of IP addresses, as a single IP can serve thousands of users on shared networks.Footnote 25 We emphasize, however, that rising numbers of users and petitions do not by themselves signal greater institutional efficacy or robustness. Rather, we interpret these trends as evidence of increased citizen engagement with online petition institutions.
Number of User IP Addresses on MBL by Year

Who has driven the growth in MBL users over the past decade? We find that new users are predominantly urban residents from eastern provinces. Figure 4 shows the percentage of appeals emanating from rural counties by year.Footnote 26 Until 2014, nearly 50 per cent of appeals originated from rural areas. This percentage, however, dropped to less than 40 per cent during Xi’s second five-year term. Figure 5 presents the yearly volume of petitions by eastern, central and western provinces (left panel), as well as petition growth by province between 2012 and 2023 (right panel). The results show that in the first five years of Xi’s rule, petition growth remained relatively even across east, central and west China. Starting in 2020, however, petition growth in the east accelerated, rising to 46 per cent of all appeals in 2023. Consistent with this trend, the right panel shows that eastern provinces witnessed faster petition growth than the national growth rate over the past decade.
Share of Appeals Emanating from Rural Counties (Based on IP Address)

Petition Volume by Region (left) and Petition Growth by Province (right), 2012–2023

Figure 5 Long description
Insufficient visual information to describe this element accurately.
The increase in the number of eastern users posting on the MBL is unlikely to be driven by migrants originating from inland provinces and working in eastern cities. Figure 6 shows the percentage of petitions sent from a user IP in eastern provinces to an official in western or central provinces – and vice versa – by year. We interpret that these cross-region appeals are likely to have been submitted by migrants either petitioning their hometown governments (east-to-west) or the governments in their workplaces (west-to-east).Footnote 27 Between 2016 and 2023, the combined share of these cross-region appeals declined, from 27.5 per cent to 13.5 per cent. Since the early 2000s, the growth of the migrant population has been accompanied by a dramatic rise in social contention.Footnote 28 Our results imply that starting from Xi’s second term, migrants to the more developed east appear to have decreased engagement with online petition institutions relative to other population groups, even as overall platform participation continued to expand.
Share of Appeals Sent Between Eastern Provinces and Western/Central Provinces

Appeal topics grow more diverse
Beyond volume increases, we find that Chinese citizens submitted petitions on an increasingly diverse range of topics to the MBL. Figure 7 presents the percentage of appeal topics by year, based on the structural topic model. Results show that in 2011, rural development issues, such as land disputes and resettlement, dominated the platform, accounting for over 25 per cent of all appeals. Since 2019, however, no single topic has occupied more than 15 per cent of appeals, and rural issues dropped to only 9 per cent of appeals in 2023.
Percentage of Appeals by Topic by Year

Figure 7 Long description
The multi-line graph displays the percent of complaints from 2011 to 2023. The x-axis represents the year, ranging from 2011 to 2023 and the y-axis represents the percent of complaints, ranging from 0 to 25 percent. The graph includes lines for different topics: employment and wages, property management, property development, rural development and other. The rural development line starts at 25 percent in 2011 and declines steadily to 9 percent by 2023. Property management and property development lines show an increase, crossing each other around 2020, with property management peaking at approximately 12 percent in 2023. Employment and wages show a gradual increase, reaching around 10 percent by 2023. The ′other′ category remains relatively stable throughout the years. The graph highlights the shift in complaint topics over time, with rural development decreasing significantly while other topics gain prominence.
The decline in rural issues accompanies a rise in urban topics and, in particular, real estate petitions. Tables 2 and 3 present the top five appeal topics in 2011 and 2023, respectively. The tables show that the new top topics in 2023 concerned typical urban problems: property development (maifang jiufen 买房纠纷), property management (wuye jiufen 物业纠纷) and employment and wages (zhichang he gongzi jiufen 职场和工资纠纷). The first two issues, related to housing, experienced the fastest growth over the past decade compared to other topics. We also observe these trends – rising numbers of urban and real estate appeals – when examining petitioners’ self-reported topics (see online Appendix A.1.3).
Top Five Topics, 2011

Table 2 Long description
The table lists the top five topics and their shares as percentages. Rural development is highest at 25.57 percent, making it the clear leading topic. Transportation is second at 13.97 percent, and pollution is close behind at 11.99 percent. Government corruption accounts for 8.95 percent, and utilities is lowest among the five at 7.70 percent. Overall, the leading topic has a much larger share than the remaining topics, which cluster in the high single digits to mid teens. Percentages are presented without additional details on the source or whether categories overlap, so totals beyond these five topics are not shown.
Top Five Topics, 2023

Table 3 Long description
The table lists five topics and their percentages for the year 2023. Transportation has the largest share at 13.72 percent. Employment and wages follows at 12.62 percent, and property management is close behind at 12.12 percent. Pollution is next at 11.27 percent. Property development is the smallest of the five at 9.95 percent. The spread from highest to lowest is under four percentage points, indicating the top topics are fairly evenly distributed. Percentages are shown only for these five topics, so they may not represent the full set of topics.
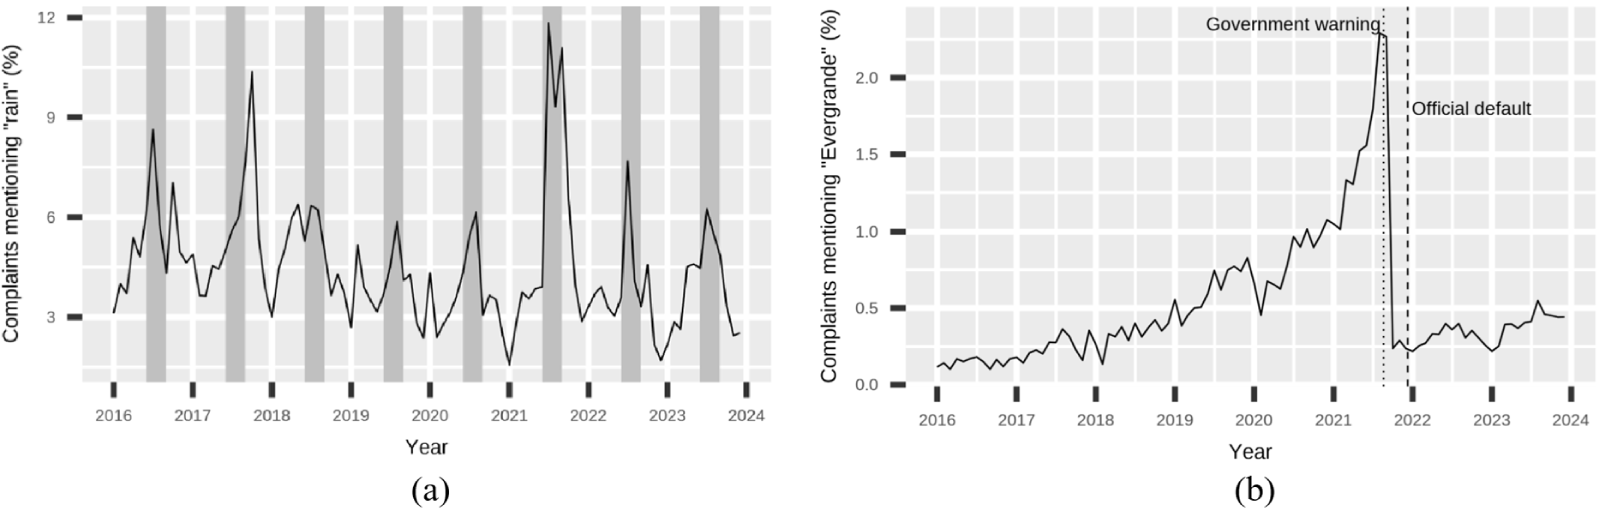
Additionally, from 2011 to 2023, citizens consistently raised some of China’s most contentious socio-economic issues on the MBL. Figure 8 presents two examples. The left-hand panel shows the share of petitions in Henan mentioning the word “rain” by year, with summer months shaded. Climate change and poorly designed cities have resulted in destructive flooding occurring in Henan every summer, which manifests on the MBL as annual summer spikes in flood petitions. The right-hand panel shows the share of appeals mentioning “Evergrande” (hengda 恒大), a real estate giant whose 2021 default roiled the country, leaving millions of people homeless, jobless and in debt. There was a surge in petitions lodged against Evergrande on the MBL in the early months of 2021 when rumours of its financial problems emerged. In August 2021, when the Central Bank issued an official warning to the firm, Evergrande accounted for almost one in every 50 petitions on the platform.Footnote 29 The sharp decline afterwards likely indicates government censorship on the topic. Nevertheless, an ongoing trickle of petitions in 2022 and 2023 shows that even censorship did not deter all citizens from continuing to lodge petitions against the firm. These findings suggest that while citizens petition on the MBL about an increasingly diverse range of issues, these issues are consistently salient problems from everyday life.
Citizens Use MBL to Seek Redress on Issues Salient to their Well-being. (a) Flooding petitions in Henan by year. (b) Petitions about Evergrande by year

Figure 8 Long description
The composite image contains two line graphs placed side by side. The first is labeled Flooding petitions in Henan by year. The x-axis represents years from 2011 to 2023. The y-axis represents the share of petitions mentioning a flood-related term, shown as a percentage. Vertical shaded bands appear at regular intervals across the graph, marking summer months each year. The line shows recurring annual spikes during the shaded summer periods throughout the entire range. Approximate peak values during summer spikes reach between 1.5 percent and 3 percent, while values during non-summer periods fall close to 0 percent. The pattern repeats each year from 2011 through 2023, with spikes of similar magnitude across years. The second graph is labeled Petitions about Evergrande by year. The x-axis represents years from 2020 to 2023. The y-axis represents the share of petitions mentioning Evergrande, shown as a percentage. Two vertical dashed lines are visible and labeled. The first is labeled Government warning and the second is labeled Official default. The line remains near 0 percent from 2020 through early 2021. A sharp rise begins in early 2021, reaching a peak of approximately 2 percent near the Government warning marker. Following the Official default marker, the line drops sharply back toward 0 percent. A small but visible trickle of values above 0 percent continues through 2022 and 2023. The first graph shows a recurring seasonal pattern with repeated spikes, while the second graph shows a single concentrated surge followed by a sharp decline.
Appeal to more diverse and powerful officials
Evidence further suggests that Chinese citizens have become more strategic in choosing whom to petition, both by addressing appeals to more administrative levels and, within each level, increasingly directing their appeals to Party rather than state officials. Figure 9 plots the share of appeals sent to provincial, prefectural and county-level officials by year. In 2011, more than half of the appeals on the MBL were directed to prefecture-level officials. By 2023, however, this percentage had declined to 42 per cent, whereas appeals to county-level officials rose to 35 per cent and appeals to provincial officials increased to 23 per cent, indicating a broader diversification of petition addressees over time.
Percentage of Appeals Addressed to Different Government Levels by Year

Figure 9 Long description
The image contains a line graph labeled Figure 9: Percent of appeals addressed to different government levels, by year. The x-axis represents the Year from 2011 to 2023. The y-axis represents the Percent of Complaints, ranging from roughly 15 to slightly above 50. A legend on the right identifies three addressee levels: Province (solid line), Prefecture (dotted line), and County/District (dashed line). The Prefecture dotted line begins at its highest point near 51 percent in 2011, experiences a gradual downward trend to roughly 39 percent in 2019, and slightly recovers to about 42 percent by 2023. The County/District dashed line starts near 31 percent in 2011, rises steadily to a peak of approximately 45 percent in 2016, drops sharply to 30 percent in 2018, and then fluctuates, ending near 35 percent in 2023. The Province solid line remains the lowest category from 2011 to 2016, hovering between 15 and 18 percent. It then spikes sharply to intersect the County/District line at 30 percent in 2018, before dropping and fluctuating between 18 and 23 percent through 2023. Overall, the graph shows that while the prefecture level historically received the highest share of complaints, the distribution across the three levels has narrowed and fluctuated significantly since 2016.
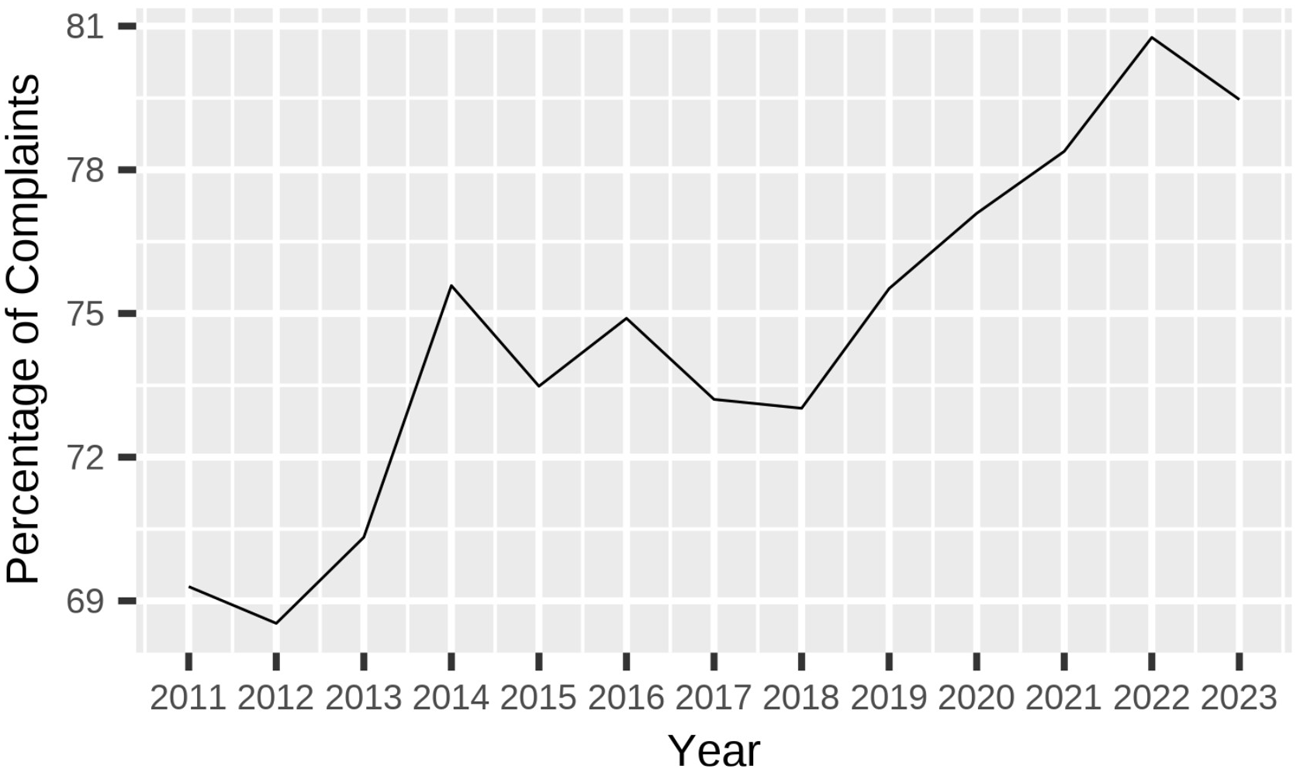
Citizens have also increasingly appealed to Party secretaries, who hold greater authority than their state counterparts in the PRC’s political hierarchy. Figure 10 shows the percentage of citizen appeals submitted to Party secretaries by year. Results show that since Xi Jinping took office, this percentage has grown from 70 per cent to 80 per cent on the MBL, with the increase accelerating after 2018 when Xi amended the country’s constitution to remove presidential term limits.
Percent of Appeals Addressed to Party Secretaries by Year

Figure 10 Long description
The image contains a line graph labeled Figure 10: Percent of appeals addressed to Party secretaries by year. The x-axis represents the Year from 2011 to 2023. The y-axis represents the Percentage of Complaints, ranging from roughly 68 to 81. The solid line begins near 69.5 percent in 2011 and dips slightly to its lowest point of approximately 68.5 percent in 2012. It then rises sharply to a local peak of about 75.5 percent in 2014. From 2014 to 2018, the line experiences moderate fluctuations, dipping to 73.5 percent in 2015, rising briefly in 2016, and gradually declining to roughly 73 percent by 2018. Following 2018, the line demonstrates a strong and steady upward climb, reaching its highest overall peak just below 81 percent in 2022. The line concludes with a slight decline to approximately 79.5 percent in 2023. Overall, the graph demonstrates a significant, long-term increase in the proportion of citizen complaints directed specifically toward Party secretaries over the 13-year period
Government responses become faster and more substantive
Finally, our results show that the increased citizen usage of the MBL in petition volume, diversity and strategy was accompanied by improved state responsiveness. Figure 11 presents the response rate and resolution rate (left plot), and average elapsed days before response (right plot) by year. In 2011, 50 per cent of the appeals submitted on the MBL received an official response, while only 17 per cent of appeals received a substantive resolution. These figures increased substantially to 98 per cent and 31 per cent, respectively, in 2023. The response time of officials also improved, from an average of 176 days (6 months) in 2011 to 19 days in 2023. Importantly, the substantive resolution rate nearly doubled (from 17 per cent to 31 per cent) over these 13 years, and resolution rates increased across all types of submissions to the platform, including complaints (tousu 投诉), enquiries (zixun 咨询) and suggestions (jianyan 建言).Footnote 30
Government Response/Resolution Rates (left panel) and Average Response Time (right panel)

Figure 11 Long description
The composite image contains two line graphs placed side by side, labeled Figure 11. The left graph illustrates government response rate and resolution rate. The x-axis represents years from 2011 to 2023. The y-axis represents the percent of appeals, ranging from 0 to 100. A legend identifies the Response Rate (solid line) and the Resolved Rate (dashed line). The solid Response Rate line starts at exactly 50 percent in 2011 and exhibits a strong, continuous upward trend, experiencing only a minor dip around 2019 before climbing to nearly 100 percent in 2023. The dashed Resolved Rate line starts much lower, near 17 percent in 2011, rises gently to a peak of approximately 30 percent in 2017, dips slightly to roughly 25 percent around 2020, and ends near 31 percent in 2023. The right graph illustrates the average wait time before response. The x-axis represents years from 2011 to 2023. The y-axis represents Days Until Response, ranging from 0 to over 150. A legend identifies the Elapsed Time (solid line). This line begins at a very high point of approximately 175 days in 2011. It drops precipitously to about 50 days by 2014, followed by a more gradual decline. After a brief, small upward bump to roughly 35 days in 2020, the line continues to fall, reaching its lowest point near 15 days in 2023. Overall, the composite image demonstrates that the likelihood and speed of government responses have improved drastically over the 13-year period; meanwhile, the actual resolution rate of complaints has nearly doubled from 17 percent to 31 percent, though it remains substantially lower than the total response rate.
One potential concern is that the observed increase in substantive resolution reflects official data fabrication rather than genuine improvements in responsiveness. For example, local governments or the MBL platform could selectively report resolved petitions, misrepresent case outcomes or generate spurious petitions that are subsequently claimed as “resolved.” While such possibilities cannot be entirely ruled out, our calculations suggest that fabrication sufficient to account for the observed trend would need to occur at a very large scale and involve sustained, cross-provincial coordination over multiple years. We also observe no abrupt spikes or discontinuities in year-to-year resolution rates that would indicate episodic manipulation. Section A.5.4 of the online Appendix provides detailed calculations and additional evidence addressing this concern.
Government resolution rates improved across all appeal topics between 2011 and 2023, although the magnitude of improvement varies considerably by issue area. Figure 12 presents yearly resolution rates by appeal topic. Over the past decade, appeals concerning civil service examsFootnote 31 and rural development were the most likely to receive a substantive resolution; these two topics also experienced the fastest growth in resolution rates. By contrast, real estate-related petitions, including property development and property management, were the least likely to be resolved and witnessed the slowest improvement over time. In 2022, nearly 50 per cent of civil service exam appeals were resolved, compared to only 14 per cent of property development appeals. Results further indicate that property-related petitions faced particularly low chances of substantive redress during crisis periods. In 2021, when Evergrande’s debt default unfolded, only 12 per cent of petitions mentioning the company received a resolution, which was less than half the resolution rate of all petitions (26.5 per cent) in that year.
Official Resolution Rates by Appeal Topic

Figure 12 Long description
Percent resolved Legend: Civil Service Exams Rural Development Property Development Property Management Other Line identification by style: Civil Service Exams is a dashed line. Rural Development is a solid line. Property Development is a solid line. Property Management is a solid line. Other is shown as multiple thin lines. Horizontal axis label: Year Horizontal axis range: 2011 to 2023 Vertical axis label: Percent resolved Vertical axis range: 10 to 50 Data points as coordinate pairs: Civil Service Exams: (2011, 20), (2012, 25), (2013, 30), (2014, 28), (2015, 33), (2016, 36), (2017, 38), (2018, 37), (2019, 38), (2020, 40), (2021, 45), (2022, 48), (2023, 55) Rural Development: (2011, 18), (2012, 22), (2013, 28), (2014, 27), (2015, 32), (2016, 35), (2017, 40), (2018, 36), (2019, 35), (2020, 36), (2021, 36), (2022, 37), (2023, 42) Property Development: (2011, 12), (2012, 10), (2013, 18), (2014, 18), (2015, 15), (2016, 18), (2017, 19), (2018, 17), (2019, 15), (2020, 14), (2021, 14), (2022, 15), (2023, 18) Property Management: (2011, 10), (2012, 15), (2013, 12), (2014, 12), (2015, 18), (2016, 19), (2017, 19), (2018, 18), (2019, 16), (2020, 14), (2021, 14), (2022, 15), (2023, 22) Other: (2011, 15), (2012, 18), (2013, 20), (2014, 22), (2015, 24), (2016, 26), (2017, 28), (2018, 26), (2019, 25), (2020, 26), (2021, 27), (2022, 28), (2023, 33) Notable values and comparisons using the listed points: Civil Service Exams lowest value is 20 at 2011 and highest value is 55 at 2023. Rural Development lowest value is 18 at 2011 and highest value is 42 at 2023. Property Development lowest value is 10 at 2012 and highest value is 19 at 2017. Property Management lowest value is 10 at 2011 and highest value is 22 at 2023. Other lowest value is 15 at 2011 and highest value is 33 at 2023. Year-by-year direction changes visible in the listed points: Civil Service Exams decreases from 30 at 2013 to 28 at 2014, then increases to 38 at 2017, decreases to 37 at 2018, then increases to 55 at 2023. Rural Development decreases from 28 at 2013 to 27 at 2014, increases to 40 at 2017, decreases to 35 at 2019, then increases to 42 at 2023. Property Development increases from 10 at 2012 to 18 at 2013, stays at 18 at 2014, decreases to 15 at 2015, increases to 19 at 2017, decreases to 14 at 2020 and stays at 14 at 2021, then increases to 18 at 2023. Property Management increases from 10 at 2011 to 15 at 2012, decreases to 12 at 2013 and stays at 12 at 2014, increases to 19 at 2016 and stays at 19 at 2017, decreases to 14 at 2020 and stays at 14 at 2021, then increases to 22 at 2023. Other increases from 15 at 2011 to 28 at 2017, decreases to 25 at 2019, then increases to 33 at 2023.
Additionally, we examined the likelihood of receiving any government response (regardless of resolution) by topic as well as response speed. Both improved across all issue areas between 2011 and 2023. Unlike the considerable variation in substantive resolution rates, improvements in response rates and speed were relatively uniform across appeal topics (see online Appendix A.5.2).
Government responsiveness also increased across all 31 provinces, both in substantive resolution rates and in response speed. Between 2011 and 2023, eastern provinces experienced the largest increase in resolution rates, from 9.4 per cent to 32 per cent, and shifted from being the least responsive region to the most responsive relative to the rest of the country (see online Appendix A.5.3 for details). Together, these results indicate that between 2011 and 2023, local officials became more effective in addressing citizen grievances through online petition institutions, although improvements were uneven across issue areas.
Conclusion
The Xi Jinping administration’s intensified efforts to channel public grievances towards state-run petition institutions have prompted scholars of China to reconsider how citizens express grievances and how officials respond over time.Footnote 32 This research report provides evidence that Chinese citizens have expanded their use of online petition institutions and that local governments have become more responsive, including by substantively resolving a larger share of appeals. Between 2011 and 2023, submissions to the country’s largest e-petition portal increased twelvefold, while the number of petitioners grew fivefold. New users were disproportionately urban residents in the east, and citizens raised increasingly diverse issues, with the most rapid growth occurring in property-related grievances. Petitioners also became more strategic over time, contacting more government levels and directing more appeals to Party secretaries. Meanwhile, local governments reduced their average response time by 90 per cent and nearly doubled their resolution rate, from 17 per cent to 31 per cent over these 13 years.
These findings reveal substantial increases in both citizen engagement and state responsiveness within China’s e-governance institutions, suggesting that such institutions provide fertile ground for future research on state–society relations. We identify three promising directions. First, future work could utilize the MBL dataset to examine what drives regional variation in platform usage, such as the greater adoption in eastern provinces, as shown in our results. We posit three possibilities: regional differences in socio-economic development, residents’ political orientations and local government strategy.
Second, future studies could develop more nuanced assessments of response quality (for example, assessing whether the government’s resolution is sustainable) and investigate the predictors of helpful replies. These include how user demographics, political attitudes and petition strategies shape the likelihood of obtaining substantive redress. Relatedly, the longitudinal data on the MBL can facilitate research into how government (non)responsiveness shapes petitioners’ subsequent participation.Footnote 33 When officials resolve a reported issue, does that encourage citizens to raise more sensitive concerns? When officials fail to solve problems, do citizens disengage? Answers to these questions would illuminate the long-term implications of petition institutions.
Finally, future work could assess whether the increased participation and responsiveness observed on the MBL generalize to other petition institutions. China now maintains an extensive ecosystem of online and offline petition channels, managed by different administrative levels and functional departments. Yet systematic evidence on how these institutions interact remains limited. On the one hand, these venues may complement one another, enabling citizens to make claims through multiple channels. On the other hand, they may compete, leading different social groups to select different institutions. Future study could examine how citizens choose from among these channels and whether the platforms they use influence the chance of official resolution. Together, these lines of inquiry would clarify how citizens navigate China’s evolving petition system and shed light on the broader mechanisms through which authoritarian regimes manage public grievances.
Supplementary material
The supplementary material for this article can be found at https://doi.org/10.1017/S0305741026102550 (also at https://tongtongzhang.com).
Acknowledgements
Both authors contributed equally and are listed in alphabetical order. For helpful comments and suggestions, the authors thank participants at APSA 2024 Chinese Politics Mini-Conference and the Virtual Political Science Speaker Series on China. We also thank Ji Feng and Melody Wang for excellent research assistance. The School of Public Affairs at American University, Stanford Data Science (SDS), Stanford Center on China’s Economy and Institutions (SCCEI) and Stanford Institute for Human-Centered AI (HAI) provided funding and research support.
Competing interests
None.
Matt DEBUTTS is a PhD candidate in the department of communication at Stanford University. His research uses computational methods to study media and political communication, and his work has appeared in the Journal of Communication, Social Media+ Society and EMNLP Findings.
Tongtong ZHANG is an assistant professor in the department of government at American University. She studies Chinese politics, government responsiveness and transnational authoritarian repression using quantitative and qualitative methods. Her work has appeared in Comparative Political Studies, Perspectives on Politics and Political Science Research and Methods.







 Open access

