


Introduction
In this paper we investigate the possibility of extracting a common annual signal from combined chemistry and isotopic records from central Greenland ice cores. Records from Site D(Reference SteffensenSteffensen,1988) and the North Greenland Icecore Project (NorthGRIP) (Reference Dahl-JensenDahl-Jensen and others, 2002) are analyzed. the objective is to extract a signal that exhibits a more pronounced annual variation than can be found directly in the measured records. the extracted signal can be used as the basis for, for example, automated counting of annual layers in ice-core records.
The method introduced here is based upon the assumption that the measured records can be considered to be linear combinations of a set of underlying source signals. the method allows us to determine the source signals from the measured records if their autocorrelation functions are different. the extracted source signals may reflect variations in physical parameters such as temperature, but they may also be purely mathematical constructions. from an ice-core dating point of view, even the latter could be useful if the obtained signal shows pronounced annual variation.
Treating Ice-Core Records As Time Series
Most ice-core records are sampled at constant depth intervals. If precipitation is unevenly distributed in time, ice-core records are equivalent to time series sampled at varying (and unknown) time intervals. Firnification processes, thinning of annual layers due to ice flow, and changes in the amount of precipitation during different climatic periods will lead to further changes in the sampling rate with depth.
In this work, we use data series each spanning only around 20 years, corresponding to <10m. Within each period, we may assume the overall climatic situation to be unchanged, and thus that the annual precipitation does not undergo large changes. Firnification processes and thinning of annual layers may also be disregarded when using short series at these depths. It will be assumed that the precipitation is relatively evenly distributed throughout the year, which is supported by investigations by, for example, Reference Shuman, Alley, Anandakrishnan, White, Grootes and StearnsShuman and others (1995). Adding up these assumptions, we will consider the measured records to be sampled at approximately constant time intervals, thus treating the ``depth series’’ as ordinary time series.
When analyzing longer data series, one should account for firnification in the upper layers and the thinning of annual layers due to ice flow. Also, when analyzing data from periods with changing precipitation patterns and rates, special care should be taken.
Dynamical Decorrelation
We assume that the measured data series (the rows of a N × T matrix X) are formed by a linear combination of an unknown set of underlying source signals S (also N × T) as X = AS, where the N × N matrix A is called the mixing matrix. A common approach is to assume that the source signals form an orthogonal set and to arrange the series in the set with decreasing variance. This approach is known as principal component analysis (PCA) and is widely used in time-series analysis.
However, the assumption of orthogonality of the source signals is not necessarily viable, and some other assumption about the source signals must be chosen. Methods that assume statistically independent source signals are known as independent component analysis (ICA), but the assumption of independence of the source signals does not alone contain enough information to determine S uniquely. Many choices of additional assumptions can be made (for a short summary, see, e.g., Reference HyvärinenHyvärinen,1999), but here the method of Reference Molgedey and SchusterMolgedey and Schuster (1994), further developed by Reference Hansen, Larsen, Kolenda, Guan, Kung and LarsenHansen and others (2000), will be applied. Only a brief overview will be given here, and only the formalistic simple version of infinitely long series is considered. When performing the analysis on real finite data series, a number of mathematical technicalities must be considered, but the basic idea remains the same.
When performing PCA and most versions of ICA, no temporal information from the data is used; the data could be sampled at random times or be without temporal structure at all. In our case with ice-core records, the source signals are expected to be, for example, the annual signal, other (quasi-) periodic signals, and noise. These signals have very different periods and there by autocorrelation functions, and the idea of Molgedey and Schuster is to make use of this fact. Given a linear mixture of the source signals, the method is able to separate the source signals by only assuming that one can choose a time lag τ, for which the values of the autocorrelation functions of the different source signals are clearly distinct.
Methodology
The correlation function between two infinitely long normalized discrete signals xi,t and xj;t, t ϵ N, can be defined as  The correlation functions are all collected in the correlation matrix
 which for τ = 0 is the cross-correlation matrix. We now define the quotient matrix
 C X(0)–1. Using the basic assumption that
 we obtain
 where Cs is the correlation matrix for the source signals, and conclude that
 The fact that the source signals were assumed to be independent results in Cs(τ) being diagonal, such that the quotient matrix is given as
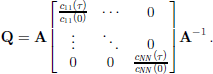
This closely resembles an eigenvalue decomposition of Q, and thus A (and thereby S) can be computed by diagonalizing Q, which itself can be readily calculated from the measured data. A is uniquely determined as long as the diagonal in the above equation consists of significantly different values. This means that if a choice of τ exists where the autocorrelation functions of the source signals are significantly different, the source signals can be uniquely determined. There is, however, no way of choosing τ a priori, and one has to find a suitable value by trial and error. A number of technical and numerical details must be taken into consideration. for a thorough discussion of these, and a proof of the fact that Q always has a real-valued eigenvalue decomposition, see Reference Hansen, Larsen, Kolenda, Guan, Kung and LarsenHansen and others (2000).
Performing Dynamical Decorrelation
A suitable set of data series from the same depth interval must be available for the analysis. Only series that are expected to contain the annual signal should be included. for evaluation purposes, we have chosen two different data sets which have been dated by annual-layer counting. This dating has been verified with the help of known historical markers (Reference Hammer, Clausen, Dansgaard, Gundestrup, Johnsen and ReehHammer and others, 1978).
For Site D the concentrations of Cl–, NO3 – and SO4 2– and dust mass have been measured at 5 cm resolution, whereas δ18O samples were cut into eight samples per year according to a cutting scale based on an ice-flow model (Reference SteffensenSteffensen, 1988). for this application the latter thus had to be resampled in order to be used together with the chemistry data. the resampling was done using statistical cubic interpolation. the sequence covers the years 1890–1910 in the depth interval 42.2–51.15 m. the relatively high annual accumulation rate of 0.37 ma–1 (Reference Clausen, Gundestrup, Johnsen, Bindschadler and ZwallyClausen and others, 1988) at Site D, combined with the fact that the selected series are taken from a shallow depth, gives a sampling frequency of approximately nine samples per year.
New data from NorthGRIP have been analyzed. the NorthGRIP1 ice-core deep drilling started during the 1996 field season 9.85 mbelow surface and terminated at a 1371 m depth during the 1997 field season (Reference Dahl-JensenDahl-Jensen and others, 2002). from the top down to a depth of 349.8 m a continuous series of 5 cm resolution was sampled for ion chromatographic analysis. This series corresponds to a time interval of approximately 2000 years. the chemistry samples were manually decontaminated and cut in the field using a microtome knife. They were stored frozen in Coulter Accuvette sample containers until measurement. Samples representing core depths from 116.05 to 221.65m were measured by M. Hansson at the University of Stockholm, Sweden. the rest of the series was measured at the Department of Geophysics, University of Copenhagen.
The samples measured in Copenhagen were melted in the Coulter accuvettes, and under a clean bench they were decanted into Dionex 5mL polyvials with filter caps. the polyvials and filter caps were pre-cleaned in >18MΩ water from an Elgastat UHP from Elga Ltd.
The measurements were done using a Dionex 500 microbore ion chromatograph with two channels. A single standard solution was used for quantification of the contents of Li+, Na+, NH4 +, K+, Mg2+, Ca2+, F–, MSA–, Cl–, NO3 – and SO4 2– in the samples. In the standard solution the concentrations of Li+ and MSA– were 0.2 and 0.3 μeq kg–1, respectively. the concentrations of the other ions in the standard solution ranged from 1 to 7 μeq kg–1. the chromatograms were integrated using Peaknet 4.30 software, and the peak heights were used in the evaluation except when the peak area seemed to be more reproducible.
A sequence from the depth interval 28.1–34.65 m (corresponding to 24 years) was selected because of excellent data quality and because the firnification and thinning of layers have not proceeded far at this depth. the measured concentrations of 11 ions were used. δ18O was left out of the analysis (1) because the signal is lost at greater depths due to diffusion in the relatively thin annual layers, and (2) in order to make the dataset significantly different from that of Site D.
With a sample size of 5 cm and with an annual accumulation rate of 0.195 ma–1 (Reference Dahl-JensenDahl-Jensen and others, 2002), the sampling frequency is approximately 5.5 samples per year.
Data preprocessing
Missing data cannot be handled in this analysis, and must therefore be replaced by realistic values. the series used here only had isolated holes, and a simple mean-of-neighbours scheme was applied to replace missing data and measurements that seemed improbable. the top of abnormal high peaks ascribed to volcanic eruptions was cut off such that the height of these peaks was reduced to approximately twice the average peak height. Prior to further analysis, the series were normalized to zero mean and unit variance in order to weigh the series equally. As a consequence of the normalization, all series on the plots are presented without dimensions.
The concentrations of different chemical components peak at different times of the year, but as the objective of this work is to extract the annual signal from all the data series and to collect them into one component, we decided to adjust the series such that they all peak simultaneously.
First, one series is chosen relative to which the others are shifted. to synchronize another series with the fixed series, the time lag which maximizes the absolute value of the time-lagged cross-correlation function is computed and the other series is shifted accordingly. the cross-correlation and the time lag computed here only relate to the synchronization of the series, and they have no relation to the dynamical decorrelation described above. the maximum time lag allowed should be less than the number of samples per year to prevent the series from being shifted a full annual cycle. It should, however, still be large enough to allow synchronization of winter and summer peaks. After trying different values, we settled on a maximum time lag of 3/4 of an average year. If the cross-correlation obtained is negative, the sign of the adjusted series is changed such that the peaks are synchronized and have the same sign. the latter is done only to facilitate comparison between series.
For Site D, we chose to use the δ18O profile as the fixed signal and synchronized and/or inverted the others relative to this.
For the NorthGRIP data, we have systematically tried each of the series as the fixed series, and we found that using Cl–, K+ or Na+ worked best. This is probably because they all exhibit only one major annual peak, which is rather broad. In this work, the importance of the synchronization has been investigated by performing the analysis both with and without the synchronizing of peaks. Although the difference is small, synchronizing the peaks gives somewhat better results.
Results
The dynamical decorrelation method was applied with values of the time shift τ ranging from 1to 30, corresponding to a few annual cycles. This interval should be sufficiently large to reveal differences in the autocorrelation functions of the source series. the value of τ that produced the source series with the most distinct annual component was individually chosen.
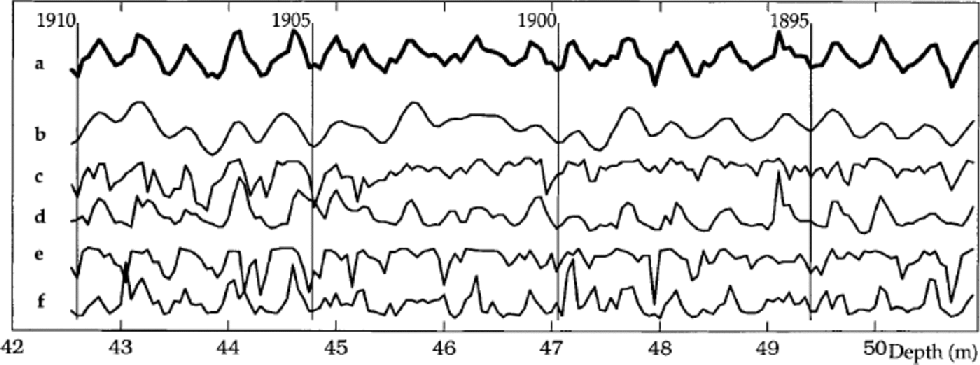
For Site D, the method produced the most pronounced annual signal for τ = 5. the source signal displaying the annual variation is shown in Figure 1 together with the five input data series. the vertical lines indicate the dating used by Reference SteffensenSteffensen (1988). It is seen that the annual signal produced somewhat resembles the NO3 – series, but that it is significantly improved, especially at year 1901, where the triple peak of the NO3 – series is replaced by a broad single maximum, and at year 1908, where a double peak is replaced by a single peak.
Results of dynamical decorrelation of Site D data (a) with τ = 5 compared to the raw but synchronized data series of (b) δ 18O, (c) SO4 2–, (d) NO3 –, (e) Cl–and (f) dust mass.
As stated in the previous subsection, the synchronization of the NorthGRIP data series was performed prior to the analysis with different choices of the fixed series. Depending on the choice of fixed series, different values of τ performed best. Approximately 100 tests were performed with different combinations of fixed series and time lags τ. the three combinations that performed best are shown in Figure 2 together with the series that was held fixed. In general, our results show that the annual signal produced by dynamical decorrelation most closely resembles the input series that was held fixed.
Examples of results from dynamical decorrelation (DD) of NorthGRIP data compared to the raw but synchronized data series. (a)DD with Na+ fixed and τ = 3. (b) Raw Na+.(c) DD with K+fixed and τ = 5. (d) Raw K+. (e) DD with Cl– fixed and τ = 2. (f) Raw Cl–.
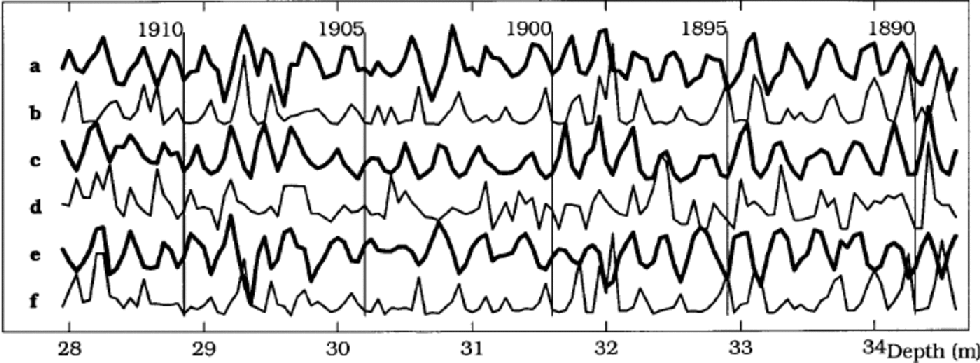
It is seen that the signals produced exhibit clear annual variation, with peaks of comparable size, and that there is good agreement between the three source series on where the peaks should be situated, although the peak sizes vary considerably across the series.
To test the robustness of the results, the analysis was performed on two overlapping series containing the first 60% and the last 60% of the series from Site D, respectively, using the same value of τ. the results agreed almost perfectly in the interval where the two parts overlapped. Also 10 samples were removed from each end of the series and the result was compared with the result from the analysis with the full dataset. Again almost perfect agreement was achieved, and from these two tests we conclude that dynamical decorrelation produces results that are largely indifferent to even considerable changes in input data selection.
The same method was also applied to a different sequence of NorthGRIP data from approximately 110m depth. the results were not convincing, indicating that the method demands data with a resolution of at least 4–5 samples per year.
A measure of performance
In order to evaluate the method’s performance, a simple ``dating’’ scheme has been set up. for a given series, the number of peaks rising above a certain threshold is counted. the number of peaks should in the optimal case be equal to the number of years for a wide variety of threshold levels, such that the exact value of the threshold level is not critical to the result. Applying the scheme to count the number of peaks of, for example, sin(2τt); t ϵ [0,10], the number of peaks will be 10 for threshold levels l ϵ ]–1,1[, and zero for all other l. If the number of peaks p is plotted against l, it is clear from this graph that the number of peaks must be 10, and that the result does not depend on the exact choice of l.
In general, the series’ ``countability’’ will be evaluated using this counting method. A series will be considered easy to count if the (l, p) graph exhibits a plateau of (almost) constant p over a wide range of l, while the absence of such a plateau indicates that the series cannot be dated using this simple counting method.
This method of counting annual peaks is crude, and so may not yield perfect results. However, we assume that if the dynamical decorrelation method improves the countability of the series when such a simple counting method is used, it is most likely that the source series produced exhibit a stronger annual signal than the original data series and will be easier to date using almost any counting method.
The method counts peaks of any size as long as they cross the threshold level. A peak consisting of only one measurement that barely exceeds the threshold level is thus counted as a peak. It is thus expected that noisy data series will have too many peaks when this counting method is used. to overcome this problem, we have tried to run the data through a low-pass filter before counting the number of peaks. A fifth order Butterworth digital low-pass filter with a cut-off frequency of 4.5 a–1 provided good results.
The counting method has been used on both filtered and unfiltered results from the dynamical decorrelation and on raw data for comparison. the (l,p) plots produced show considerable improvement in the countability of the number of peaks (Fig. 3).
The number of peaks p vs threshold level l for (a) Site D and (b) NorthGRIP. Results from the dynamical decorrelation filtered with a low-pass filter (bold line), DD unfiltered (medium line), raw filtered (thin line) and raw unfiltered (dashed line). the number of years obtained by manual counting (19 for Site D and 24 for NorthGRIP) is marked with asterisks.
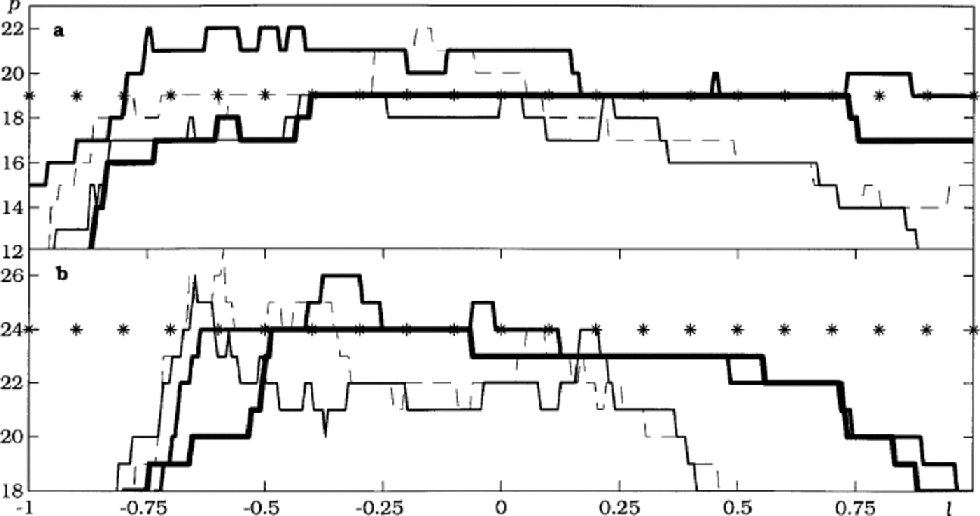
Especially for Site D (Fig. 3a) the results are promising. When the counting method is applied to the filtered annual component from the dynamical decorrelation, the same number of years as obtained by manual layer counting is found for a wide interval of threshold levels l 2 [–0.42, 0.71]. for the unfiltered signal, the number of peaks is less well defined. the number of peaks in the raw data is counted in the same way but provides no usable results for dating, nor do the filtered but otherwise raw data.
For NorthGRIP, only the (l,p) plot for the case where Na+ is fixed and τ = 3 is shown (Fig. 3b). As with the Site D results, only the filtered dynamical decorrelation series provides good countability. With l 2 [–0.50, –0.07] the result agrees with the 24 years determined by manual counting, while 23 years is found when l ϵ [–0.07, 0.55]. This is because the peak representing the year 1904 (see Fig. 2) is less pronounced than the other annual peaks and is thus only counted if the threshold level is lower than –0.07. Features like the ``two-level-plateau’’ in Figure 3b can thus be used to identify doubtful annual layers.
Discussion
Comparing the series in Figures 1 and 2, it is seen that the dynamical decorrelation method can extract a signal that exhibits a more pronounced annual variation than the input series themselves. It is demonstrated that the method cures the series of some problems of double or triple maxima and that the peaks in the produced signal have a relatively well-defined height. This facilitates automatic counting of the peaks by a simple method as demonstrated in Figure 3.
The results produced are sensitive to the choice of τ and to some extent to which series is held fixed, but are otherwise fairly robust. By comparing the three series in Figure 2 that are the results of dynamical decorrelation, one sees that although the series produced vary somewhat for different choices of fixed series and τ, the overall appearance is similar.
Dynamical decorrelation is thus able to improve data series significantly prior to, for example, dating. Nevertheless its practical applications are at present limited by the need to choose how to synchronize the data, choose a suitable value for τ, and select an appropriate cut-off frequency for the low-pass filter. Future investigations will show whether choices can be made that will work well for longer data series from the same ice core. In particular, it is hoped that values of τ can be found that will work on longer records from the same climatic period.
Acknowledgements
The authors wish to thank L. K.Hansen, TechnicalUniversity of Denmark, for introducing us to the method of Molgedey and Schuster and for good discussions. the authors are indebted toJ. P. Steffensen for fruitful discussions and suggestions. K.K.A. is supported by the Carlsberg Foundation.



