Introduction
A basic assumption underlying the concept of land stewardship popularized by Aldo LeopoldReference Leopold, Callicott and Freyfogle1 is that local knowledge of soil and other natural resources is the foundation of sustainable land management. A logical extension of this view is that farmer knowledge is a valuable resource that can contribute to the scientific investigation of soil quality (SQ). Several recent studiesReference Liebig and Doran2, Reference Granatstein and Bezdicek3 have proposed that farmer assessments of SQ are a useful antecedent to more technical investigations. Other studiesReference McCallister, Nowak and Lal4, Reference Bentley5, however, have identified poor agreement between farmer perceptions and technical descriptions of soil and cautioned that misunderstanding of scientific principles impedes problem solving by farmers. Integration of experiential knowledge (e.g., farmer understanding of soil) with scientific methods is clearly challenging, but may be essential for understanding holistic concepts such as SQ.
Understanding how farmer perceptions of soil relate to objective soil properties is key to using farmer knowledge as a resource in the scientific investigation of soil. Ethnopedologists have identified strong relationships between indigenous soil classification systems and chemical and physical soil parametersReference Queiroz and Norton6. Perhaps even more importantly, however, indigenous soil classification systems distinguish the soil characteristics that guide local managementReference Krasilnikov and Tabor7. Often constraints and opportunities can be identified when local perceptions of soil contrast with scientific assessmentsReference Tabor and Hutchinson8.
Several recent studiesReference Liebig and Doran2, Reference McCallister, Nowak and Lal4 have indicated that farmers in the US have limited understanding of the technical characteristics of the soils they manage. A survey of 745 farmers in Wisconsin found a low level of agreement between farmer responses and profile characteristics of the solum at Natural Resource Inventory sampling points in their fieldsReference McCallister, Nowak and Lal4. This is not surprising, however, as farmers interact primarily with surface soil and rarely use the esoteric soil science terminology included in the survey. In eastern Nebraska, Liebig and DoranReference Liebig and Doran2 evaluated the accuracy of SQ assessments by 24 farmers of paired sites (‘good’ and ‘poor’ soils) with respect to field descriptive, field analytical and laboratory-analytical assays of soil. Farmer assessments were ‘correct’ or ‘near correct’ greater than 75% of the time for most soil parameters, but were less accurate for ‘poor’ soils than ‘good’ soils and particularly inaccurate for intangible soil properties such as available N and P.
Several regional SQ research initiativesReference Garlynd, Kurakov, Romig, Harris, Doran, Coleman, Bezdicek and Stewart9, Reference Walter, Wander and Bollero10 have used farmer perceptions of soil as a central resource. The Wisconsin Soil Health Program (WSHP) was initiated in 1990 and involved more than 100 Wisconsin farmers in a collaborative effort to gather, analyze and utilize farmer perceptions of soilReference Garlynd, Kurakov, Romig, Harris, Doran, Coleman, Bezdicek and Stewart9. One WSHP activity used a series of structured questions to identify how a select group of 28 farmers recognize healthy soilReference Romig, Garlynd, Harris and McSweeney11. Another WSHP activity was the development of the Wisconsin Soil Health Scorecard, a checklist of soil health indicators accompanied by distinct scoring criteriaReference Romig, Garlynd, Harris, Doran and Jones12. The Illinois Soil Quality Initiative (ISQI) was established in 1990 and monitored physical, chemical and biological soil characteristics under different cropping systems and environmental conditionsReference Walter, Wander and Bollero10. Collaborating farmers participated in evaluating soil data, developing new directions for SQ research and communicating SQ concepts to a wider audienceReference Walter, Wander and Bollero10. These programs and others that have involved farmers in SQ research recognize that farmers implement the practices that improve, maintain or diminish agricultural SQReference Wander and Drinkwater13.
The terms ‘soil quality’ and ‘soil health’ have often been used synonymouslyReference Doran, Safley, Pankhurst, Doube and Gupta14 to describe the concept of ‘soil fitness to perform important soil functions’Reference Larson, Pierce, Doran, Coleman, Bezdicek and Stewart15. While some semantic distinctions between the two terms have been presented in the literatureReference Harris, Bezdicek, Doran, Coleman, Bezdicek and Stewart16, Reference Pankhurst, Pankhurst, Doube and Gupta17, we offer the following differentiation to encourage greater linguistic precision in future discussions. Soil quality is a utilitarian term that describes compatibility between a soil's properties and valued services performed by soil. These soil properties include both inherentReference Wander, Walter, Nissen, Bollero, Andrews and Cavanaugh-Grant18alias use-invariantReference Grossman, Harms, Seybold and Herrick19 and staticReference Wagenet and Hutson20 properties (e.g., texture, mineralogy, landscape position) and management-sensitive alias use-dependentReference Grossman, Harms, Seybold and Herrick19 and dynamicReference Wander, Walter, Nissen, Bollero, Andrews and Cavanaugh-Grant18 properties (e.g., organic matter content, biological activity, aggregate stability). In contrast, soil health is an ecological term that describes the extent to which a soil fulfils key criteria of biological integrity (e.g., self regulation through feedback processes and freedom from distress symptoms)Reference Okey21, Reference Rapport, McCullum, Miller, Pankhurst, Doube and Gupta22. Thus, soil quality, with its utilitarian orientation, is the appropriate term when discussing farmer perceptions of soil performance in agricultural production systems.
Some studies have quantified SQ using single soil parameters with broad ecological impact, such as microbial biomassReference Carter23 and active organic matterReference Weil, Islam, Stine, Gruver and Samson-Liebig24. Other studies have quantified SQ using mathematical functions that vary with respect to techniques for selection (e.g., key functionsReference Karlen, Wollenhaupt, Erbach, Berry, Swan, Eash and Jordahl25, best-fit regressionReference Islam and Weil26, power analysisReference Nui, Murphy, Braimbridge, Osler, Jasper and Abbott27), weighting (e.g., threshold valuesReference Karlen, Wollenhaupt, Erbach, Berry, Swan, Eash and Jordahl25, data set maximumsReference Islam and Weil26, scoring functionsReference Karlen, Wollenhaupt, Erbach, Berry, Swan, Eash and Jordahl25) and integration (e.g., additiveReference Karlen, Wollenhaupt, Erbach, Berry, Swan, Eash and Jordahl25, Reference Islam and Weil26, multiplicativeReference Singh, Colvin, Erbach and Mughal28) of multiple parameters. Most integrative models are subjective (i.e., dependent on the priorities and judgments of investigators).
A critical step in the assessment of SQ is the identification of SQ benchmarks. Within the traditional ‘soil productivity equals SQ’ paradigm, high yields are a benchmark of SQ. More holistic concepts of SQ attach importance to environmental quality and soil fitness for uses other than agricultureReference Granatstein and Bezdicek3. Some studiesReference Buyanovsky, Kucera and Wagner29–Reference Skidmore, Carestenson and Banbury31 have used soil conditions under native vegetation as SQ benchmarks. Harris and BezdicekReference Harris, Bezdicek, Doran, Coleman, Bezdicek and Stewart16 proposed that farmer observations and judgments of SQ could serve as the foundation for a SQ index (SQI). The present study used farmer ratings of SQ as benchmarks for evaluating the relationship between management-sensitive soil parameters and SQ. Unlike studiesReference Liebig and Doran2, Reference McCallister, Nowak and Lal4, Reference Bentley5 which evaluated the accuracy of farmer perceptions, this study started with the premise that SQ ratings by recognized land stewards encapsulate valuable experiential knowledge.
The primary objective of the study was to identify management-sensitive soil parameters and SQI models that agree well with farmer SQ ratings. A secondary objective was to document field indicators of SQ used by farmers and farmer perspectives regarding best management practices for SQ.
Materials and Methods
Selection of farmers
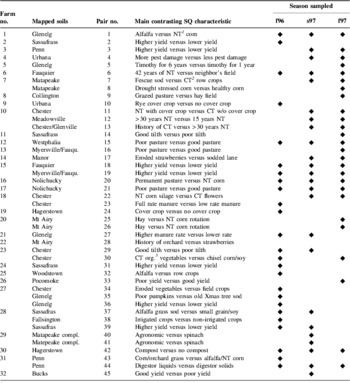
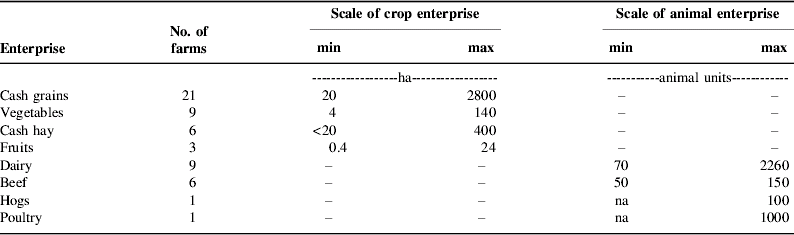
Between the summer of 1996 and the fall of 1997, 75 Mid-Atlantic farmers recognized for their interest in soil conservation were identified as potential farmer collaborators by county extension agents, Natural Resources Conservation Service (NRCS) conservationists or the authors. During short informal telephone interviews, perspective farmer collaborators were asked to identify paired sites on their farms or adjacent land that they perceived to have the same soil type but contrasting SQ. SQ was briefly defined as ‘fitness to perform important soil functions’. It was stipulated that paired sites should be mapped as the same (or very similar) soil series, so as to reduce the likelihood that differences in inherent properties (e.g., texture, slope and drainage) would obscure relationships between management-sensitive soil properties and farmer SQ ratings. Forty-five paired sites on 32 farms were selected for inclusion in the study (Table 1) based on farmer interest and ability to identify contrasting sites and our goal of including soils from farms with a range of enterprises and scales of operation (Table 2) across the Mid-Atlantic.
Location, mapped soil series, main contrasting feature and season sampled for all paired SQ contrast sites.

1 NT=no-till.
2 CT=conventional tillage.
3 org.=certified organic. f96, fall 1996; s97, spring 1997; f97, fall 1997.
Type and scale of enterprises associated with the participating farms.
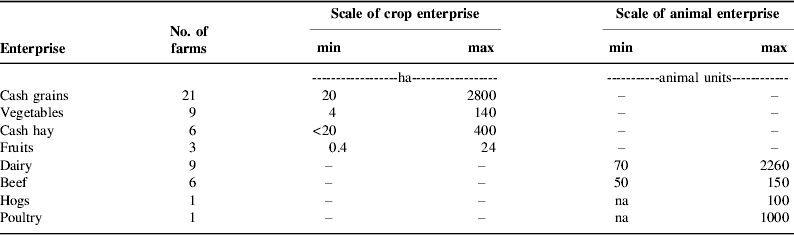
During initial farm visits, farmers showed the investigators the paired sites that they perceived to have contrasting SQ (Table 2). Some of the contrasting sites were adjacent fields while others were distinct areas within the same field. Farmers were interviewed at the sites about (1) the management history of each site, (2) evidence of SQ differences between paired sites and (3) best management practices for improving SQ. Interviews were informal and responses were transcribed in the field. All paired sites included in the study were of similar landscape position. All but three paired sites were mapped as the same series with the remaining three mapped as different but similar soil series (e.g., Chester and Glenville silt loams).
Soil sampling and processing
Soil samples were collected from 45 pairs of sites on 32 farms located in five mid-Atlantic states (26 in Maryland, 1 in Delaware, 2 in Pennsylvania, 2 in Virginia and 1 in West Virginia). The farms were located in three physiographic provinces: 8 in the mid-Atlantic Coastal plain, 15 in the Piedmont and 9 in the Ridge and Valley province. According to NRCS county soil survey maps, 22 different soil series were sampled (Table 1).
Soil samples were collected one, two or three times from paired sites, depending on the initial sampling season. Samples were collected prior to spring tillage or planting and after harvest but before tillage in the fall, so as to avoid periods of recent physical disturbance. At the time of each sampling, 12–14 cores (0–7.5 cm, total composite volume=380 cm3) were collected from each site using a fully enclosed zero contamination JMC soil probe (Clements Associates, Inc., Newton, IA). When row crops were sampled, an equal number of row and inter-row soil cores were collected. Samples were sealed in plastic-lined bags and transported on ice to a cold storage facility where they were stored at 5°C until processed.
The fresh weight of each soil sample was recorded and the gravimetric moisture content was determined by mass loss after drying approximately 10 cm3 of soil to constant mass in a microwave (MW) oven. The remaining soil was gently crumbled through a sieve with 4 mm openings. Approximately 100 g of soil were returned to the original plastic-lined bag and reserved for analysis of macroaggregate stability. The remaining soil was passed through a sieve with 2 mm openings, analyzed for gravimetric moisture content (method described above) and then transferred to a new plastic-lined bag. Both bags of soil were stored at 5°C until needed for analysis.
Soil analyses
Within two weeks of sampling, moist soil (<2 mm) was analyzed for the following labile C parameters: 0.5 M K2SO4 extractable C from MW sterilized soil (CMW)Reference Islam and Weil32, 0.5 M K2SO4 extractable C from unmicrowaved soil (CNMW)Reference Islam and Weil32, anthrone reactive C (CAR)Reference Brink, Dubach and Lynch33 in 0.5 M K2SO4 extracts of MW sterilized soil (CAR) and substrate induced respiration (CSIR)Reference Van de Werf and Verstrate34.
Total C in the K2SO4 extracts was determined using the Islam and Weil MW digestion methodReference Day and Black35. Microbial biomass C (CMB) was calculated by subtracting CNMW from CMW and multiplying by an efficiency coefficient of k=0.21 determined by Islam and WeilReference Islam and Weil32. CAR (a measure of reducing sugars) was determined by reacting 0.1% anthrone with 0.5 M K2SO4 extracts of MW sterilized field moist soil (CAR) at 80°C in concentrated sulfuric acidReference Brink, Dubach and Lynch33 followed by spectrophotometric analysis of the resulting color complex. CSIR was calculated as the difference in CO2 evolution during a 6 h incubation of amended (glucose and nutrients) and unamended soil samplesReference Van de Werf and Verstrate34.
Soil (<2 mm) that had been dried overnight at 105°C was analyzed for (1) total C and N content using a dry combustion analyzer (LECO Corp., Warrendale, PA) and (2) particle size distribution using a modified pipette methodReference Islam and Weil36.
Air dry soil (<2 mm) was analyzed for pH and Mehlich I extractable Mg, Ca, P and K using methods outlined by the Northeast Coordinating Committee on Soil Testing37.
Air dry soil (1–4 mm) was analyzed for macroaggregate stability (AGSTAB) using a modified Kemper and Rosenau methodReference Kemper and Rosenau38. AGSTAB was calculated as the mass fraction of <0.73 mm soil retained on a micro-sieve (50 mm diameter, 0.73 mm mesh openings) after rapid submergence in deionized water and 2 min of orbital shaking at 100 revolutions per minute.
The porosity of each soil was calculated assuming that all composite soil samples had a total volume of 380 cm3 and a particle density of 2.65 g cm−3.
Finally, two quotient parameters were calculated using the following functions:


where CMB is microbial biomass carbon, CT is total C, CNMW is extractable C from unmicrowaved soil and CMW is extractable C from MW sterilized soil.
The parameters described above were determined for all soil samples with the exception of the routine soil test parameters (pH and Mehlich I extractable Ca, Mg, K and P) that were only measured for the first samples collected from each site and CSIR that was only determined for samples collected during the spring and fall of 1997. Higher parameter values were assumed to indicate superior SQ for all parameters other than qCNMW and clay content.
Calculating a SQI and three soil discrimination indices
A SQI was calculated by averaging normalized values of the five individual SQ parameters that best agreed with farmer SQ ratings. The component parameters were normalized around a mean value of 50 and a standard deviation of 10, using a Z score approach39. The following function was used to calculate the SQI:

where Δp is the difference between the value of an individual component parameter and its data set mean, p std is the data set standard deviation of the component parameter, and n is the total number of parameters integrated.
Discriminant analysis (DA) was used to generate three additional indices: (1) SDITILL with optimized discrimination between soils receiving conventional tillage management and no-till management, (2) SDISOD with optimized discrimination between soils under long-term sod and soils with no sod in rotation, and (3) SDIFR with optimized discrimination between soils rated good and poor by farmers. DA was chosen over other multivariate statistical tools (e.g., principal component analysis) that are also useful for data reduction because DA is specifically designed for identifying minimum sets of variables that best discriminate between contrasting groups39.
Parameters that best discriminated between the contrasting soil classes were identified using procedure PROC STEPDISC39 with the stay criteria set at p(F)<0.05. Paired classification functions of best discriminator parameters were calculated using procedure PROC DISCRIM39. The discrimination power of the calculated classification functions was tested using the resubstitution option in PROC DISCRIM39.
Creating indices out of classification functions
The paired classification functions associated with the best discriminator parameters for each soil categorical contrast were combined by subtraction, forming single linear functions. The conventional tillage function was subtracted from the no-till function, the no-sod function from the long-term sod function and the poor rated soil function from the good rated soil function. Parameter values from the data sets were plugged back into the linear functions and SAS procedure PROC MEANS39 was used to calculate data set means and standard deviations for the linear functions. The following function was used to calculate three indices (SDITILL, SDISOD and SDIFR):

where f(x) is the linear function and f(x)mean and f(x)std are the mean and standard deviation of the linear function.
Evaluating the relationship between farmer SQ ratings and individual soil parameters
The relationship between individual soil parameters and farmer SQ ratings was evaluated using data associated with all samplings of all sites (75 soil SQ contrast pairs) and data associated with the first sampling of all sites (45 SQ contrast pairs). Paired t-tests (PROC MEANS39) were performed on Δp values (Δp=parametergood rated soil−parameterpoor rated soil) to test the likelihood of parameters having Δp values greater than zero. Parameters with positive t-scores and p(H0)<0.05 were interpreted to be significantly in agreement with farmer SQ ratings. Mean percent parameter difference values were calculated for paired good and poor rated soils using the following function:

where Δp is the difference between the good and poor soil parameter values, p mean is the mean parameter value for a pair of good and poor rated soils and n is the number of SQ contrast pairs. Parameters with greater mean percent difference values were interpreted to be more sensitive to farmer SQ ratings.
Evaluating the relationship between soil indices, index component parameters and farmer SQ ratings
Data associated with 48 paired sites sampled in spring and fall 1997 that had no missing values for component parameters, were selected for evaluating the relationship between the four calculated indices, individual component parameters and farmer SQ ratings. Paired t-tests (PROC MEANS39) were used to evaluate the relationship.
Results and Discussion
Diagnostic indicators of SQ mentioned by farmers
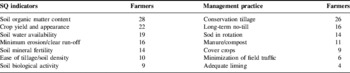
The indicators of SQ discussed by farmers during field interviews were ranked with respect to the number of farmers that mentioned each indicator (Table 3). Soil organic matter (SOM) was the indicator of SQ mentioned by the most farmers (88%). This high level of recognition of SOM as a SQ indicator concurs with Granatstein and Bezdicek3 who stated that SOM is the most universally accepted indicator of SQ. Crop condition (e.g., yield, drought tolerance, pest damage and root appearance) was the next most frequently mentioned SQ indicator (69%). Farmers tend to have much more visual contact with their crops than their soils, and thus it is logical that many look to crop characteristics as SQ indicators. SOM and crop condition, the SQ indicators mentioned most frequently in this study, were also the top two indicators of SQ/soil health identified by Wisconsin farmersReference Romig, Garlynd, Harris and McSweeney11.
SQ diagnostic indicators, best management practices for improving SQ, and the number of farmers that mentioned each (n=32).

SQ indicators related to soil hydrologic function were mentioned by 59% of farmers. Four farmers commented that they consider soil water-holding capacity to be the most distinguishing feature between good and poor quality soils. Evidence of soil erosion was mentioned by 50% of farmers. Most of the farmers using minimum tillage practices mentioned that they have observed much less erosion on their farm as compared to their neighbors who use more intensive tillage practices or as compared to when they previously used more intensive tillage practices. The fact that a majority of farmers (63%) did not mention soil mineral fertility as a SQ indicator suggests many farmers perceive their soil productivity is currently not limited by soil mineral fertility. The relatively small fraction (31%) of farmers that mentioned ease of tillage is related to most (81%) of the participating farmers using minimum tillage or no-till systems. Soil biological indicators, such as the presence of earthworms and their middens, fungal fruiting bodies, rate of residue decay, etc., were mentioned relatively infrequently (28%) by farmers. This small percentage suggests a need for identification of practical biological indicators of SQ and training programs for mid-Atlantic farmers related to the importance of soil biology in mediating soil functions.
The percentages of farmers that described a relationship between SQ and specific soil and crop characteristics should not be interpreted as a direct measure of farmer valuation of the soil and crop characteristics as SQ indicators. Romig et al.Reference Romig, Garlynd, Harris and McSweeney11 ranked SQ indicators based on a three part scoring system that assigned value based on when the indicator was mentioned in the interview, how frequently it was mentioned, and how many farmers mentioned the indicator. The less structured interviewing process used in this study necessitated a simpler and less inferential technique for quantifying interview responses. Direct insights into farmer valuation of specific SQ indicators can only be drawn from the individual farmer comments. Indicators described as most important by individual farmers included crop yield, soil water-holding capacity, crop root appearance, clarity of run-off, lack of soil compaction and ease of seed bed preparation.
Farmer perceptions of best management practices for SQ
Farmer remarks concerning the effects of specific management practices on SQ are summarized in Table 3. SQ benefits from minimizing tillage were described by 81% of the farmers. Among collaborating farmers, half have eliminated all tillage. This is congruent with the Conservation Tillage Information Center's40 statistics for Maryland (50% of all crop acres were planted no-till in 1999). Many of the collaborating farmers that used no-till had not tilled for over 10 years and were convinced of the SQ benefits of long-term no-till. SQ benefits from including sod in crop rotations were described by 44% of the farmers. SQ benefits from the use of organic soil amendments (e.g., manure, compost) and cover crops were mentioned by approximately one-third of the farmers (34 and 28%, respectively); however, the farmers that mentioned these practices were very convinced of their positive impact on SQ. In addition to describing positive management effects on SQ, many farmers, particularly those using continuous no-till, described the negative impacts of excessive field traffic, any traffic over wet soils, inadequate liming and application of pesticides that are toxic to earthworms.
SQ parameters
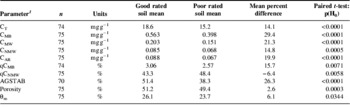
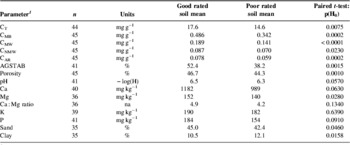
SQ parameter statistics for all samplings are presented in Table 4. Statistics for just the first sampling of each site are presented in Table 5. Select statistics for samples collected in the spring and fall of 1997 are presented in Table 8.
Significant relationships between farmer SQ ratings and soil parameters associated with all samplings of paired SQ contrast sites.

1 CT=total C, CMB=microbial biomass C, CMW=C in 0.5 M K2SO4 extract of MW irradiated soil, CNMW=C in 0.5 M K2SO4 extract of non-irradiated soil, CAR=anthrone reactive C in 0.5 M K2SO4 extract of MW irradiated soil, CSIR=substrate induced respiration rate, qCMB=CMB CT−1, qCNMW=CNMW CMW−1, AGSTAB=% macroaggregate stability, θm=gravimetric moisture content at sampling.
The relationship between farmer SQ ratings and soil parameters associated with the first sampling of paired SQ contrast sites.

1 Ca=Mehlich I extractable calcium, Mg=Mehlich I extractable magnesium, Ca:Mg ratio=equivalents Mehlich I extractable Ca∗(equivalents Mehlich I extractable Mg)−1, K=Mehlich I extractable K2O, P=Mehlich I extractable P2O5, sand=% sand, clay=% clay; see Table 4 for additional parameter abbreviation interpretations.
Soil C parameters (CT, CMB, CMW, CAR and CSIR) and soil structure parameters (porosity and AGSTAB) were found to agree well with farmer SQ ratings (P<0.0005). Quotient parameters qCMB and qCNMW also had a highly significant level of agreement with farmer SQ ratings (P<0.007). SparlingReference Sparling, Pankhurst, Doube and Gupta41 suggested that active C:total C quotients have greater meaning than absolute active C levels when comparing soils with differences in texture, drainage, or climate, and therefore different inherent capacities to retain SOM. When comparing soils with similar inherent properties, such as in this study, quotient parameters would not be expected to have an advantage.
For a parameter to be useful as a SQ indicator, the parameter should consistently (i.e., with a high probability) differ between good and poor quality soils and the difference should be relatively large in magnitude so as to be readily detectable. Many authorsReference Carter23, Reference Weil, Islam, Stine, Gruver and Samson-Liebig24, Reference Powlson and Jenkinson42 have reported that soils with contrasting management have greater relative differences between biologically active C parameters as compared to total C. This study found that soil C parameters associated with MW sterilized soil (CMB, CMW, CAR) had mean percent differences (29.4, 21.3 and 19.9%, respectively) that were larger than those associated with CT and CNMW (14.1 and 14.8%, respectively) (Table 4).
Experimental error is unlikely to obscure the relationship between a particular parameter and farmer SQ ratings if the differences in parameter values between good and poor rated soils are many times greater than the coefficient of variation (CV) for the analytical method. Among the parameters measured in this study, the ratio of mean percent difference to CV was greatest for CMW, CAR and AGSTAB (14.2, 7.7 and 3.7, respectively), indicating that these three parameters may be most reliable in distinguishing between soils with contrasting SQ. Islam and WeilReference Islam and Weil43 found these parameters to be among the best discriminators between soils managed with and without conservation practices.
At the first sampling of each pair of SQ contrast sites, soils were analyzed for all the soil parameters just discussed as well as particle size distribution and standard mineral fertility parameters (Table 5). AGSTAB and all the soil C parameters agreed well (P≪0.05) with farmer SQ ratings. Mehlich I extractable Mg was the only mineral fertility that differed significantly (P<0.05) between good and poor rated soils. The Ca:Mg ratio, a relationship considered important by proponents of the base cation saturation ratio (BCSR) approach to soil fertility managementReference Eckert and Brown44, was not significantly related to farmer SQ ratings.
Both sand and clay showed small but statistically significant (P<0.05) differences between paired sites. Good rated soils had 16 mg g−1 less clay and 26 mg g−1 more sand than poor rated soils. This difference in texture, for soils mapped as the same or very similar soil series, is likely to relate to differences in erosion. Compared to less eroded sites, more eroded sites would have clay-enriched argillic horizons closer to the surface and more likely to be incorporated into the Ap horizon by tillage. In addition, erosion tends to enrich surface soil with clay by preferentially removing fine sand and silt-size particlesReference Rhoton45. It is also possible that some of the measured textural differences were related to incomplete dispersion of microaggregates during particle size analysisReference Tisdall and Oades46.
Development of indices from linear classification functions
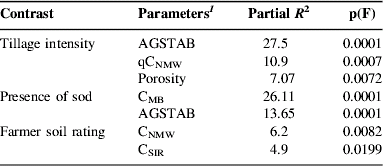
The parameters identified as the best discriminators (by stepwise DA) between tillage classes, presence of sod classes and farmer SQ rating classes are presented in Table 6. Parameters AGSTAB and CMB were associated with greater than 25% of the variability between tillage and presence of sod classes, respectively. None of the individual parameters were strong discriminators between the unpaired good and poor rated soil populations (Table 6). The normalized linear combinations of best discriminator parameters used to calculate SDITILL, SDISOD and SDIFR were as follows:

Soil parameters identified using SAS procedure PROC STEPDISC as the best discriminators between tillage, presence of sod and farmer rating soil categories
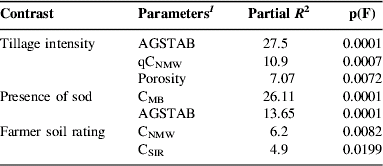
1 See Table 4 for parameter abbreviation interpretations.
Using the resubstitution option in SAS procedure PROC DISCRIMReference Islam and Weil36, we compared the discrimination power of a linear function of all measured parameters with a function of the best discrimination parameters. The respective classification success rates for these two types of functions were: 85.3 versus 82.4% for conventional tillage: 83.1 versus 83.1% for no-till, 86.5 versus 86.5% for no-sod, 83.3 versus 75.0% for sod, 65.5 versus 62.1% for good rated soils and 87.0 versus 66.7% for poor rated soils. Thus, functions comprised of only two or three best discriminator parameters were nearly as good at discriminating between the contrasting soil categories as functions containing all measured parameters.
Relationships between SQ ratings by farmers and indices and index component parameters
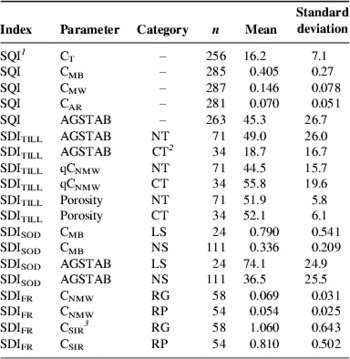
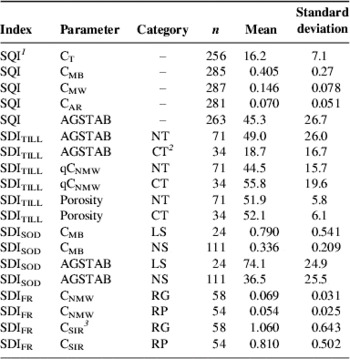
Means and standard deviations of the component parameters are presented in Table 7. Paired t-test, t-scores, and p(H0) values associated with indices and index component parameters are presented in Table 8. Unlike Tables 4 and 5, all the parameters presented in Table 8 are associated with the same number of SQ contrast pairs (n=48). As a result, it is meaningful to compare t-scores in addition to p(H0) values.
Data set parameter means and standard deviations used in the calculation of the soil indices: SQI, SDITILL, SDISOD and SDIFR.

1 SQI=f(CT, CMW, CMB, CAR, AGSTAB), SDITILL=f(AGSTAB, qCNMW, porosity), SDISOD=f(CMB, AGSTAB), SDIFR=f(CNMW, CSIR).
2 CT=conventional tillage, NT=no-till, LS=long-term sod, NS=no sod in rotation, RG=rated good quality by farmer, RP=rated poor quality by farmer.

The SQI that integrated the five best individual parameters (based on data from all samples) had a t-score of 7.52. The five best individual parameters (CT, CMW, CMB, CAR, AGSTAB) had t-scores ranging from 4.63 to 6.71. This demonstrates that linear combinations of SQ parameters can be assembled which are more in agreement with holistic SQ criteria such as farmer SQ ratings than individual SQ parameters. The process of averaging multiple parameters, which was used in creating the SQI, reduced the impact of individual parameter variability. We speculate that this statistical process is analogous to the process by which farmers make their judgments of SQ. For example, single observations of erosion, drought stress or pest damage are unlikely to cause a farmer to rate a site as having poor SQ if the farmer's overall recollection of soil performance at the site is favorable.
DA using appropriate class contrasts produced linear combinations of soil parameters that were strongly related to farmer SQ ratings. The index derived from contrasting long-term sod and no sod in rotation (SDISOD) had the strongest level of agreement with farmer SQ ratings of the three indices. This is not surprising as the positive impact of sod on SQ has been described by many authorsReference Low47–Reference Weil, Lowell and Shade49.
The index based on farmer ratings (SDIFR) was calculated as a linear function of two parameters, CNMW and CSIR, which were selected because they optimized discrimination between unpaired good and poor rated soils. Individual parameters (CT, CMW, CNMW, CMB, CAR, CSIR and AGSTAB) that were analyzed for within-pair differences were more in agreement with farmer SQ ratings than SDIFR, as indicated by lower p(H0) values. The greater level of agreement associated with paired analysis as compared to unpaired analysis demonstrates a major SQ research challenge. Many soil parameters that are good discriminators between sites that have received contrasting management but have similar inherent soil properties do not appear to have absolute threshold values that would allow SQ assessment across soils that differ widely in their inherent properties.
The index based on contrasting tillage regimes (SDITILL) had the weakest relationship with farmer SQ ratings of the three soil discrimination indices. This is not surprising as only six of the 48 SQ contrast pairs consisted of a good rated soil receiving less intensive tillage management than its poor rated pair. In fact, both the good and poor rated soils in 15 out the 48 SQ contrast pairs were under NT management. The inclusion in the index database of 15 soils under no-till management that had been described as poor quality by their farmers, reduced the strength of relationship between SDITILL and farmer SQ ratings.
Conclusions
Farmer knowledge of SQ as encapsulated in contrasting SQ ratings assigned to paired sites provided a useful benchmark for evaluating the relationship between management-sensitive soil parameters and SQ. Among the individual SQ parameters measured, CMW had the highest level of agreement with farmer SQ ratings as indicated by low p(H0) and high mean percent difference values. This parameter is closely related to microbial biomass, and several authorsReference Wardle and Ghani50, Reference Franzluebbers, Haney, Hons and Zuberer51 have suggested that biomass C can be estimated without subtracting a control (CNMW in this study). AGSTAB and soil C parameters (CT, CMB, CAR, CSIR) also agreed well with farmer SQ ratings. Some of the quotient parameters investigated (qCMB and qCNMW) did not agree as well with farmer SQ ratings as their component parameters.
The calculated SQI had the highest t-score of all measured and calculated parameters (associated with samples collected in the spring and fall of 1997 that had no missing values) demonstrating that linear combinations of SQ parameters can be assembled which are more in agreement with holistic SQ criteria such as farmer SQ ratings than individual SQ parameters. DA was an effective approach for selecting and integrating minimum data sets of SQ parameters into discrimination indices that are related to farmer perceptions of SQ. This objective method of data reduction based on ability to discriminate between soils with contrasting management merits more investigation.
The lack of differences in pH and available nutrients between soils rated by farmers as having contrasting SQ, suggests that these mid-Atlantic farmers have largely resolved mineral fertility constraints on SQ. In contrast, parameters related to soil structure and C were found to be strongly related to SQ ratings by these mid-Atlantic farmers. This suggests that efforts to improve SQ in the Mid-Atlantic region should focus on monitoring and enhancement of soil C and soil structure.
The integration of on-farm data as collected in this study with data from appropriate replicated experiments may allow the identification of threshold values for select SQ parameters and thus move SQ interpretation beyond relative comparisons of soils with similar inherent properties.
Acknowledgements
We thank the participating farmers for their insights and cooperation, and K.R. Islam for his assistance with the laboratory analyses. This work was partially supported by the USDA Sustainable Agriculture Research and Education grant 960119-7073. This article is a contribution of the Maryland Agricultural Experiment Station.