INTRODUCTION
Understanding the dispersal capacity of marine organisms is the most widely researched, albeit least understood area in marine ecology (Cowen & Sponaugle, Reference Cowen and Sponaugle2009; Hellberg, Reference Hellberg2009; Buston & D'Aloia, Reference Buston and D'Aloia2013; Crook et al., Reference Crook, Lowe, Allendorf, Eros, Finn, Gillanders, Hadwen, Harrod, Hermoso, Jennings, Kilada, Nagelkerken, Hansen, Page, Riginos, Fry and Hughes2015). Dispersal patterns govern population connectivity, which in turn influences important ecological and evolutionary processes (Levin, Reference Levin2006). As such, the study of dispersal dynamics is fundamental to marine biodiversity and conservation research where it can help distinguish distinct genetic lineages which are of evolutionary importance when designing Marine Protected Areas (MPAs) (Palumbi, Reference Palumbi2003; Von der Heyden, Reference Von der Heyden2009). Understanding the dispersal capacity of an organism is also crucial for assessing the invasion potential of non-indigenous species (NIS) as it can serve as a reliable proxy for measuring connectivity and genetic diversity in recently introduced populations (Roman & Darling, Reference Roman and Darling2007). In many fish and invertebrates, larval movement is ultimately responsible for dispersal on both local and regional scales and for sessile animals such as tunicates, barnacles and sponges, to name a few, it is the sole means of natural dispersal. However, due to the large numbers and minute sizes of larvae, along with the vast expanse of the world's oceans, tracking and quantifying dispersal has been notoriously difficult and some would argue, impossible (Cowen & Sponaugle, Reference Cowen and Sponaugle2009; Metaxas & Saunders, Reference Metaxas and Saunders2009; Selkoe & Toonen, Reference Selkoe and Toonen2011). As a result, alternative approaches have been developed which offer indirect but pragmatic estimates of connectivity.
Population genetics has emerged as one of these alternatives and has proven to be a powerful tool for measuring dispersal in the marine realm (Levin, Reference Levin2006). When estimating dispersal capacity, population genetics assumes that larval dispersal patterns follow traditional metapopulation models (e.g. island, stepping stone, etc.) and that the movement of alleles can be traced back to the natural movement of individuals. The use of mitochondrial genetic markers (mtDNA) and nuclear genetic markers (nDNA) are often employed. MtDNA markers such as the cytochrome b (Cyt b) and cytochrome c oxidase I (COI) genes have high rates of sequence evolution and are often used to gain insights into past events that have helped shape current genetic patterns (Avise, Reference Avise2009). These markers are often integrated into a ‘molecular clock’ which can provide divergence estimates that parallel important geological events such as sea level rise and glacial retreats. In contrast, nDNA markers such as SNPs (single nucleotide polymorphisms) show more variability when used in large quantities and are used to gain insights into the contemporary movement of organisms. Higher resolution nuclear markers such as AFLPs (Amplified Fragment Length Polymorphisms) and microsatellites are much more variable than both mitochondrial genes and SNPs and usually provide deeper insights into recent dispersal events. While there is no ‘ideal’ marker, utilizing both mtDNA in combination with nDNA markers provides a more holistic understanding of the genetic architecture and connectivity patterns of populations (Karl et al., Reference Karl, Toonen, Grant and Bowen2012).
The results of population genetic studies are often interpreted within the context of the species’ larval developmental strategy. For example, traditional life history theory posits that organisms producing larvae with long planktonic larval duration (PLD) phases will be able to disperse to far distances and therefore be expected to show high levels of connectivity among spatially separated populations. This was based on the assumption that larvae act as passive particles and are at the mercy of the diffusive forces of the pelagic environment (Selkoe & Toonen, Reference Selkoe and Toonen2011). In contrast organisms that exhibit abbreviated larval development (short PLDs) or direct development (no planktonic phase) are expected to show high recruitment rates and hence low levels of population connectivity. A meta-analysis by Shanks (Reference Shanks2009) provides the most comprehensive dataset thus far showing an acceptable correlation (R 2 = 0.48) between PLD and dispersal distance. While genetic studies have found this to be true for many cases, recent studies have shown increasing numbers of exceptions. These exceptions are important because they allude to a more complex picture of dispersal in the marine realm. For example, environmental heterogeneity such as haloclines, thermoclines, strong current systems, vertical stratification of the water column, bathymetry and upwelling cells are all oceanographic features that can act as dispersal barriers, limiting connectivity of a species regardless of PLD (Robinson et al., Reference Robinson, Elith, Hobday, Pearson, Kendall, Possingham and Richardson2011). These barriers are sometimes known as phylogeographic breaks because they are usually associated with known biogeographic boundaries that can limit gene flow, thereby facilitating the formation of distinct genetic lineages (Figure 1). On the other end, unorthodox dispersal vectors such as rafting have been shown to significantly increase population connectivity of species that produces larvae with short PLDs phases or are direct developers (Nikula et al., Reference Nikula, Spencer and Waters2013; Cumming et al., Reference Cumming, Nikula, Spencer and Waters2014; McDonald et al., Reference McDonald, Winter, Ashcroft and Spencer2015). Independent of the aforementioned factors, genetic estimates of dispersal are further complicated by issues such as inadequate and inaccurate taxon sampling (the latter refers to potential cryptic species) (Wysor et al., Reference Wysor, Kooistra and Fredericq2002; Wrange et al., Reference Wrange, Charrier, Thonig, Alm Rosenblad, Blomberg, Havenhand, Jonsson and Andre2016), chaotic genetic patchiness, where significant genetic structure is observed in the absence of dispersal barriers (Kesaniemi et al., Reference Kesaniemi, Hansen, Banta and Knott2014) and asymmetric dispersal patterns, where diversity across sites is wholly driven by diversity at upstream locations thereby masking true patterns of connectivity and demography (Pringle & Wares, Reference Pringle and Wares2007; Wares & Pringle, Reference Wares and Pringle2008).
Examples of phylogeographic breaks on the southern African coast. Breaks coincide with the major biogeographic boundaries that separate cool-temperate waters of the Atlantic coast from the warm-temperate south coast and the warm-temperate south coast from the sub-tropical and tropical coasts of the Indian Ocean. Map modified from Teske et al. (Reference Teske, Von der Heyden, McQuaid and Barker2011).

A recent study by David et al. (Reference David, Matthee, Loveday and Simon2016) coined the term cryptic dispersal – a phenomenon where the anthropogenic movement of organisms via vectors such as the aquaculture trade and transfer of ballast water may erode phylogeographic signal, thereby reducing the power of genetic markers and in doing so render gene flow and genetic connectivity estimates inaccurate. Cryptic dispersal therefore adds another dimension of complexity to dispersal dynamics in the marine realm. The primary aim of this review is to formally introduce the concept of cryptic dispersal, highlight some of the more recent studies that are either potential or definitive cases of cryptic dispersal and briefly discuss the evolutionary consequences of this phenomenon. This review does not aim to exhaustively review the effects of introductions on the genetic architecture of populations, as this general topic has received considerable coverage in the literature, but rather to hone in on the least understood and most inconspicuous effect of human-mediated introductions. In this review, we distinguish ‘intentional’ vectors such as aquaculture and shipping from rafting and attachment to floating structures, which are often inconsistent and have both a biological (e.g. floating kelp bodies) and human (e.g. driftwood) component.
ANTHROPOGENIC MOVEMENT AS A POWERFUL AGENT OF GENE FLOW
Large scale human-mediated movement of marine organisms has occurred for centuries with the emergence of the first wooden ships capable of harbouring communities of fouling organisms such as bryozoans, sponges, algae, barnacles, molluscs and tunicates (Carlton, Reference Carlton1989). After the 20th century, the ‘dry’ ballast of ships was later replaced with water which allowed planktonic organisms including the larval stages of a variety of species to be pumped in and transported to sites located thousands of kilometres away from their native habitats. Surveys by Carlton (Reference Carlton1989) and colleagues at the Oregon Institute of Marine Sciences had found over 200 species in ship ballast destined for Oregon from Japan; all of which survived the trip. Also, a report by Chu et al. (Reference Chu, Tam, Fung and Chen1997) found a total of 81 species distributed among five cargo containers in the Pacific destined for Hong Kong. In the last 20 years however, there has been a fourfold increase in the growth of transoceanic shipping, partly driven by technological advancements that have produced larger and faster ships and partly by the rapid pace of globalization that has opened up new international trade routes (Tournadre, Reference Tournadre2014; Cope et al., Reference Cope, Prowse, Ross, Wittmann and Cassey2015) (Figure 2). For example, a recent survey of hull fouling by Ashton et al. (Reference Ashton, Davidson, Geller and Ruiz2016) estimated 680,000 arrivals per year of barnacle species at ports distributed across the Atlantic and the Pacific coasts. Considering that only 15 commercial vessels were sampled, it is likely that this number was an underestimate. The most important ecological consequence of transoceanic shipping is the increased introductions of NIS which has subsequently resulted in higher rates of invasion events (Roman & Darling, Reference Roman and Darling2007).
Overall density map showing global vessel traffic for the year 2015 based on AIS satellite data.

In addition to shipping, the aquaculture trade has also been an important vector for the movement of organisms both regionally and globally (Elton, Reference Elton1958; Grosholz et al., Reference Grosholz, Crafton, Fontana, Pasari, Williams and Zabin2015). Commercial shellfish such as oysters, abalone and mussels are often transported across long distances for transplantation purposes. These shellfish may harbour a variety of organisms which can reside within or inside crevices of the shells, in mudpacks that accompany brood stocks or even within the organism itself. For example, the introduction of the Pacific oyster Crassostrea gigas to Europe resulted in the arrival of more than a dozen NIS, with about five or six eventually becoming established (Wolff & Reise, Reference Wolff, Reise, Leppakoski, Gollasch and Olenin2002). In a more recent episode, the polychaete Diopatra biscayensis in France was able to expand its range across a phylogeographic break due to anthropogenic transport on mussel seed ropes (Woodin et al., Reference Woodin, Wethey and Dubois2014).
While marine invasions are an important consequence of anthropogenic movement of NIS, a more conspicuous phenomenon is the erosion of phylogeographic signal due to continuous and consistent movement of migrants (Wares et al., Reference Wares, Goldwater, Kong and Cunningham2002; Dawson et al., Reference Dawson, Gupta and England2005; David et al., Reference David, Matthee, Loveday and Simon2016; Wrange et al., Reference Wrange, Charrier, Thonig, Alm Rosenblad, Blomberg, Havenhand, Jonsson and Andre2016). This phenomenon is coined as ‘cryptic dispersal’ since the anthropogenic effect cannot be definitively detected by genetic patterns alone (David et al., Reference David, Matthee, Loveday and Simon2016). Cryptic dispersal is primarily driven by propagule pressure and also by the coastal environment, specifically the strength of phylogeographic breaks. If two distinct populations of a species are separated by a strong break, isolated introductory events that exchange propagules from both populations will probably not significantly alter genetic structure and such introductions could be easily detected by genetic markers (Darling et al., Reference Darling, Bagley, Roman, Tepolt and Geller2008; Reitzel et al., Reference Reitzel, Darling, Sullivan and Finnerty2008; Reusch et al., Reference Reusch, Bolte, Sparwel, Moss and Javidpour2010). However, if these introductory events become continuous and consistent, closely mimicking metapopulation migration models (e.g. stepping stone and island models), then phylogeographic signal may become eroded, driving down Wright's fixation index (F ST values) and giving the illusion of low genetic structure and high connectivity. Furthermore, if cryptic dispersal has been occurring across longer timescales, even genetic patterns inferred from mtDNA may be obscured via reshuffling of ancient haplotypes due to past translocation events (David et al., Reference David, Matthee, Loveday and Simon2016; Williams et al., Reference Williams, Matthee and Simon2016; Wrange et al., Reference Wrange, Charrier, Thonig, Alm Rosenblad, Blomberg, Havenhand, Jonsson and Andre2016).
Cryptic dispersal highlights an important limit to population genetics, which is that the movement of genes does not necessarily correlate with natural movement. This is an important point because it opens up the possibility of drawing grossly inaccurate interpretations of dispersal patterns from genetic data in regions where distinct barriers exist. Perhaps the most vulnerable population genetic studies are those that ‘detect’ a panmictic population, which is defined as naturally dispersed endemic populations that freely interbreed due to the absence of dispersal barriers. In these studies, introductory events may be suggested as an after-thought or never at all and the lack of structure is usually attributed to the species’ ‘strong dispersal capabilities’. For example, studies by Wrange et al. (Reference Wrange, Charrier, Thonig, Alm Rosenblad, Blomberg, Havenhand, Jonsson and Andre2016) found high frequency of shared mtDNA and microsatellite haplotypes in globally separated populations of the barnacle Balanus improvisus which produces planktonic larvae. This genetic pattern was primarily attributed to anthropogenic dispersal mechanisms, despite the fact that the authors were unable to definitively distinguish between oceanographic connectivity and anthropogenic dispersal. Another recent genetic study by Hudson et al. (Reference Hudson, Viard, Roby and Rius2016) found little genetic differentiation in the tunicate Ciona intestinalis which exhibits abbreviated development. Interestingly, this study was carried out in C. intestinalis’ native range but again, the authors were unable to determine whether the observed genetic pattern was attributed to anthropogenic or natural dispersal. An interesting phylogenetic and phylogeographic study by Ciotir & Freeland (Reference Ciotir and Freeland2016) on invasive cattails recently described the process of ‘cryptic intercontinental dispersal’ where the horticulture trade was responsible for the widespread dispersal of a variety of cattail species. However, like the previous two studies, much of the data on phylogeographic signal was inconclusive.
The most obvious solution to the cryptic dispersal problem will be the development of a tool that can discern the relative contribution of both natural and anthropogenic dispersal types to the observed genetic patterns of a population. To accomplish this from the anthropogenic side one would need to be able to quantify the number of migrants of the study species being carried in each ship's ballast per route. However, considering the sheer amount of shipping traffic that occurs along a typical coastal system combined with the millions of tons of ballast water that are pumped in and out per trip – even with environmental DNA (eDNA) as a monitoring tool for identification, such a task would be logistically impossible. An interesting study by Darling et al. (Reference Darling, Herborg and Davidson2012) attempted to investigate possible correlations between vector patterns and genetic connectivity of an invasive tunicate (Styela clava) in the north-eastern Pacific. The authors compiled shipping data (specifically vessel routes) for the north-eastern Pacific which was then used to create a shipping connectivity matrix of the region. Their results showed that the genetic data failed to capture the anthropogenic effects of shipping, which supports the aforementioned view that such an approach for evaluating cryptic dispersal is problematic and in many cases impractical. With respect to aquaculture, the task of tracking shellfish movement is considerably less onerous than large transoceanic shipping vessels. In addition, the shellfish in a brooding stock that were transplanted can be examined individually and the target hitchhiker species can be quantified and processed for genetic studies. However, there are currently no known studies that have carried out experimental transplants to this extent and is therefore an area ripe for future research.
EVOLUTIONARY CONSEQUENCES OF CRYPTIC DISPERSAL
Populations that are separated by phylogeographic breaks are genetically differentiated units that are locally adapted to their environment (Irwin, Reference Irwin2012). While these distinct units may show some level of phenotypic divergence such as size or colour variation, gene-flow ‘leakage’ across dispersal barriers is enough to prevent speciation events. In a system where cryptic dispersal is occurring, we would expect that these dispersal barriers will be weakened. This weakening would occur as human-mediated transport (e.g. ballast water transfer) delivers a sufficient number of propagules to overcome local adaptation. If propagules are being transported in this manner, then populations can be homogenized via some form of reverse speciation which was defined as ‘a reversal of the processes that lead to the diversification of species pairs’ (Taylor et al., Reference Taylor, Boughman, Groenenboom, Sniatynski, Schluter and Gow2006). This is important to consider because genetic homogenization ultimately results in a loss of genetic diversity. For example, in many population genetic studies, a source population is often the one that has the highest haplotype or nucleotide diversity. However, if cryptic dispersal is occurring then not only is phylogeographic signal being diluted but ‘original’ haplotypes of the source population are being distributed and re-distributed across multiple sink populations at a high enough frequency to obfuscate the detectability of a distinct source. If genetic variation supplies the raw material for evolution, then it follows that cryptic dispersal could reduce the evolutionary potential of an entire species. For example, a review of the aquaculture industry with regards to introductions highlighted the dangers of repeated translocations in fish stocks where such activities can reduce genetic diversity of commercially important species (Johnson, Reference Johnson2000).
Here, we would like to emphasize that the reduction in the evolutionary potential of a species due to cryptic dispersal is a phenomenon that is expected to occur largely in introduced species, where a history of vector transport has already been established. While dispersal in the native habitats could also be candidates, detection may be more difficult due to the longer evolutionary histories of these species. Interestingly, if multiple introductions are the driving force behind the homogenization process, there is the possibility that the expected reduction in genetic diversity could be buffered by individuals arriving and carrying unique haplotypes from a completely different source. A recent study by Lejeusne et al. (Reference Lejeusne, Saunier, Petit, Beguer, Otani, Carlton, Rico and Green2014) illustrated such a scenario where high levels of gene flow were detected in a Palaemonid shrimp using the COI genetic marker. The authors also found high genetic diversity which was attributed to multiple introductions with international shipping being the culprit vector. Another recent study by David et al. (Reference David, Matthee, Loveday and Simon2016) used the cytochrome b gene and a single nuclear locus to detect high genetic connectivity among populations (no geographic patterning of haplotypes) of a shell-boring polychaete distributed across three phylogeographic breaks in South Africa. The movement of oysters among aquaculture farms distributed along the country's ~2000 km coastline was identified as the main driver of this high connectivity (David et al., Reference David, Matthee, Loveday and Simon2016; Williams et al., Reference Williams, Matthee and Simon2016). Despite the high connectivity levels, genetic diversity was low which was probably due to the homogenizing effect of cryptic dispersal along with a lack of individuals arriving from genetically distinct sources.
Adaptability also plays an important role in the cryptic dispersal capacity of a species since propagules would not only have to be consistently transported across phylogeographic breaks, but would also have to survive and thrive in the different biogeographic regions. For example, in the case of P. hoplura, experimental studies found that the species was capable of surviving in temperatures as low as 12°C and as high as 24°C, with both temperatures characteristic of the Atlantic Ocean on the west coast of the country and the Indian Ocean on the east coast respectively (David & Simon, Reference David and Simon2014). It is therefore not surprising that the high genetic connectivity observed in this species could have been mistaken for panmixia.
INTEGRATING OCEAN MODELS INTO POPULATION GENETIC STUDIES TO DETECT CRYPTIC DISPERSAL
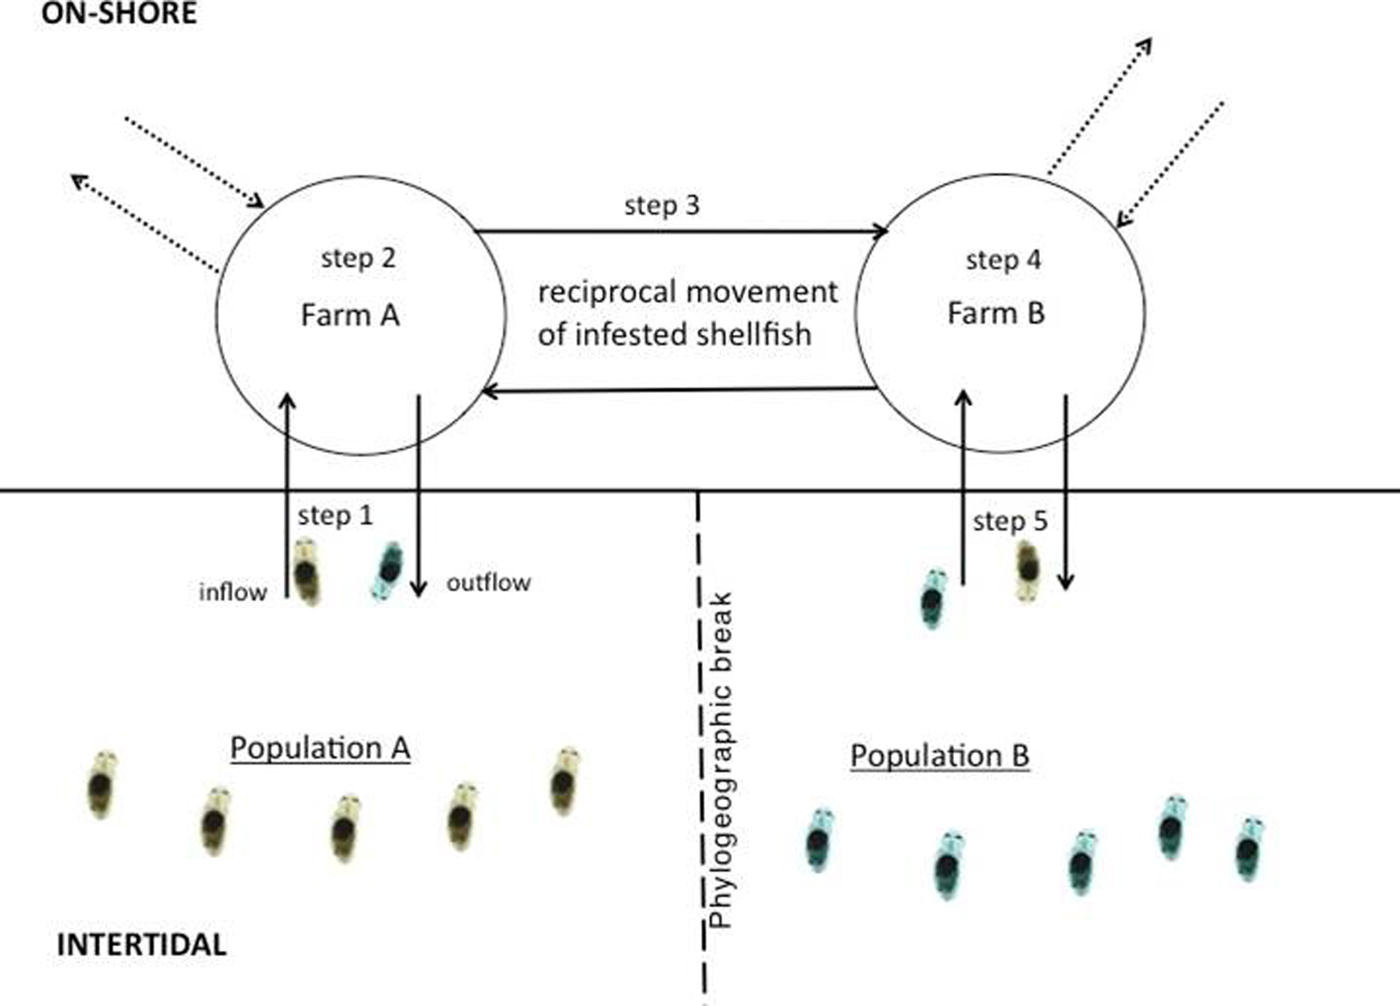
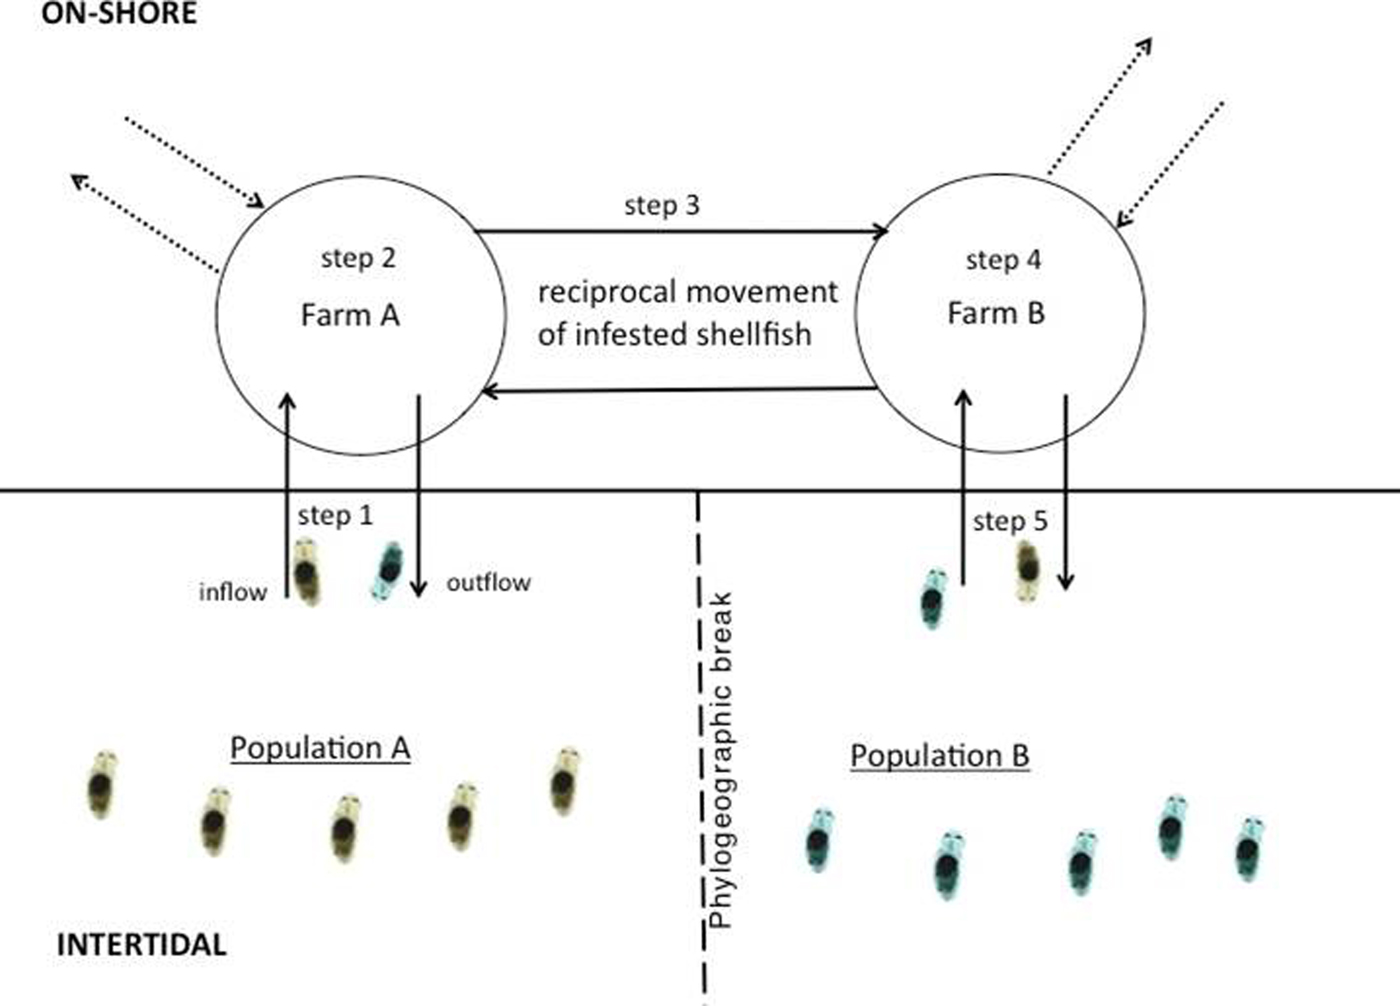
The most practical method for assessing cryptic dispersal will involve focusing on natural movement – a process which can be numerically modelled. Studies integrating high resolution larval transport models (LTM) into population genetic studies to measure dispersal have been on the rise in the past few years, partly due to advances in computing capabilities and the costs associated with accessing them (Baums et al., Reference Baums, Paris and Cherubin2006; Galindo et al., Reference Galindo, Olson and Palumbi2006; Viard et al., Reference Viard, Ellien and Dupont2006; Selkoe et al., Reference Selkoe, Henzler and Gaines2008; White et al., Reference White, Selkoe, Watson, Siegel, Zacherl and Toonen2010). Because LTMs incorporate the prevailing hydrographic conditions of the study area, they add a high degree of oceanographic realism to dispersal studies, which is especially important for understanding contemporary movement of larvae (Selkoe et al., Reference Selkoe, Henzler and Gaines2008). LTMs coupled with population genetics offer a powerful means of assessing cryptic dispersal since a larval transport model can act as a control, depicting what connectivity patterns should look like in the absence of anthropogenic movement. Once connectivity patterns are determined based on the model, they can be cross validated with genetic patterns. One of the first comprehensive studies to utilize this approach was conducted by Dawson et al. (Reference Dawson, Gupta and England2005) who assessed the population structure of a supposedly highly dispersed cosmopolitan jellyfish, Aurelia sp. The authors, using mtDNA and a single nDNA loci, found high levels of genetic connectivity among global subpopulations. However, their larval transport model showed limited connectivity that coincided with known phylogeographic breaks, indicating that multiple introductory events over a longer time scale, possibly via shipping vectors, could have eroded the phylogeographic signal, giving the illusion of a panmictic population (Dawson et al., Reference Dawson, Gupta and England2005). In a similar but more recent study, David et al. (Reference David, Matthee, Loveday and Simon2016) found that the aquaculture trade in South Africa was facilitating genetic connectivity in the invasive polychaete Polydora hoplura, which is notorious for burrowing and residing in oyster and abalone shells. The authors found a lack of any clear geographic patterning of haplotypes and low FST despite the fact that populations were distributed across multiple phylogeographic breaks. However, a high-resolution transport model found limited connectivity that coincided with these breaks. It was known at the time that oyster farmers frequently transported their stock among farms that are widely distributed along the country's coast and in a non-directional manner (Simon et al., Reference Simon, Ludford and Wynne2006; Haupt et al., Reference Haupt, Griffiths, Robinson and Tonin2010). This movement resulted in the polychaete being moved with the oysters, across the breaks, consequentially resulting in a reduction in signal and an elimination of any geographic clustering of haplotypes (Williams et al., Reference Williams, Matthee and Simon2016) (Figure 3).
Cryptic dispersal of the shell-boring polychaete Polydora hoplura in South Africa via the aquaculture trade. Step 1: planktotrophic larvae enter shellfish farm through the inflow; step 2: larvae settle, undergo metamorphosis and burrow into farmed oysters; step 3: infested oysters are transported to geographically distant farm; step 4: brooding females release larvae into the water column; step 5: fraction of larvae escapes into the wild via the outflow. Dashed arrows refer to spat or adult oysters imported into the farm (locally and internationally) and exported to other farms in the region.
While the aforementioned studies used discordance between the LTMs and genetics to propose the existence of cryptic dispersal, others have ruled out cryptic dispersal when both approaches show congruent results. For example, Viard et al. (Reference Viard, Ellien and Dupont2006) assessed the dispersive capacity of the introduced gastropod, Crepidula fornicata along the French coast using microsatellites and a simple 2D hydrographic model. The authors found that low FST values (high genetic connectivity) correlated with the model's estimate of extensive dispersal along the coast and assumed that the pattern was a direct result of the larva's dispersal capabilities. However, this study explicitly assumed that there was no anthropogenic transport occurring and it was conducted using a 2D model on a regional scale.
High resolution LTMs are based on Lagrangian mechanics, which present a 3D numerical representation of velocities at different depths (Siegel et al., Reference Siegel, Kinland, Gaylord and Gaines2003). Larvae are represented by virtual floats, which are deployed at specific localities in the model. Dispersal simulations are then carried out and repeated for a number of years using the available ocean circulation data for each year (Figure 4). Valuable data concerning connectivity patterns include dispersal trajectory and density maps along with particle capture data which can be analysed both qualitatively and quantitatively. The complexity of the model can be increased by incorporating specific biological characteristics into the floats, such as duration in the plankton (which determines how far the floats will be carried by surface currents), mortality rates (which will determine the number of floats that would be ‘captured’ at a pre-determined site) and fecundity (which determines the number of floats per simulation run). The most recent generation of transport models that are often used in conjunction with population genetics is the Regional Oceanic Modeling System (ROMS) (Shchepetkin & McWilliams, Reference Shchepetkin and McWilliams2005; Baums et al., Reference Baums, Paris and Cherubin2006; Selkoe et al., Reference Selkoe, Henzler and Gaines2008). While model predictions can offer valuable insights into the ‘pure’ movement of larvae, it is important to note that ocean models, like all computer models, do possess limitations. For example, LTMs are limited by the knowledge of important ecological processes involved in dispersal. In other words, how well do we know our study species? Many species, especially fishes can produce larvae that do not act as passive floaters and are capable of counteracting the advective effects of currents by actively adjusting their orientation in the water column or exhibiting diel vertical migrations (Levin, Reference Levin2006). In such cases, incorporating appropriate life history parameters into the virtual floats along with adding drag-drift effects into the simulations is essential for accurately modelling dispersal in such a species. Perhaps the biggest limitation is that for models to be as accurate as possible, they need to be able to fully capture coastal processes, especially nearshore circulation patterns which are responsible for determining particle trajectory and supply/recruitment results.
Ocean circulation model built using the Regional Oceanic Modeling System (ROMS). Model shows 289,788 possible trajectories of virtual floats that were recovered after being deployed at three sites along the southern African coast (Jacobsbaai, Hermanus and Haga Haga) with the Cape Point phylogeographic break highlighted. Total of 1271 floats were deployed each month from 1991–2010.

The strength of using seascape genetics to detect cryptic dispersal lies in the power of cross-validation. If populations show limited dispersal based on LTM estimates but show high connectivity based on the genetic data (e.g. low non-significant FST, non-significant isolation by distance and mixed haplotypes), it is likely that cryptic dispersal is occurring. However, this approach is only useful if connectivity patterns are discordant. In scenarios where high connectivity is estimated by both population genetic studies and LTMs, it would be virtually impossible to discern the contributions of anthropogenic transport to the observed genetic pattern. One possible solution would be to integrate both physical oceanography and population genetic data into a time-step model that includes an estimate of the number of propagules being transported in a vessel at any given time. As computing power continues to increase, we expect the development of these types of complex predictive models to emerge within the field of marine invasion biology, which would greatly aid in providing informative data that can be used to mitigate the loss of diversity caused by cryptic dispersal.
CONCLUSIONS
Over the last few decades, genetics has provided crucial data on the dispersal potential and connectivity patterns of a great number of species. This has given us novel insights into important marine ecological process and has challenged us to re-evaluate conservation methodologies such as the way marine reserves are designed. However, as humans continue to affect every aspect of the marine environment, especially through biological invasions, the need for cross-disciplinary collaboration is crucial in order to respond to these new challenges. Here we highlighted the phenomenon of cryptic dispersal, where multiple introductory events can mimic traditional migration models, thereby diluting or eroding phylogeographic signal which gives the illusion of a naturally dispersing species. Such a phenomenon is problematic since the erosion of dispersal barriers can allow contact between spatially separated populations, thereby initiating the homogenization process. In order to solve this problem, we outlined the importance of utilizing both population genetics and larval transport models (LTMs). These LTMS will not only be able to act as a control to detect cryptic dispersal but has also been shown to elucidate fine scale ocean processes that can be related back to genetic patterns (Gilg & Hilbish, Reference Gilg and Hilbish2003). While previous studies have focused on the novelty of using this integrated approach (White et al., Reference White, Selkoe, Watson, Siegel, Zacherl and Toonen2010), here we call for such an approach to be regarded as the gold standard for evaluating connectivity patterns on large and complex coastal systems.
ACKNOWLEDGEMENTS
We would like to thanks Dr Jon Wares and another anonymous reviewer for greatly improving the final version of this manuscript. We would also like to thank MarineTraffic for their assistance in developing the shipping density map and Dr Tamara Robinson for valuable input.