




Introduction
Maternal nutrition is the exclusive source of nutrients for fetal development during gestation, directly regulating fetal growth and exerting prolonged, and often lifelong, effects on offspring phenotype (Zhang et al. Reference Zhang, Heng and Song2019). Key physiological processes such as insulin sensitivity, glucose metabolism, and lipid metabolism are notably influenced (Jiao et al. Reference Jiao, Lu and Hao2024). Skeletal muscle, which is critical for postnatal meat quality and whole-body energy metabolism, undergoes a critical window of developmental plasticity during gestation and is particularly susceptible to maternal nutritional regulation. Studies have demonstrated that maternal nutritional strategies can directly influence offspring muscle development, energy metabolism, and lipid deposition patterns, ultimately shaping meat quality traits (Yan et al. Reference Yan, Guo and Yin2023).
Given persistent fluctuations in the prices of corn and soybean meal, the global swine industry is increasingly seeking sustainable alternatives to these conventional ingredients (Mordenti et al. Reference Mordenti, Martelli and Brogna2012; Nasir et al. Reference Nasir, Kamaruddin and Zakarya2022; Shuai et al. Reference Shuai, Chen and Yu2023; Tao et al. Reference Tao, Wang and Luo2024). Consequently, the development and utilization of unconventional feed ingredients have gained considerable attention. For instance, research indicates that wheat, a viable alternative energy source, is more digestible than corn in vitro digestion models using growing pigs (Tu et al. Reference Tu, Chen and Zhou2025). Thus, when corn prices are high, partially or completely replacing corn with wheat can enhance feed utilization efficiency in swine production (Ma et al. Reference Ma, Li and Zhang2022). Adopting unconventional ingredients also helps mitigate “human-animal competition for grains” and represents a strategic approach to reducing feed costs and ensuring food security (Cheng et al. Reference Cheng, He and Zheng2024; Fu et al. Reference Fu, Yang and Ni2024). Therefore, replacing conventional ingredients with unconventional alternatives in gestating sow diets during periods of price volatility is a feasible strategy for maintaining economic viability (Wei et al. Reference Wei, Gao and Qin2025). However, the long-term implications of this strategy require careful evaluation, particularly its effects on offspring growth performance, slaughter traits, and meat quality, as these factors are critical determinants of profitability in swine production (Sato et al. Reference Sato, Uemoto and Kikuchi2017; Won et al. Reference Won, Jung and Park2018).
Notably, our preliminary research demonstrated that replacing corn and soybean meal with unconventional ingredients such as wheat and broken rice improves placental nutrient transport and enhances intestinal health in sows (Wei et al. Reference Wei, Gao and Qin2025). Furthermore, through the core pathway of the “maternal-offspring gut-microbiota axis,” these dietary interventions significantly promoted intestinal morphological development, increased digestive enzyme activity, and optimized the gut microbiota in neonatal piglets (Li et al. Reference Li, Wei and Mao2026). These findings establish a link between maternal intestinal health and early-life intestinal development in offspring. However, it remains unclear whether these maternal dietary interventions have sustained phenotypic effects on offspring during the growing-finishing phase. Therefore, the present study aims to investigate the effects of feeding gestating sows diets incorporating unconventional ingredients – including wheat, broken rice, rice bran meal, and rapeseed meal – on the growth performance, carcass traits, meat quality, and gut microbiota of their offspring during the growing-finishing phase, with a focus on phenotypic evaluation and safety validation of these alternative feed ingredients.
Materials and methods
The trial was conducted at the Teaching and Research Base of the Institute of Animal Nutrition, Sichuan Agricultural University, and was approved by the Sichuan Agricultural University Animal Management and Use Committee (Ethics Approval Code: SICAU2023314089).
Animals and feeding management
A total of 30 Landrace × Yorkshire sows (parity 6–7) with similar backfat thickness (16.08 ± 0.13 mm) were randomly assigned to one of three dietary treatments (n = 10) during gestation: 1) a corn-soybean meal basal diet (CON); 2) an unconventional ingredient diet (UCD); and 3) a low-protein unconventional diet (LP-UCD). The crude protein level of the LP-UCD diet was formulated to be 2 percentage points lower than that of the CON and UCD diets. Estrus was synchronized at breeding, and sows were artificially inseminated using Duroc semen. Throughout gestation, sows were housed individually in stalls (2.2 m × 0.6 m) under controlled environmental conditions (temperature: 18-22°C; relative humidity: 60 ± 5%). They were fed twice daily (08:00 and 15:00) at a rate of 2.2 kg/day from days 0 to 90, which was increased to 2.6 kg/day from day 91 until farrowing. Water was available ad libitum, and routine management included regular removal of feces, health monitoring, and disinfection. Four days before the expected farrowing date, sows were moved to the farrowing house and fasted on the day of parturition. Newborn piglets were processed uniformly (umbilical cord cut, dried, and weighed). Post-farrowing, all sows were fed a standard lactation diet ad libitum twice daily (08:00 and 15:00) with free access to water. Piglets nursed freely until weaning at 28 days of age.
At weaning, a total of 90 healthy piglets (30 piglets per maternal treatment, 3 piglets per sow) with an average body weight of 8.42 ± 0.12 kg were randomly selected from each treatment group to form the offspring cohort. These piglets were randomly allocated into 10 pens per maternal treatment, with 3 piglets per pen. All offspring were fed a common corn-soybean meal basal diet throughout the trial, resulting in three offspring groups defined by maternal diet: CON, UCD, and LP-UCD. After weaning, piglets were housed in the nursery and fed a starter diet ad libitum three times daily (08:00, 14:00, and 20:00). Upon reaching approximately 25 kg body weight, they were transferred to a growing-finishing facility and fed a grower-finisher diet ad libitum twice daily (08:00 and 15:00). Throughout all phases, pigs had free access to water. Management practices included daily cleaning of feeders and pens, regular ventilation, and weekly collection of orts to estimate feed wastage. Health monitoring and disinfection followed standard procedures. Pigs were weighed individually at the beginning and end of each phase to determine growth performance. All diets were provided in powdered form. At the end of the growing-finishing period (approximately 120 kg body weight), a subset of 21 pigs (7 pigs per maternal treatment) was randomly selected for slaughter and sample collection, with one pig chosen from seven different pens within each treatment group. Each pig was from a different sow.
Experimental diets
Diets were formulated to meet or exceed the nutrient requirements recommended by NRC (2012).
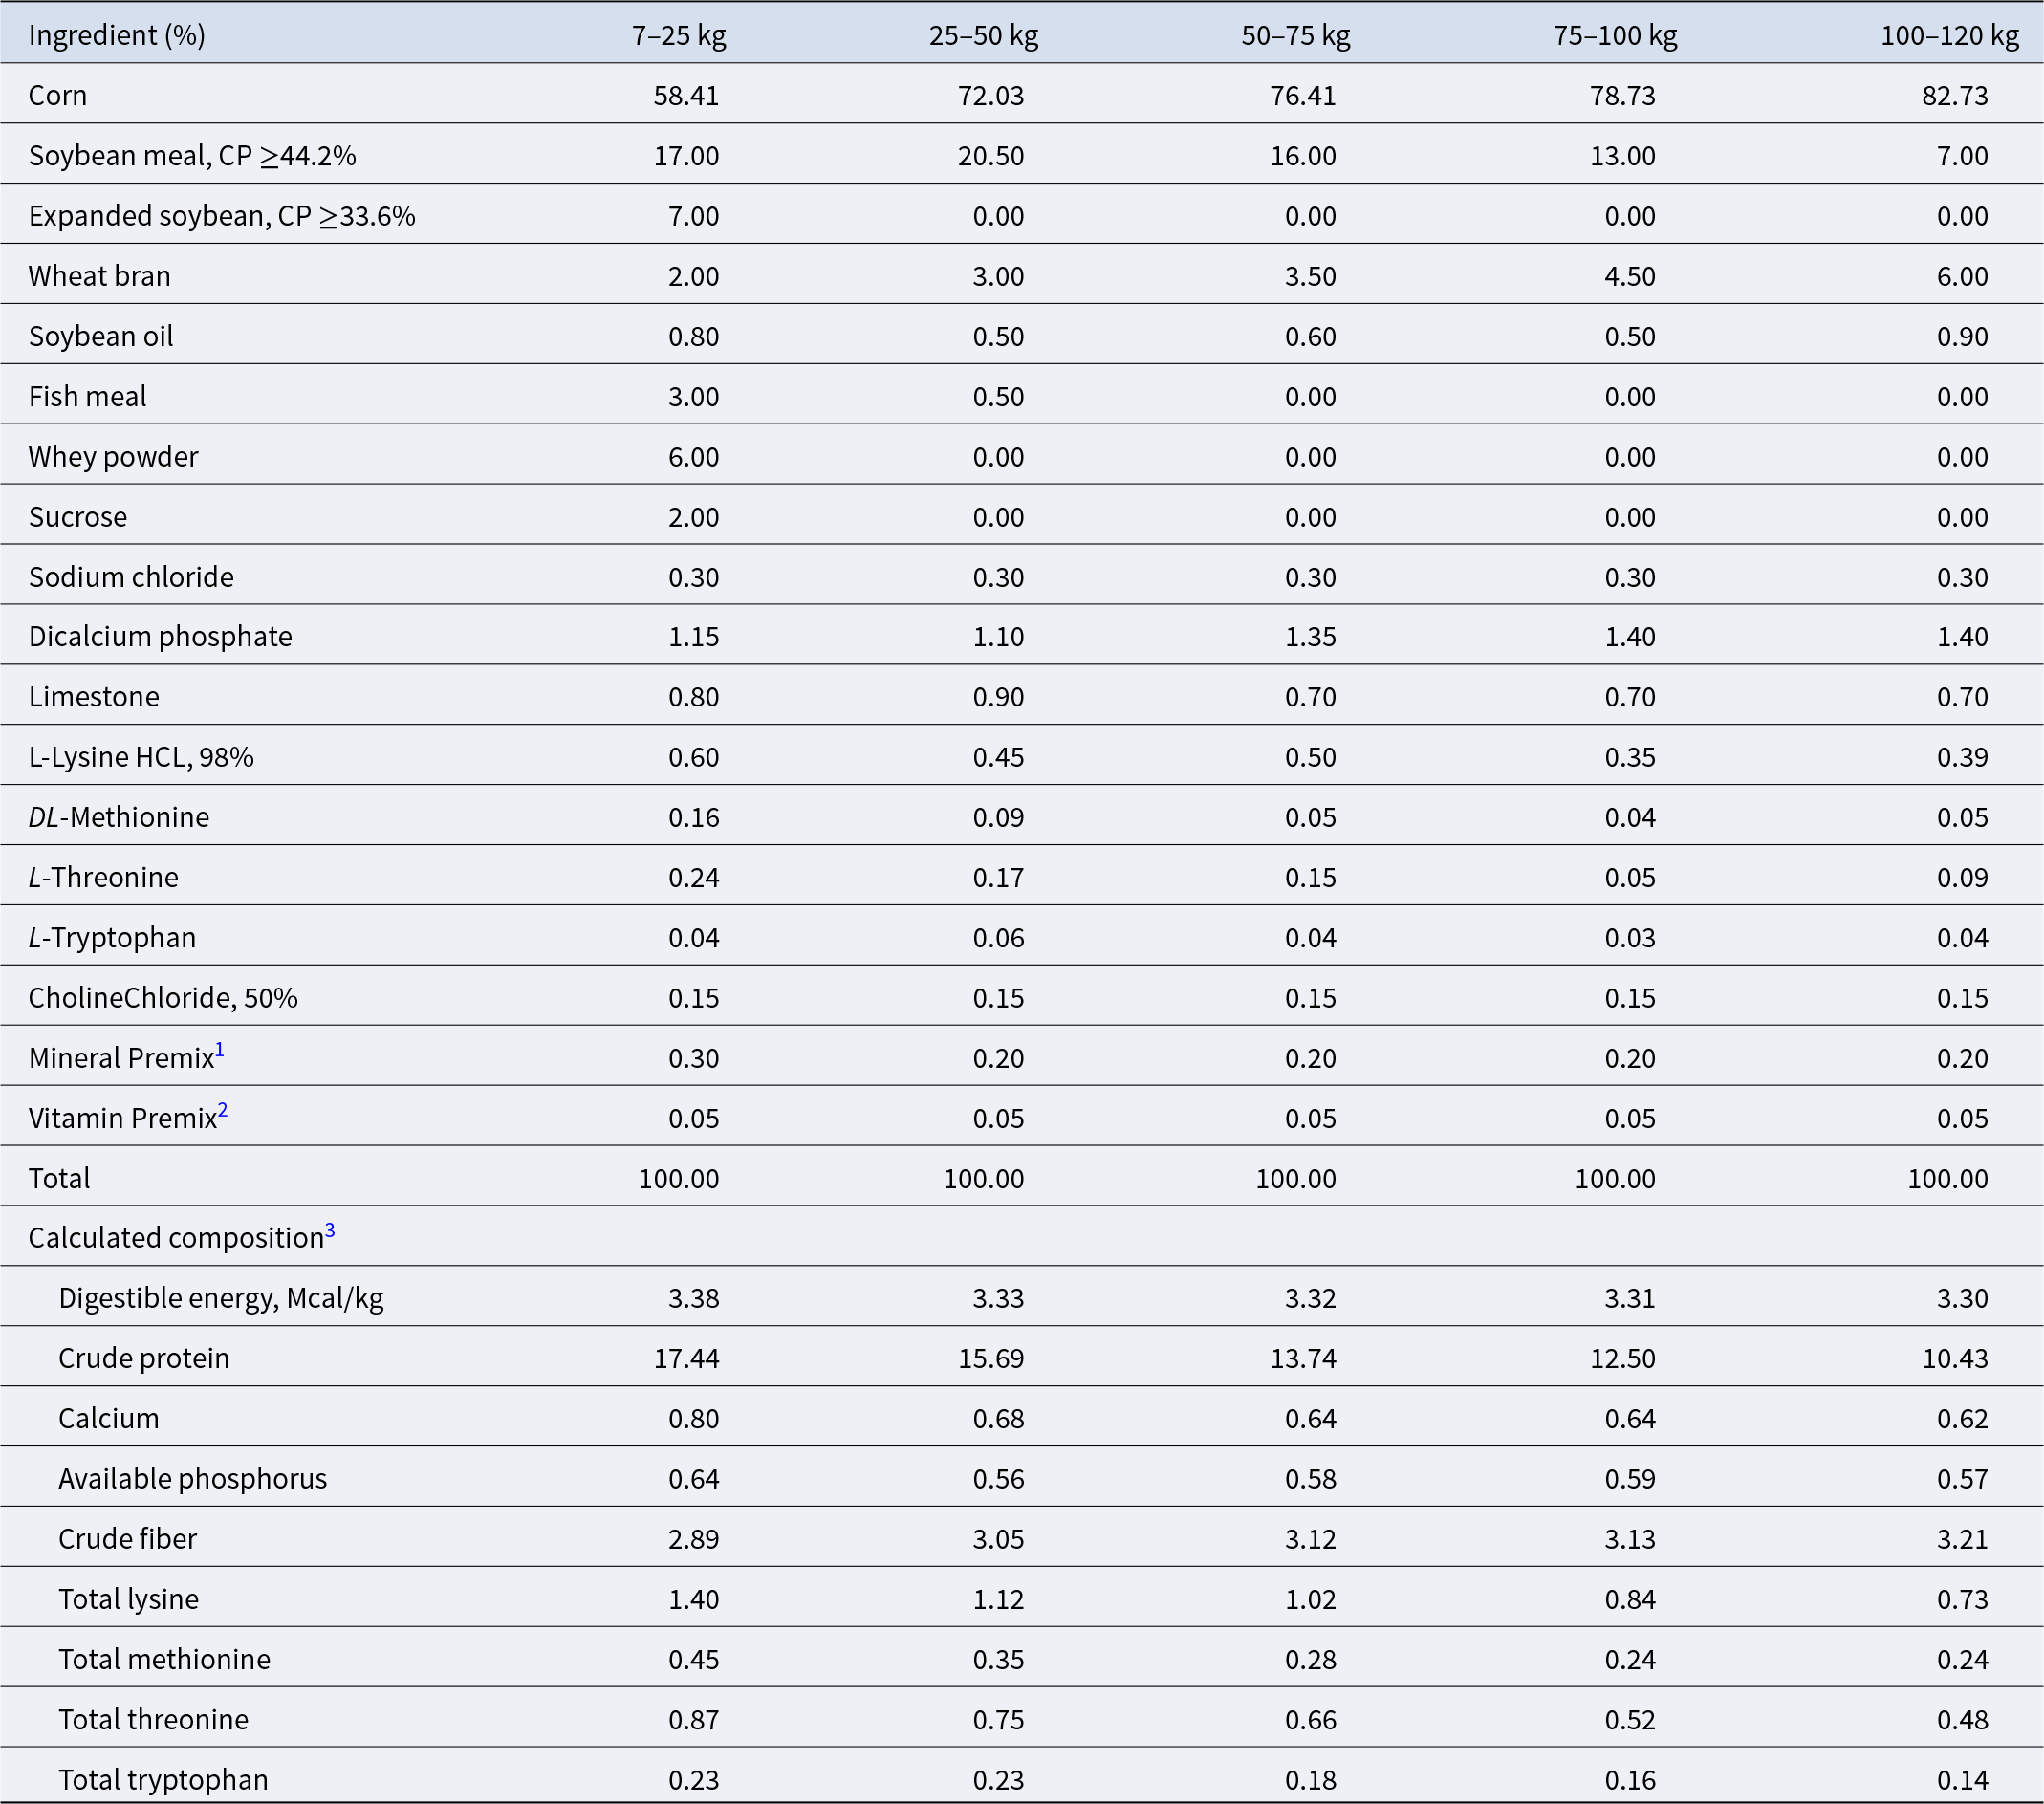
The gestation and lactation diets for sows directly followed the formulation reported by our research group (Wei et al. Reference Wei, Gao and Qin2025). The main nutritional levels were as follows: the gestation diets for the CON, UCD, and LP-UCD groups all contained 3.23 Mcal DE/kg, with crude protein (CP) levels of 13.53%, 13.53%, and 11.53%, respectively. The lactation diet for all groups contained 3.36 Mcal DE/kg and 17.03% CP. For the offspring growing-finishing pigs, diets were formulated according to the nutritional requirements for five phases: 7–25 kg, 25–50 kg, 50–75 kg, 75–100 kg, and 100–120 kg, as per NRC (2012). The specific formulations and nutritional parameters are presented in Table 1.
Ingredients and nutrient composition of diets for growing finishing pigs
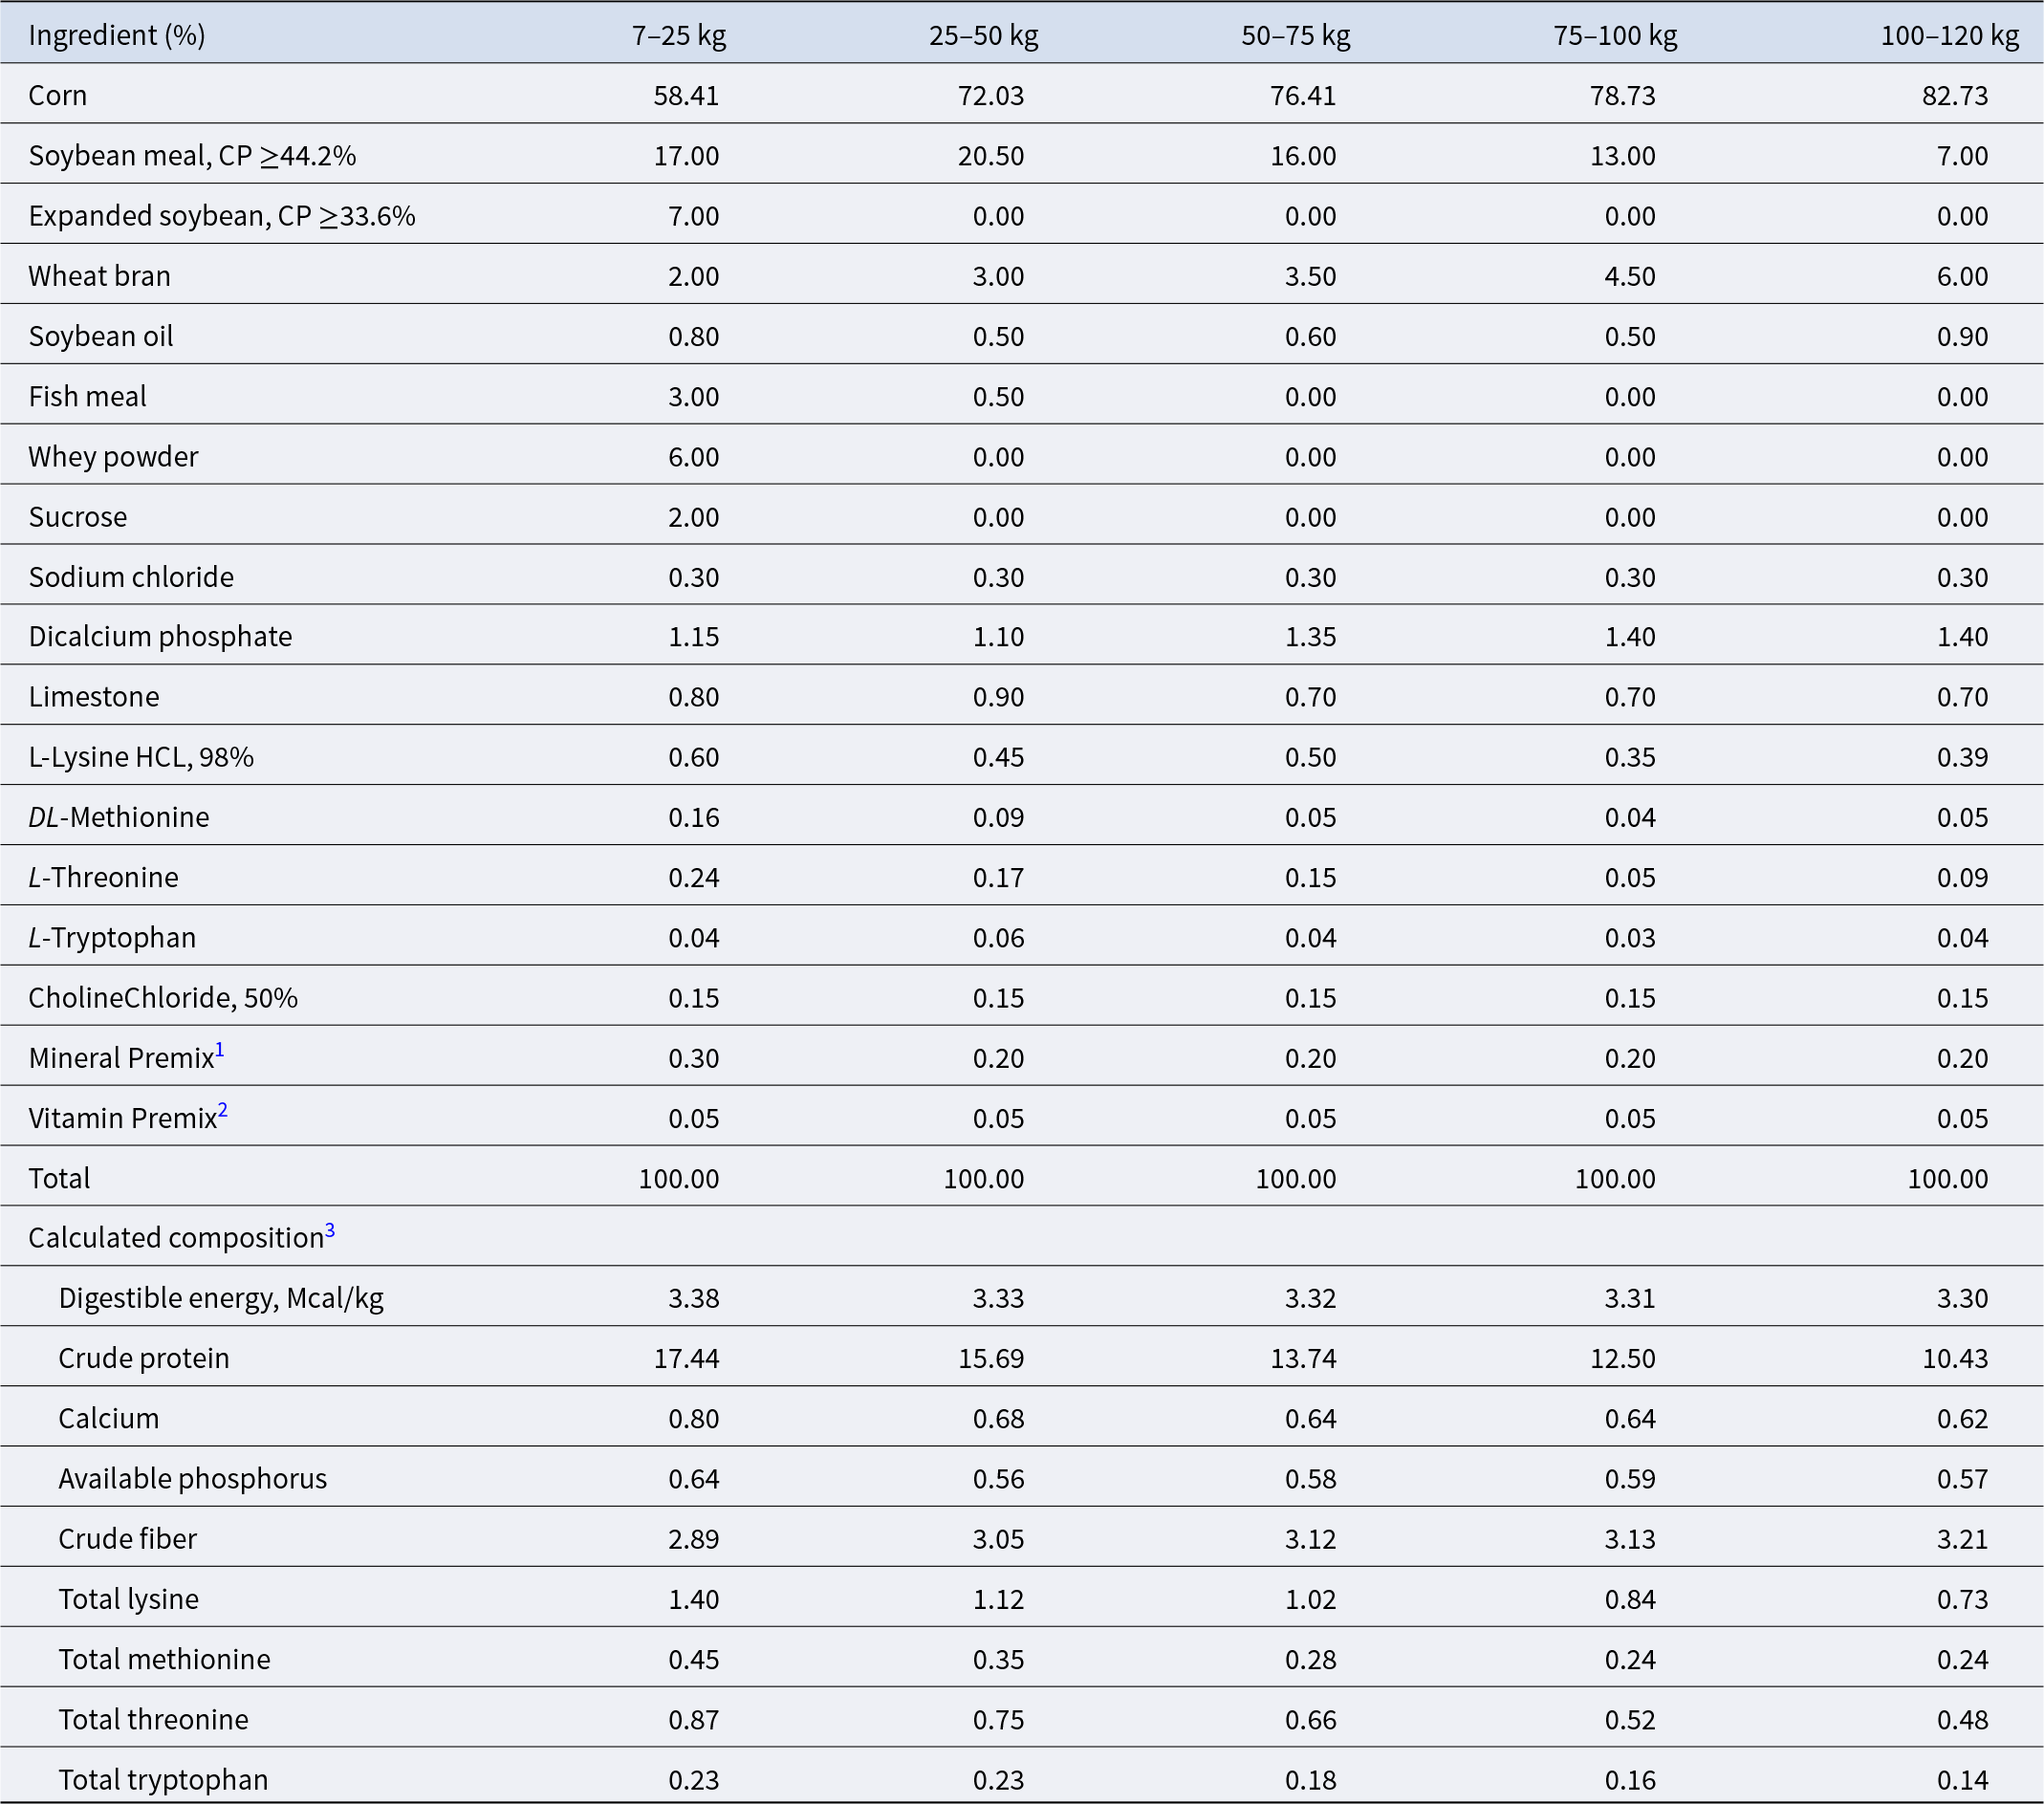
Table 1 Long description
Diet formulations are listed by ingredient percentage and calculated composition for five body weight phases: 7 to 25 kg, 25 to 50 kg, 50 to 75 kg, 75 to 100 kg, and 100 to 120 kg. Ingredient percentages include corn at 58.41, 72.03, 76.41, 78.73, and 82.73; soybean meal at 17.00, 20.50, 16.00, 13.00, and 7.00; and wheat bran at 2.00, 3.00, 3.50, 4.50, and 6.00. Expanded soybean is 7.00% only in 7 to 25 kg, and fish meal is 3.00% in 7 to 25 kg and 0.50% in 25 to 50 kg, with both at 0.00% in later phases; whey powder and sucrose are 6.00% and 2.00% only in 7 to 25 kg. Sodium chloride is 0.30% in all phases, choline chloride 50% is 0.15% in all phases, vitamin premix is 0.05% in all phases, and mineral premix is 0.30% in 7 to 25 kg then 0.20% in the remaining phases; totals are 100.00% for each phase. Calculated digestible energy in Mcal per kg is 3.38, 3.33, 3.32, 3.31, and 3.30. Calculated crude protein is 17.44, 15.69, 13.74, 12.50, and 10.43; calcium is 0.80, 0.68, 0.64, 0.64, and 0.62; and available phosphorus is 0.64, 0.56, 0.58, 0.59, and 0.57. Crude fiber is 2.89, 3.05, 3.12, 3.13, and 3.21, and total amino acids listed are total lysine at 1.40, 1.12, 1.02, 0.84, and 0.73; total methionine at 0.45, 0.35, 0.28, 0.24, and 0.24; total threonine at 0.87, 0.75, 0.66, 0.52, and 0.48; and total tryptophan at 0.23, 0.23, 0.18, 0.16, and 0.14.
1 Mineral premix provided per kilogram of diet: 7–25 kg phase: Fe 100 mg; Mn 3 mg; Zn 80 mg; Cu 5 mg; I 0.14 mg; Se 0.25 mg; 25–50 kg phase: Fe 60 mg; Mn 2 mg; Zn 60 mg; Cu 4 mg; I 0.14 mg; Se 0.2 mg; 50–75 kg phase: Fe 50 mg; Mn 2 mg; Zn 50 mg; Cu 3.5 mg; I 0.14 mg; Se 0.15 mg; 75–120 kg phase: Fe 40 mg; Mn 2 mg; Zn 40 mg; Cu 3.5 mg; I 0.14 mg; Se 0.15 mg.
2 Vitamin premix provided per kilogram of diet: Vitamin A 15500 IU; Vitamin D3 5250 IU; Vitamin E 42 mg; Vitamin K3 2.26 mg; Vitamin B12 62.5 μg; Vitamin B1 5.18 mg; Vitamin B2 13.2 mg; Vitamin B6 6.53 mg; Pantothenic acid 24.1 mg; Niacin 52 mg; Folic acid 2.65 mg; Ethoxyquin 250 μg; Biotin 265 μg.
3 All data were calculated values.
Sample collection
At the end of the trial, all pigs were fasted overnight and weighed. Seven pigs per treatment with body weights close to the group mean were selected for blood collection. Approximately 5 mL of blood was drawn from the anterior vena cava into routine blood collection tubes, allowed to clot at room temperature for 30 min, and centrifuged at 3,500 × g for 15 min. The serum was aliquoted into 1.5 mL microcentrifuge tubes and stored at −20°C. After blood collection, pigs were slaughtered by exsanguination after electrical stunning. The abdominal cavity was opened, and samples of liver, muscle tissue, and colonic contents were collected into sterile cryovials, snap-frozen in liquid nitrogen, and transferred to −80°C for storage. The longissimus dorsi from the left side of the carcass was used for meat quality analysis.
Serum biochemical analysis
Concentrations of total protein (TP), creatinine (CRE), aspartate aminotransferase (AST), alkaline phosphatase (ALP), alanine aminotransferase (ALT), albumin (ALB), urea (UREA), triglycerides (TG), cholesterol (CHO), high-density lipoprotein cholesterol (HDL-C), and low-density lipoprotein cholesterol (LDL-C) in serum were measured using a Hitachi 3100 automated biochemical analyzer (Japan).
Carcass trait determination and analysis
Measurements were conducted according to NY/T 825-2004. Carcass weight: weight after electrical stunning, exsanguination, and removal of internal organs, head, feet, tail, and hair. Carcass length: straight-line distance from the anterior edge of the pubic symphysis to the anterior edge of the junction of the first rib and sternum on the suspended left side. Dressing percentage (%) = carcass weight/live weight before slaughter × 100%. Average backfat thickness: on the suspended left side, total skin and subcutaneous fat thickness was measured with a vernier caliper at three dorsal midline points: the thickest point at the shoulder (near the first thoracic vertebra), the thoracolumbar junction, and the lumbosacral junction (posterior to the last rib); the mean was calculated. Loin eye area: a cross-section was made at the last thoracic vertebra, maximum height and width of the longissimus dorsi cross-section were measured, and the area was calculated as height × width × 0.7. Lean meat percentage: at a cross-section between the 3rd and 4th last ribs, backfat thickness and muscle thickness (mm) were measured with a vernier caliper and applied to the formula: lean meat percentage = 60.30 − 0.847 × backfat thickness + 0.147 × muscle thickness.
Meat quality analysis
pH: at 45 min and 24 h postmortem, pH was measured at five sites on the left longissimus dorsi (between the last 1–2 ribs, sample thickness and width >3 cm) using a pH meter (SFK Technology, Denmark) calibrated with pH 4.6 and 7.0 buffers, and the mean was calculated.
Meat color: within 45 min and at 24 h postmortem, color (L, a, b*) was measured on the left longissimus dorsi at the thoracolumbar junction using a portable colorimeter (CR-300, Minolta, Japan); three points per parameter were recorded and averaged.
Drip loss: approximately 30 g of longissimus dorsi from the left side (between the last 3rd and 4th ribs, near the 4th rib) was trimmed into a strip of about 5 cm × 3 cm × 2.5 cm and weighed (W1). The strip was suspended vertically in the center of a sealed bag without touching the walls, stored at 4°C for 24 h, blotted dry with filter paper, and reweighed (W2). Drip loss (%) = [(W1 − W2)/W1] × 100%.
Cooking loss: within 45 min postmortem, approximately 120 g of longissimus dorsi from the left side (at the 3rd last rib, near the 3rd rib) was weighed (W3), steamed with a lid for 30 min, and then suspended to cool for 20 min before weighing the cooked meat (W4). Cooking loss (%) = [(W3 − W4)/W3] × 100%.
Shear force: after removing surface fat, longissimus dorsi samples were vacuum-packaged, aged at 4°C for 48 h, and held at room temperature for 1 h. A thermometer was inserted into the geometric center, and the sample was heated in an 80°C water bath to a core temperature of 75°C, then cooled to 0–4°C. Samples were sheared along the muscle fiber direction using a texture analyzer (TA.XT Plus, Stable Micro Systems, UK) with a Warner–Bratzler blade (blade thickness 3.0 mm, test speed 2.00 mm/s, trigger force 0.005 kg).
Marbling score: a cross-section of the longissimus dorsi from the junction of the last thoracic and first lumbar vertebrae was stored at 4°C for 24 h and scored according to the NPPC (1991) 5-point scale (1 = minimal, 5 = abundant intramuscular fat; 0.5-point intervals).
Intramuscular fat and crude protein: longissimus dorsi samples were freeze-dried for 48 h and ground. Intramuscular fat was determined by the Soxhlet extraction method, and crude protein was determined using an automated Kjeldahl analyzer (Foss 8400, Denmark).
Quantitative real-time PCR
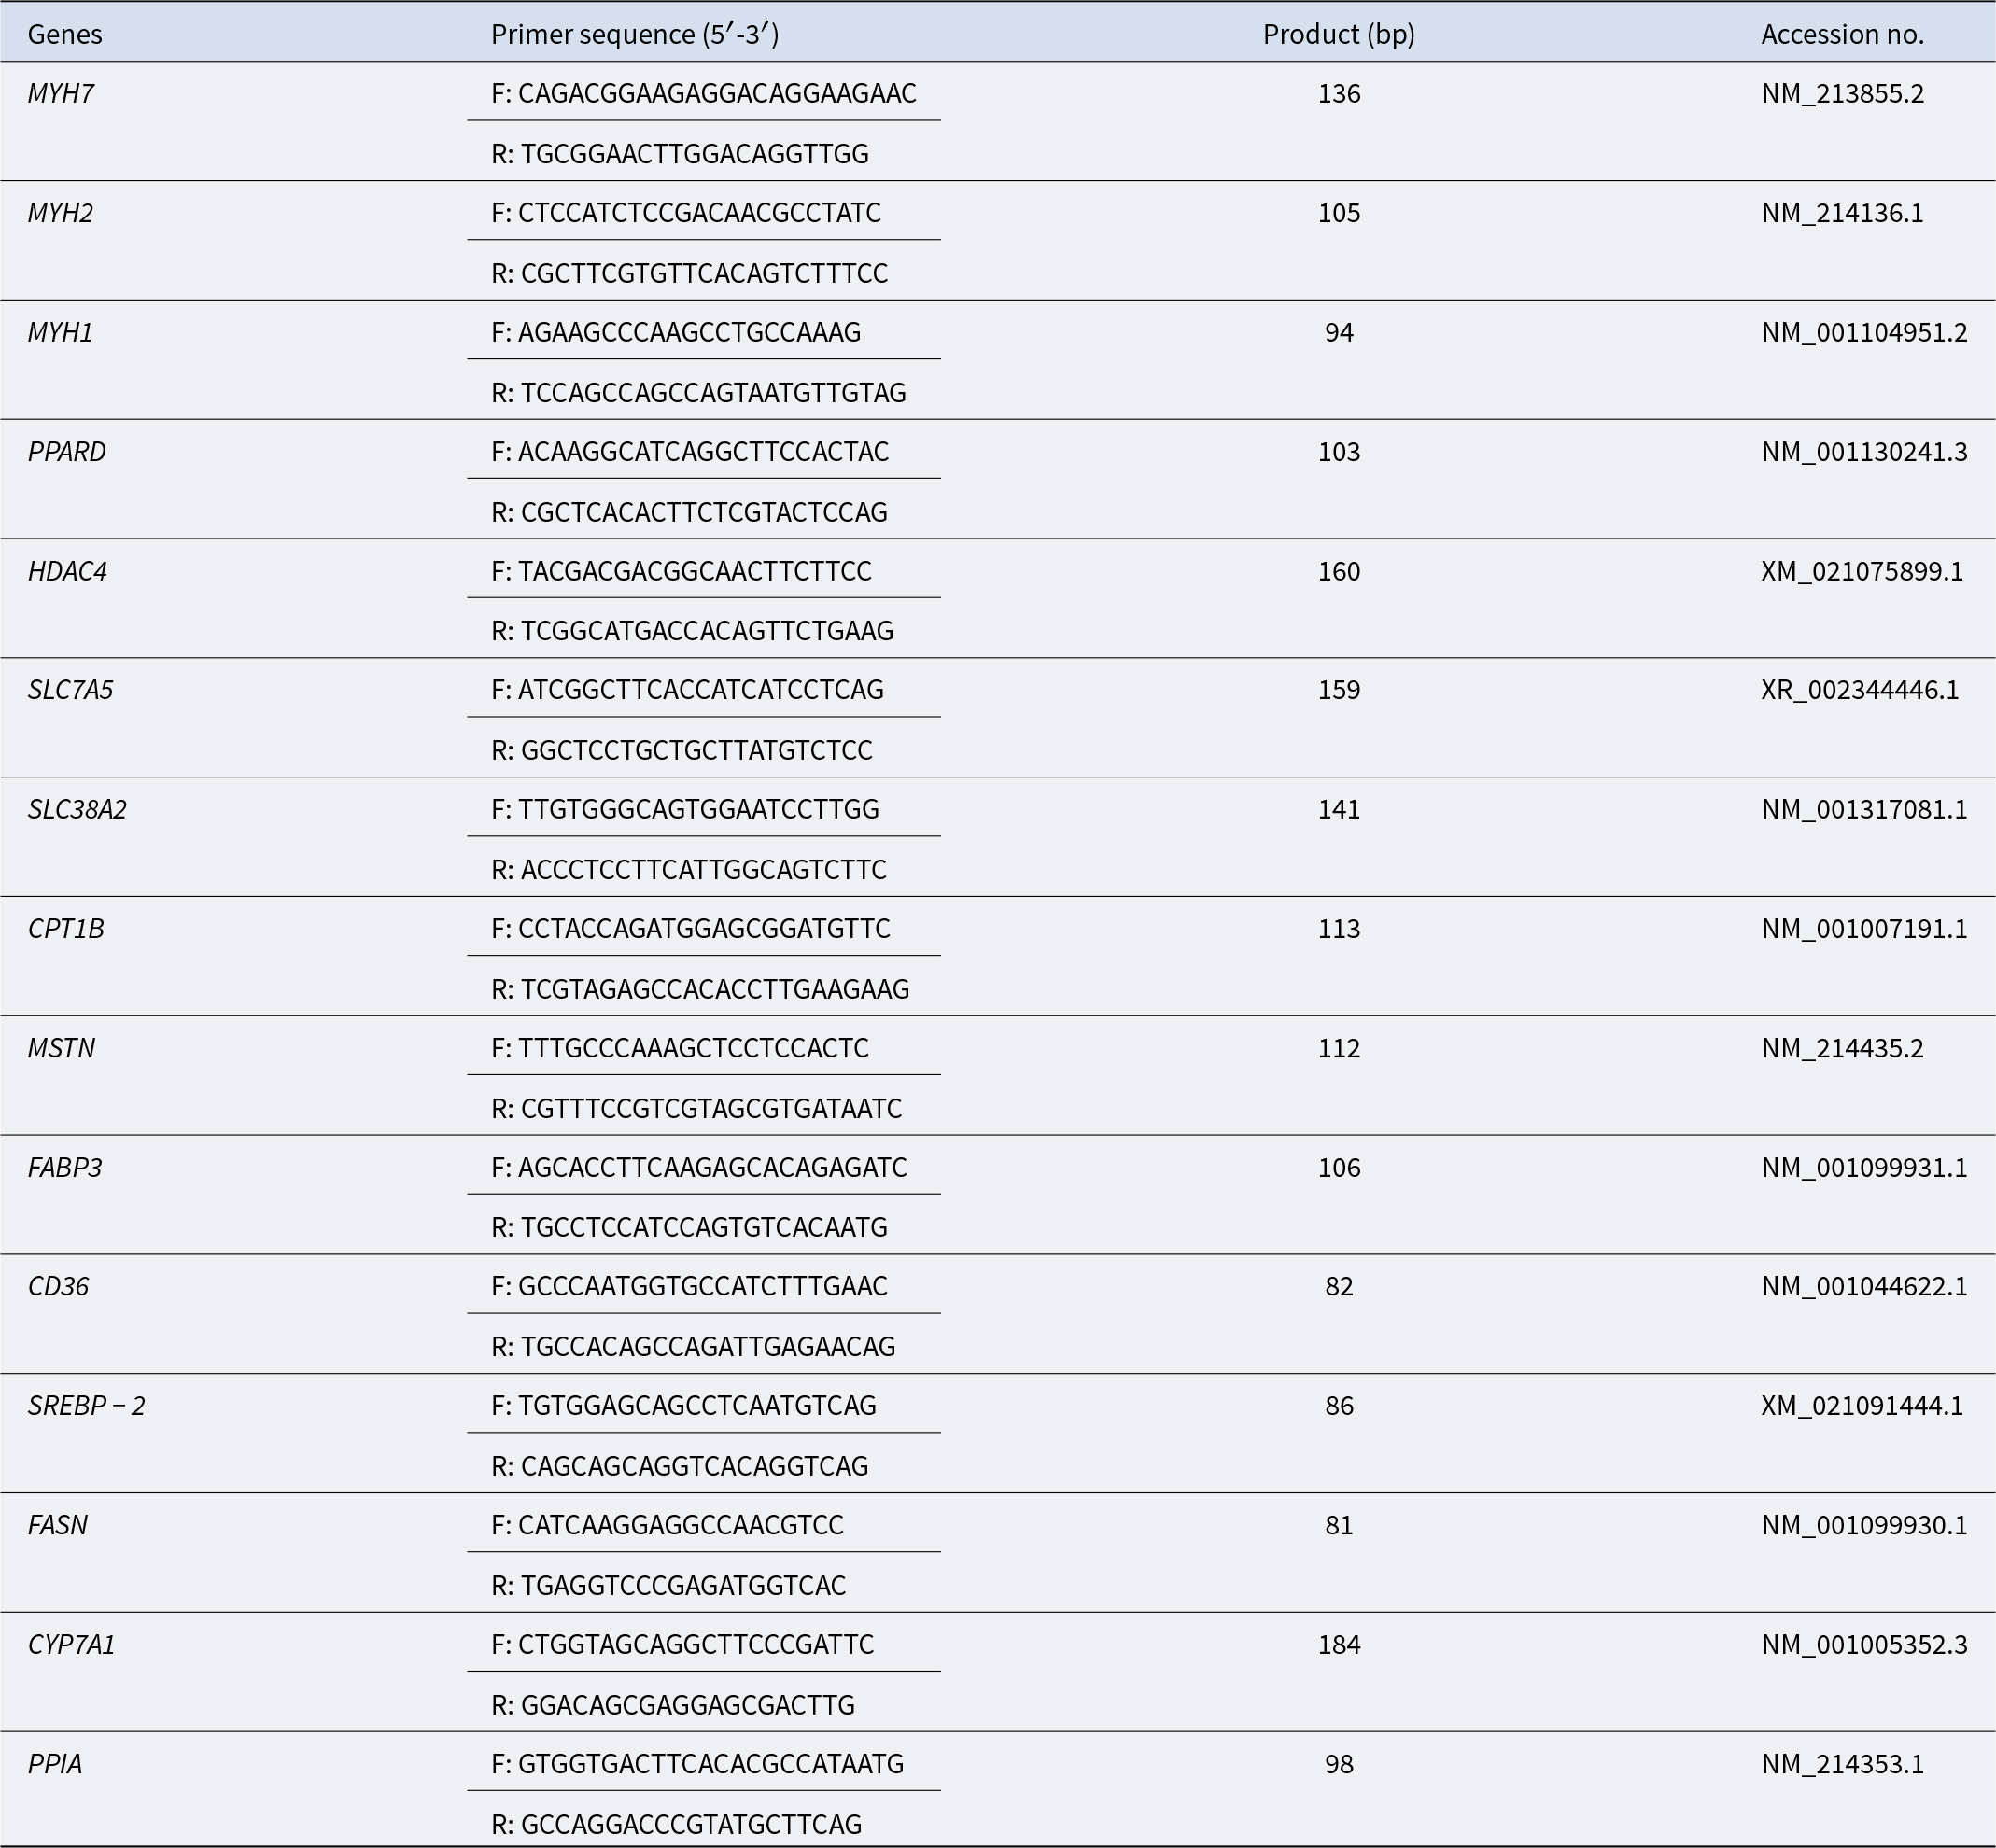
For longissimus dorsi and liver: tissues were ground in liquid nitrogen, and total RNA was extracted from approximately 0.1 g of tissue using an RNA extraction kit (RC401, Vazyme, Nanjing, China). RNA concentration and purity were measured with a NanoDrop ND-2000. One microgram of total RNA was used to synthesize cDNA with HiScript III RT SuperMix (R323-01, Vazyme). qPCR was performed using ChamQ Universal SYBR qPCR Master Mix (Q711-02, Vazyme) on an ABI 7900HT Fast system with the program: 95°C for 30 s; 40 cycles of 95°C for 10 s and 60°C for 30 s; followed by melt curve analysis. β-actin was used as the internal reference, and relative target gene expression was calculated by the 2−ΔΔCt method. Primer sequences are listed in Table 2.
Primer sequences used for real-time PCR
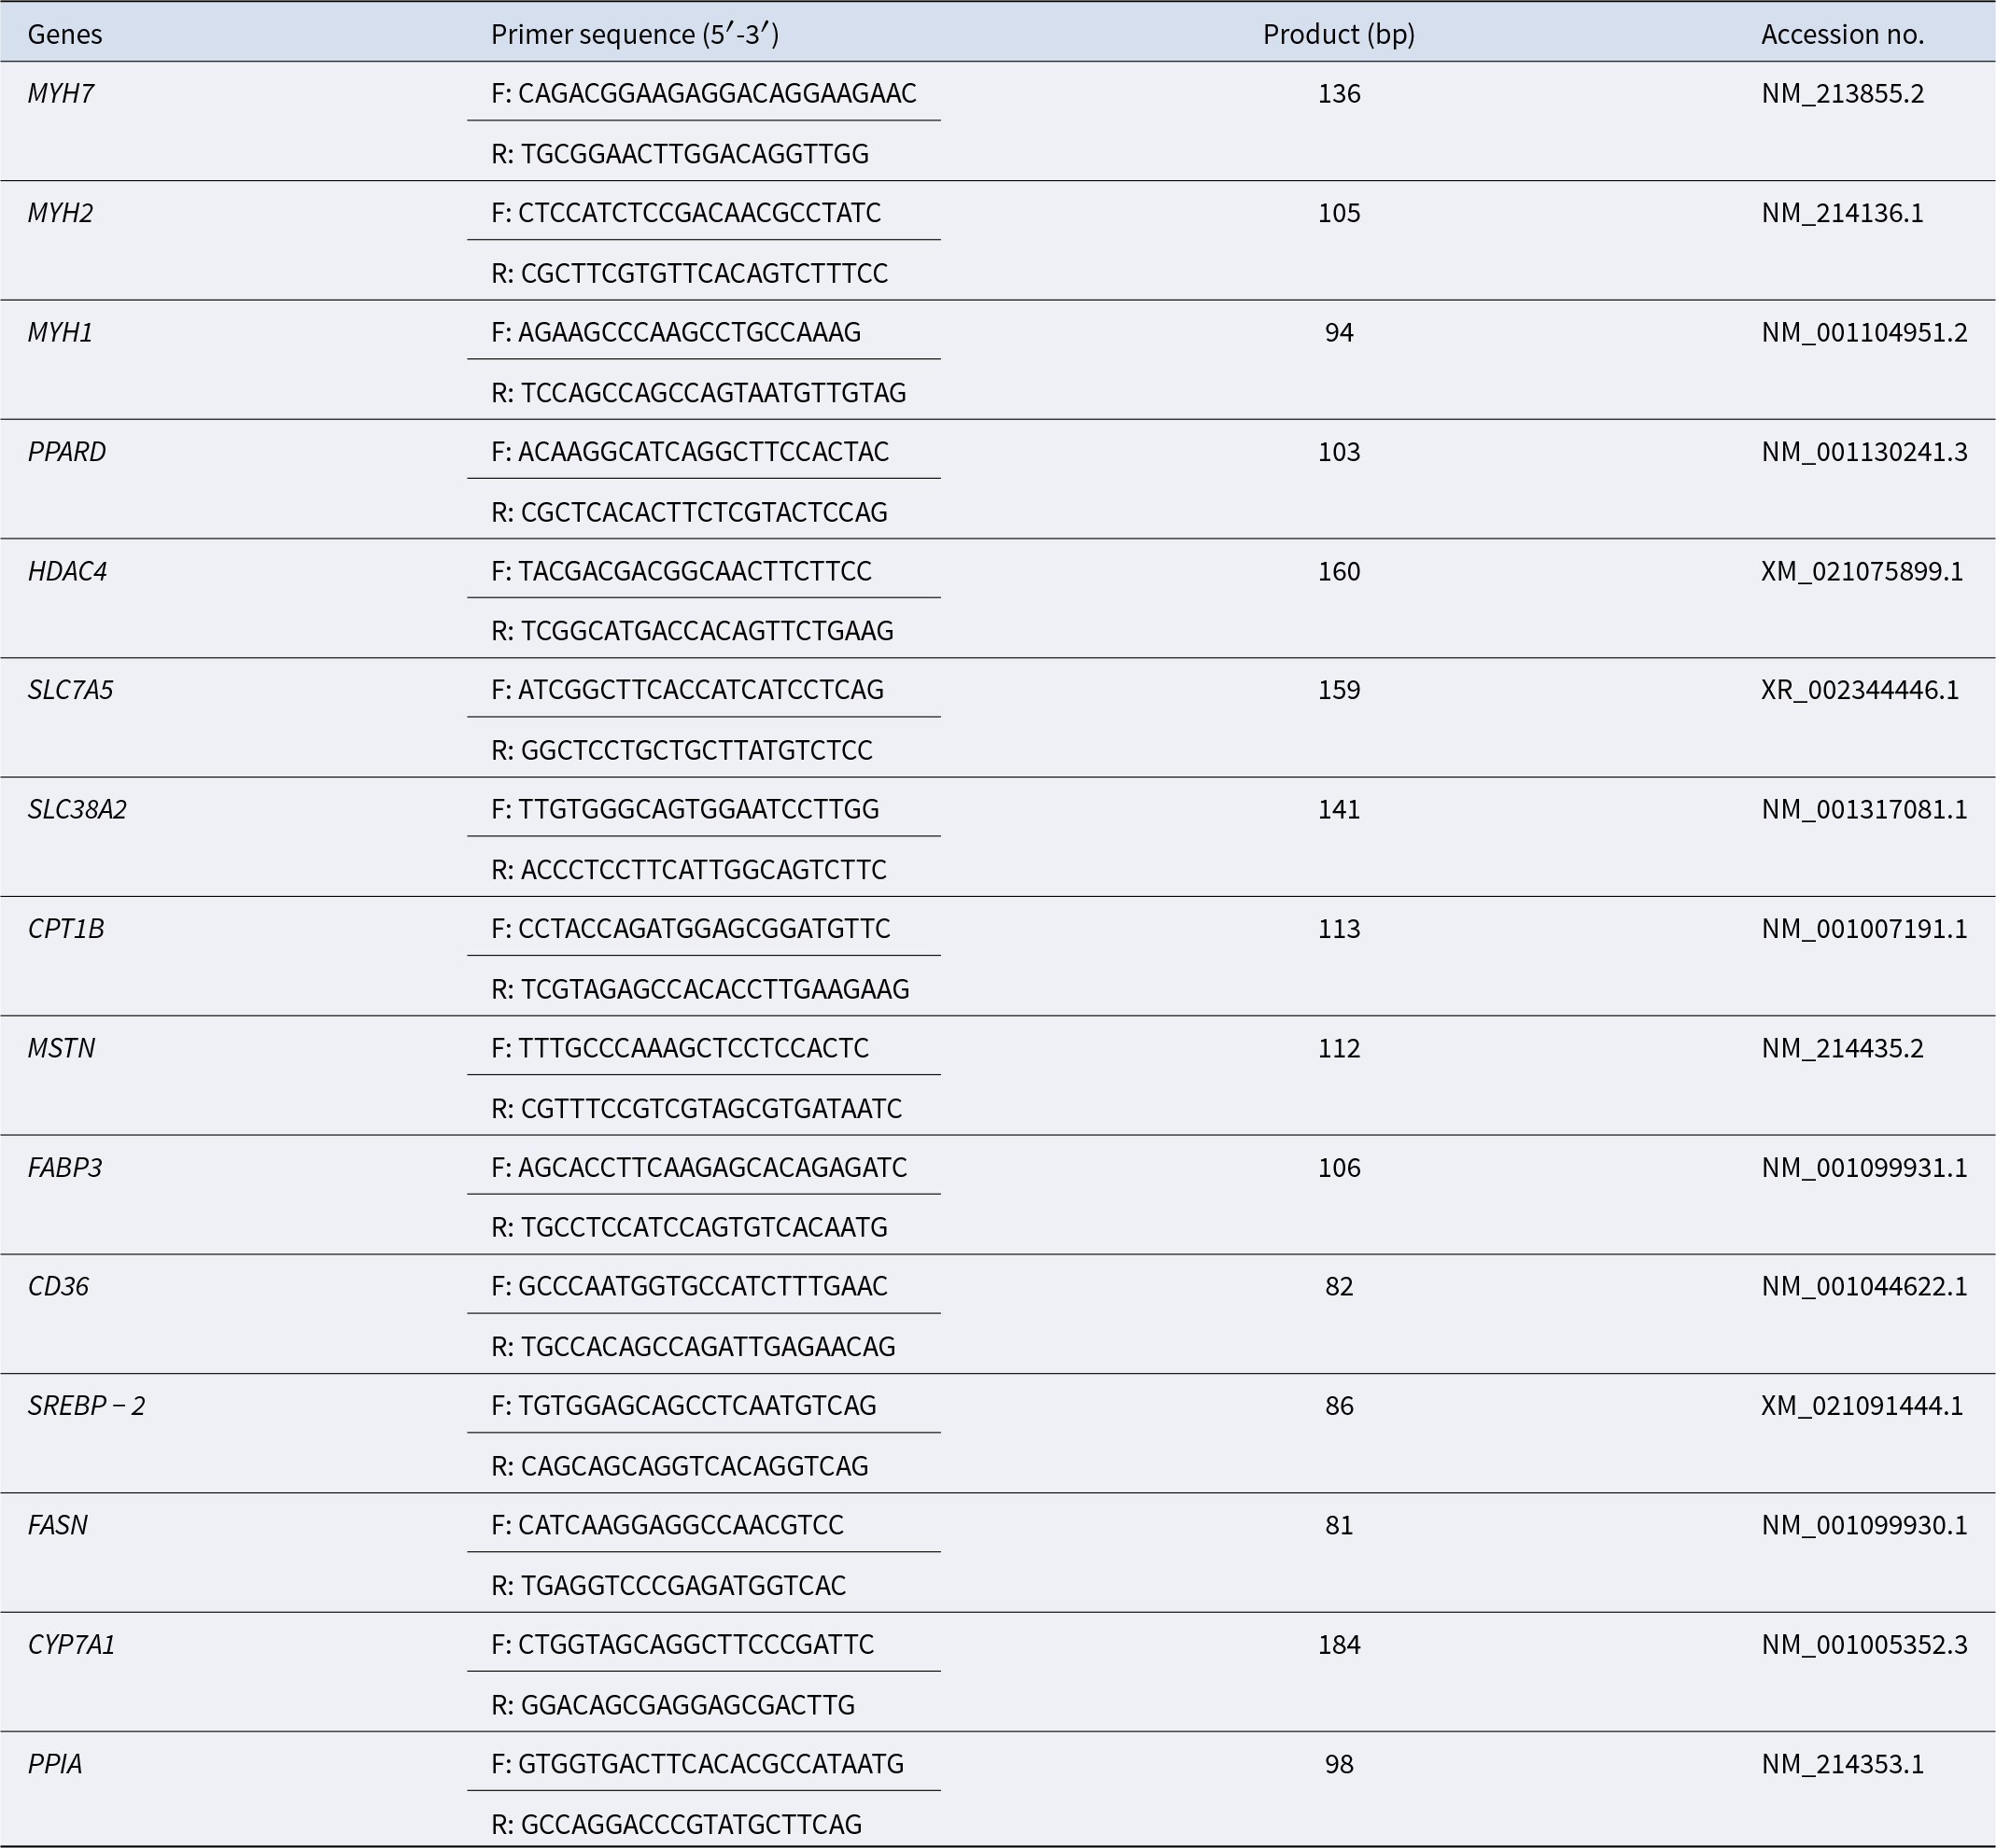
Table 2 Long description
Columns list genes, primer sequence from 5 prime to 3 prime, product in bp, and accession number. Genes include Myh7, Myh2, Myh1, Ppard, Hdac4, Slc7a5, Slc38a2, Cpt1b, Mstn, Fabp3, Cd36, Srebp 2, Fasn, Cyp7a1, and Ppia. Product sizes range from 81 bp for Fasn to 184 bp for Cyp7a1. Other product sizes are 82 bp for Cd36, 86 bp for Srebp 2, 94 bp for Myh1, 98 bp for Ppia, 103 bp for Ppard, 105 bp for Myh2, 106 bp for Fabp3, 112 bp for Mstn, 113 bp for Cpt1b, 136 bp for Myh7, 141 bp for Slc38a2, 159 bp for Slc7a5, and 160 bp for Hdac4. Each gene row provides a forward primer labeled F and a reverse primer labeled R, followed by the product size and an accession number such as Nm 213855.2 for Myh7 and Xm 021075899.1 for Hdac4.
Note: MYH7, myosin heavy chain 7; MYH2, myosin heavy chain 2; MYH1, myosin heavy chain 1; PPARD, peroxisome proliferator-activated receptor delta; HDAC4, histone deacetylase 4; SLC7A5, solute carrier family 7 member 5; SLC38A2, solute carrier family 38 member 2; CPT1B, carnitine palmitoyltransferase 1B; MSTN, myostatin; FABP3, fatty acid binding protein 3; CD36, cluster of differentiation 36; SREBP, sterol regulatory element-binding protein; FASN, fatty acid synthase; CYP7A1, cytochrome P450 family 7 subfamily A member 1.
Determination of short-chain fatty acid content
Approximately 1 g of sample was weighed into a 5 mL centrifuge tube, mixed with 2 mL ultrapure water, left at room temperature for 30 min, and centrifuged at 14,000 × g for 10 min. One milliliter of supernatant was mixed with 0.2 mL of 25% (w/v) metaphosphoric acid and 23.3 μL of 210 mmol/L crotonic acid, incubated at room temperature for 30 min, and centrifuged at 8,000 × g for 10 min. A 0.3 mL aliquot of supernatant was mixed with 0.9 mL methanol (1:3 dilution), centrifuged at 8,000 × g for 5 min, and the supernatant was filtered through a 0.22 μm membrane and stored at −20°C. Concentrations of short-chain fatty acids (SCFAs, acetic acid, propionic acid, butyric acid, etc.) in the filtrate were analyzed using an Agilent 8890 gas chromatograph (USA).
Colonic content microbiota analysis
Total microbial DNA was extracted from colonic content samples using the CTAB method and assessed by agarose gel electrophoresis. The V4 region of the 16S rRNA gene was amplified using Phusion® High-Fidelity PCR Master Mix (NEB) with barcoded primers 528F-706R. Purified PCR products were pooled equimolarly and used to construct sequencing libraries with the NEB Next® Ultra™ DNA Library Prep Kit. Paired-end sequencing was performed on the Illumina MiSeq platform. Reads were demultiplexed by barcode, trimmed of primers, and assembled with FLASH. Quality control followed the QIIME pipeline, and chimeras were removed using UCHIME. OTUs were clustered at 97% and 95% similarity with UPARSE. Taxonomic annotation was performed using the RDP Classifier against the GreenGenes database (confidence threshold 0.8). Based on the OTU table, alpha diversity indices were calculated in QIIME, and differences in microbial community structure were evaluated by PCoA and UPGMA clustering analysis.
Statistical analysis
All statistical analyses were performed using SPSS 27.0 software and R (version 4.x). Normality and homogeneity of variance were tested using the Shapiro–Wilk test and Levene’s test, respectively. The experimental unit for growth performance was the pen (n = 10 per group), and for other traits, the individual pig (n = 7 per group) was the experimental unit.
For all traits except beta diversity and taxonomic composition, pairwise comparisons (CON vs. UCD; UCD vs. LP-UCD) were conducted using independent-samples t-tests (or Mann–Whitney U tests for non-normal data). Effect sizes were reported as Hedges’ g with 95% confidence intervals (CI). For beta diversity of colonic microbiota, PERMANOVA (999 permutations) was used, and effect size was reported as R 2. For phylum- and genus-level relative abundances, Cliff’s Delta (Δ) was calculated using the R package effect size, with 95% CI obtained by bootstrap (1,000 replicates). Cliff’s Delta was interpreted as: |Δ| < 0.147 = negligible, 0.147–0.33 = small, 0.33–0.474 = medium, ≥ 0.474 = large. Results are presented as mean ± SE. Statistical significance was set at P < 0.05, and 0.05 ≤ P < 0.10 was considered a tendency.
Results
For all statistical comparisons, effect sizes (Hedges’ g or Cliff’s Delta) and 95% CIs are reported in the corresponding tables and figures. Unless otherwise stated, significant differences (P < 0.05) were associated with large effect sizes (|g| > 0.8), while non-significant comparisons had small effect sizes with CIs crossing zero, confirming the absence of meaningful treatment effects.
Growth performance
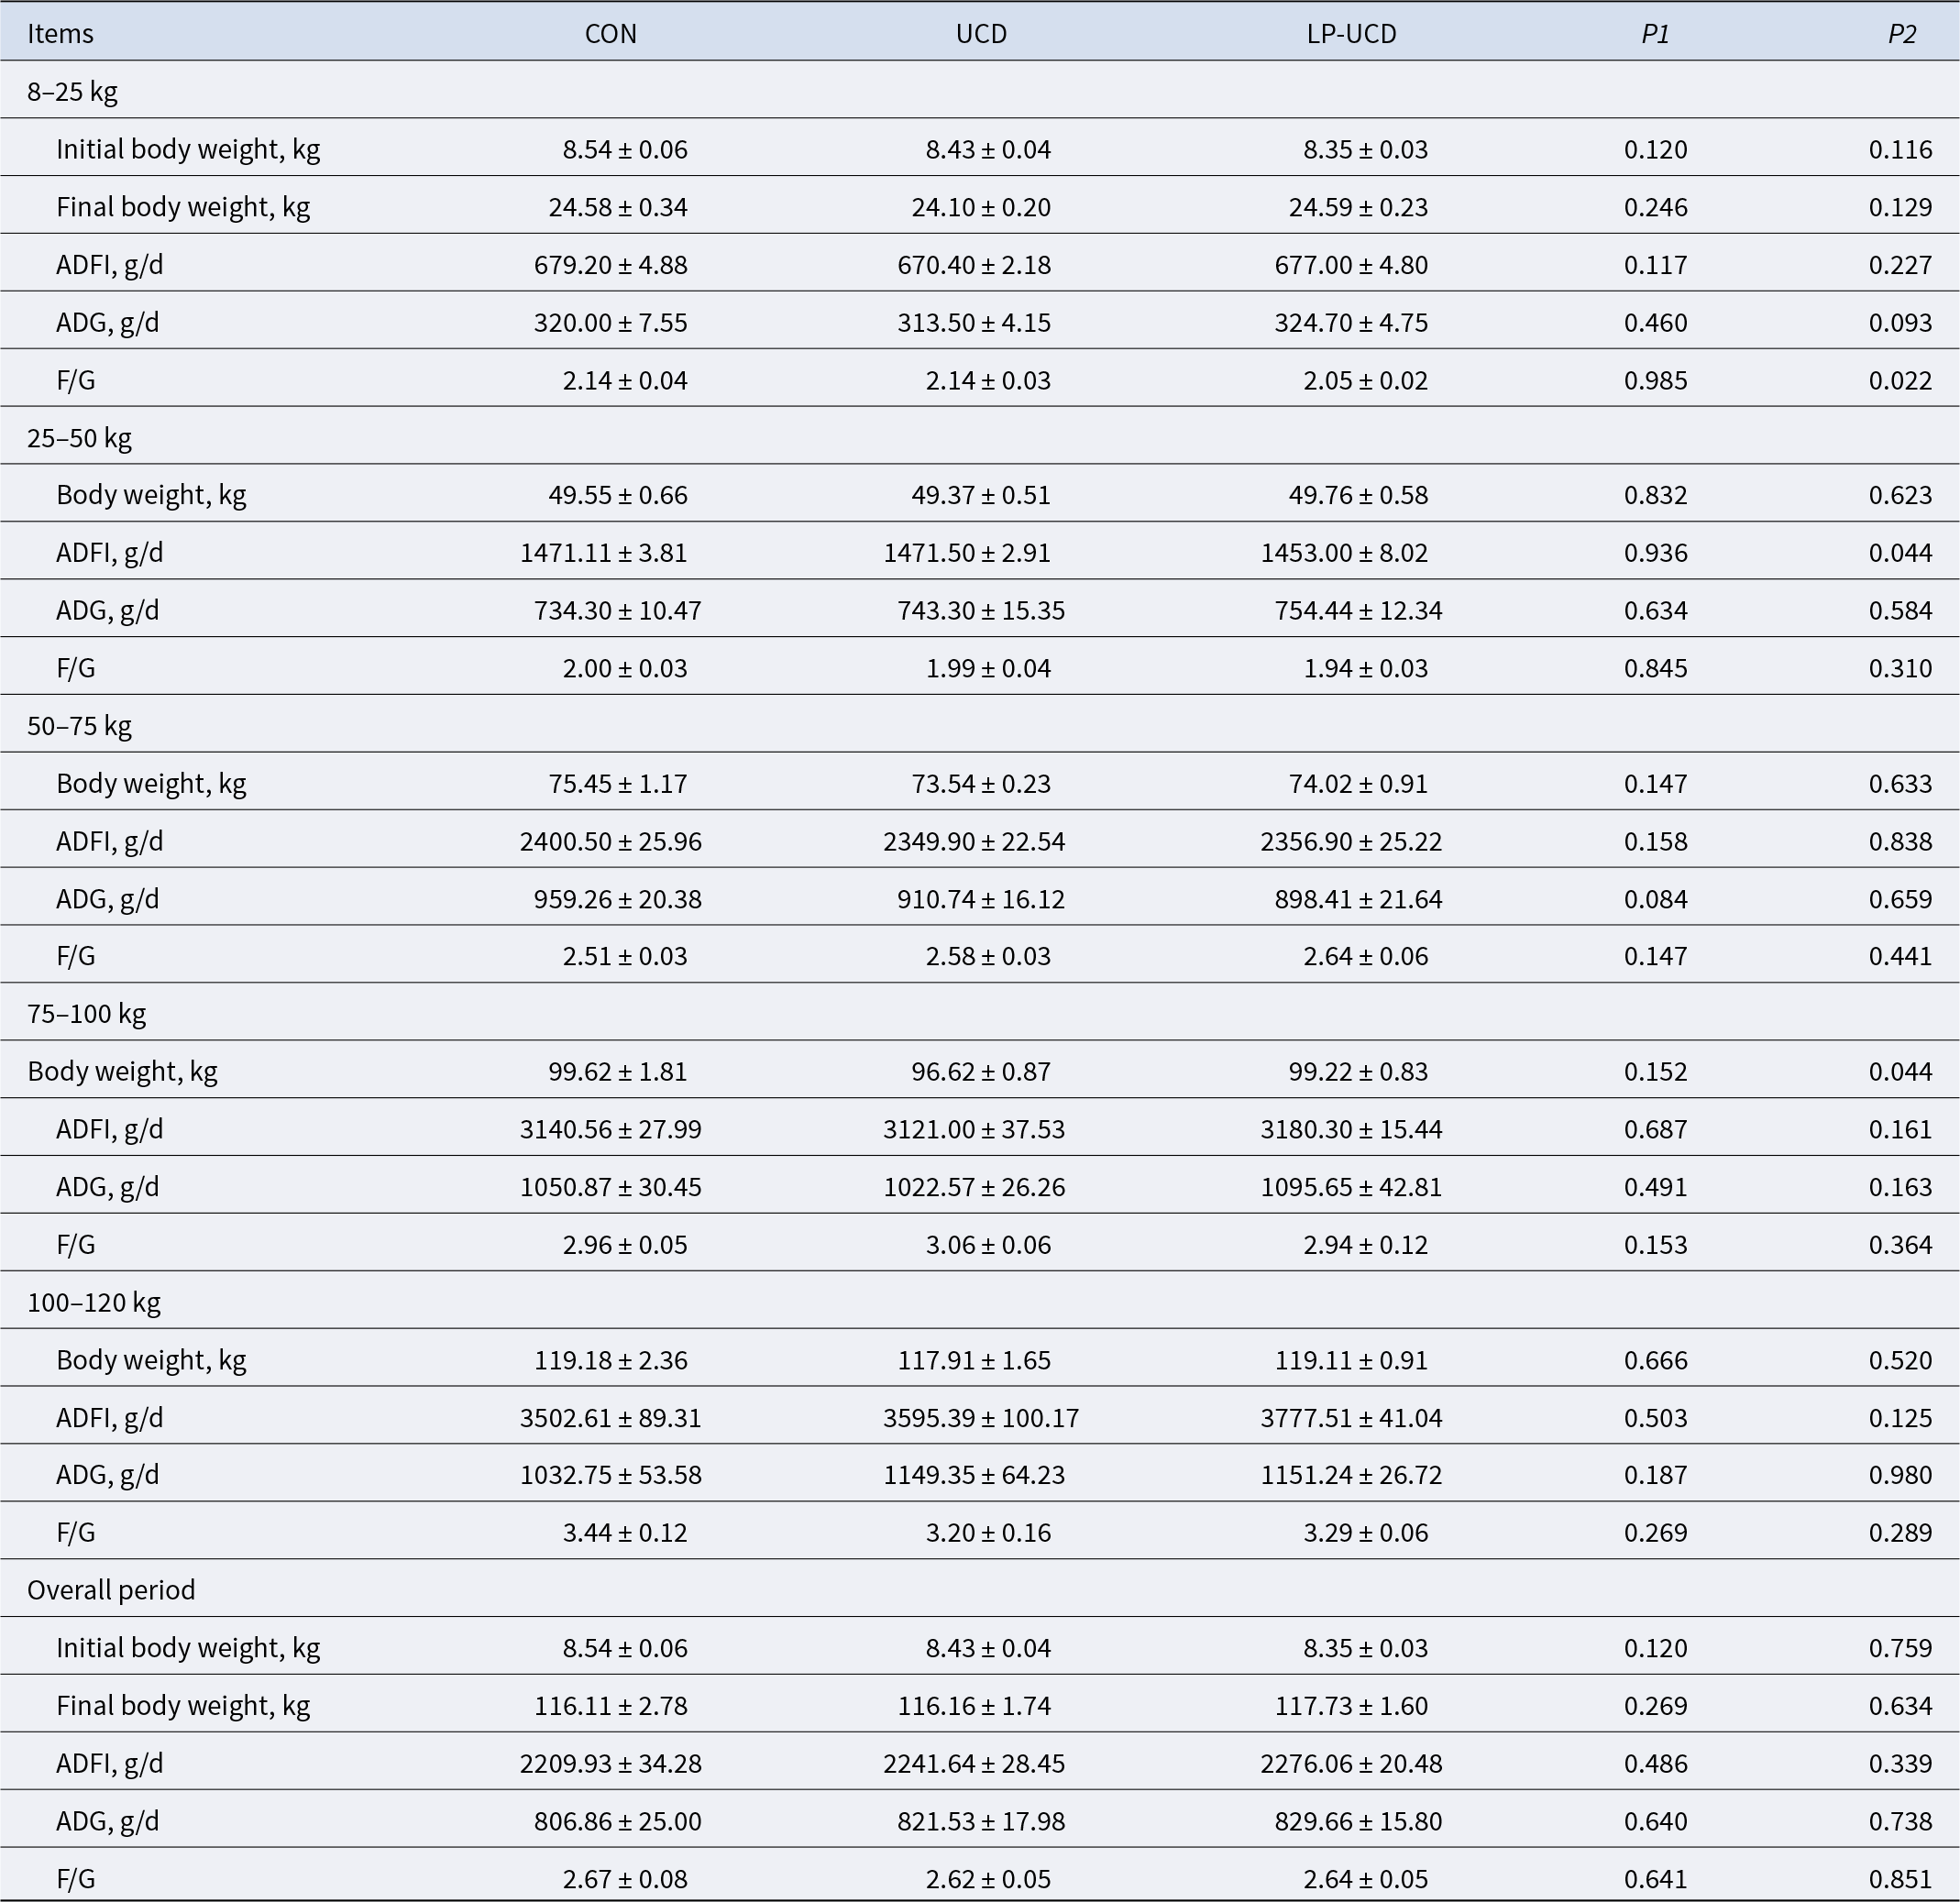
Compared with CON group, UCD group had no significant effects on the growth performance of the offspring (Table 3). Compared with UCD group, LP-UCD group showed a trend to increase average daily gain (P = 0.093) and demonstrated a reduction in feed-to-gain ratio (P < 0.05) during the 8–25 kg phase. During the 25–50 kg phase, the average daily feed intake was lower (P < 0.05) in LP-UCD group, with no significant effects observed in the other phases.
Effects of unconventional diets and unconventional low-protein diets in gestating sows on offspring growth performance
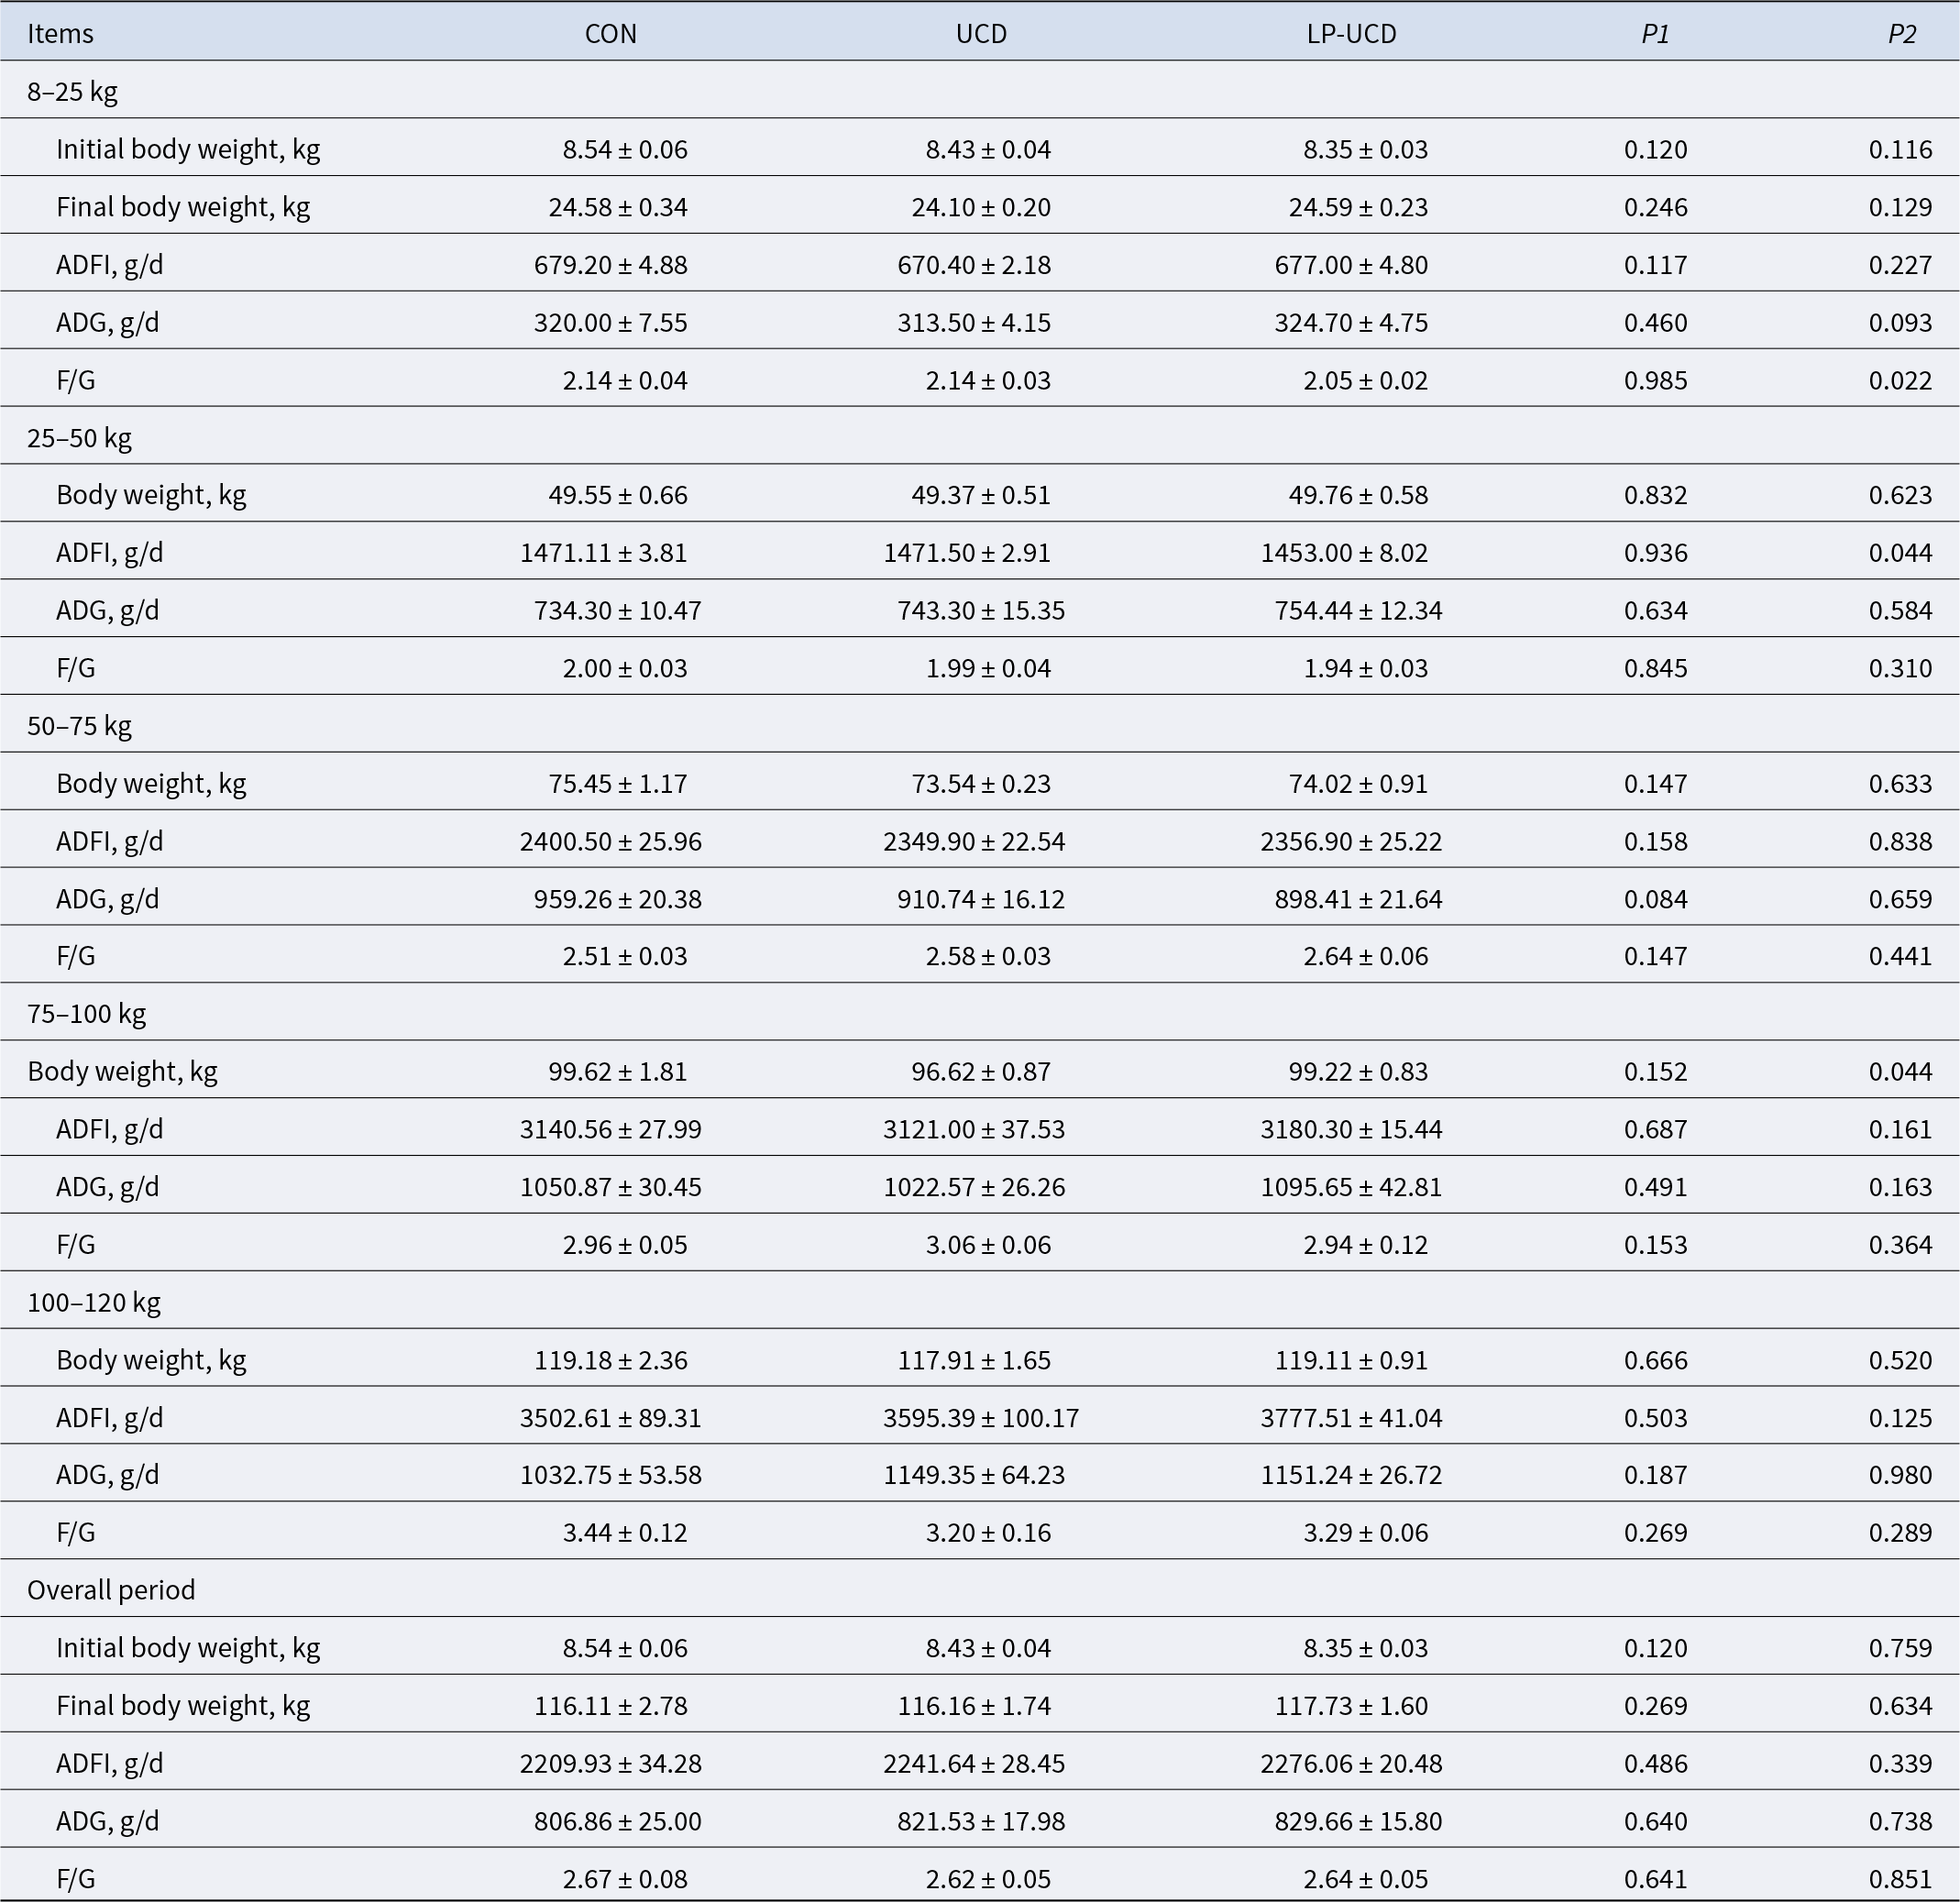
Table 3 Long description
Growth performance is reported for offspring across weight ranges 8 to 25 kg, 25 to 50 kg, 50 to 75 kg, 75 to 100 kg, 100 to 120 kg, plus an overall period, with columns for CON, UCD, LP UCD, P1, and P2. For 8 to 25 kg, initial body weight was 8.54 plus or minus 0.06 for CON, 8.43 plus or minus 0.04 for UCD, and 8.35 plus or minus 0.03 for LP UCD; final body weight was 24.58 plus or minus 0.34, 24.10 plus or minus 0.20, and 24.59 plus or minus 0.23. In the same range, ADFI was 679.20 plus or minus 4.88 g per day, 670.40 plus or minus 2.18, and 677.00 plus or minus 4.80; ADG was 320.00 plus or minus 7.55 g per day, 313.50 plus or minus 4.15, and 324.70 plus or minus 4.75; F over G was 2.14 plus or minus 0.04, 2.14 plus or minus 0.03, and 2.05 plus or minus 0.02, with P1 0.985 and P2 0.022. For 25 to 50 kg, body weight was 49.55 plus or minus 0.66, 49.37 plus or minus 0.51, and 49.76 plus or minus 0.58; ADFI was 1471.11 plus or minus 3.81, 1471.50 plus or minus 2.91, and 1453.00 plus or minus 8.02 g per day, with P2 0.044; ADG was 734.30 plus or minus 10.47, 743.30 plus or minus 15.35, and 754.44 plus or minus 12.34; F over G was 2.00 plus or minus 0.03, 1.99 plus or minus 0.04, and 1.94 plus or minus 0.03. For 50 to 75 kg, body weight was 75.45 plus or minus 1.17, 73.54 plus or minus 0.23, and 74.02 plus or minus 0.91; ADFI was 2400.50 plus or minus 25.96, 2349.90 plus or minus 22.54, and 2356.90 plus or minus 25.22 g per day; ADG was 959.26 plus or minus 20.38, 910.74 plus or minus 16.12, and 898.41 plus or minus 21.64; F over G was 2.51 plus or minus 0.03, 2.58 plus or minus 0.03, and 2.64 plus or minus 0.06. For 75 to 100 kg, body weight was 99.62 plus or minus 1.81, 96.62 plus or minus 0.87, and 99.22 plus or minus 0.83, with P2 0.044; ADFI was 3140.56 plus or minus 27.99, 3121.00 plus or minus 37.53, and 3180.30 plus or minus 15.44 g per day; ADG was 1050.87 plus or minus 30.45, 1022.57 plus or minus 26.26, and 1095.65 plus or minus 42.81; F over G was 2.96 plus or minus 0.05, 3.06 plus or minus 0.06, and 2.94 plus or minus 0.12. For 100 to 120 kg, body weight was 119.18 plus or minus 2.36, 117.91 plus or minus 1.65, and 119.11 plus or minus 0.91; ADFI was 3502.61 plus or minus 89.31, 3595.39 plus or minus 100.17, and 3777.51 plus or minus 41.04 g per day; ADG was 1032.75 plus or minus 53.58, 1149.35 plus or minus 64.23, and 1151.24 plus or minus 26.72; F over G was 3.44 plus or minus 0.12, 3.20 plus or minus 0.16, and 3.29 plus or minus 0.06. Over the overall period, initial body weight was 8.54 plus or minus 0.06, 8.43 plus or minus 0.04, and 8.35 plus or minus 0.03; final body weight was 116.11 plus or minus 2.78, 116.16 plus or minus 1.74, and 117.73 plus or minus 1.60; ADFI was 2209.93 plus or minus 34.28, 2241.64 plus or minus 28.45, and 2276.06 plus or minus 20.48 g per day; ADG was 806.86 plus or minus 25.00, 821.53 plus or minus 17.98, and 829.66 plus or minus 15.80; F over G was 2.67 plus or minus 0.08, 2.62 plus or minus 0.05, and 2.64 plus or minus 0.05.
Note: Values are mean ± standard error (n = 10). CON: sow corn-soybean meal diet – offspring basal diet; UCD: sow unconventional diet – offspring basal diet; LP-UCD: sow unconventional low-protein diet – offspring basal diet; ADFI: average daily feed intake; ADG: average daily gain; F/G: ADFI/ADG; P1: CON vs. UCD; P2: UCD vs. LP-UCD.
Serum biochemical parameters
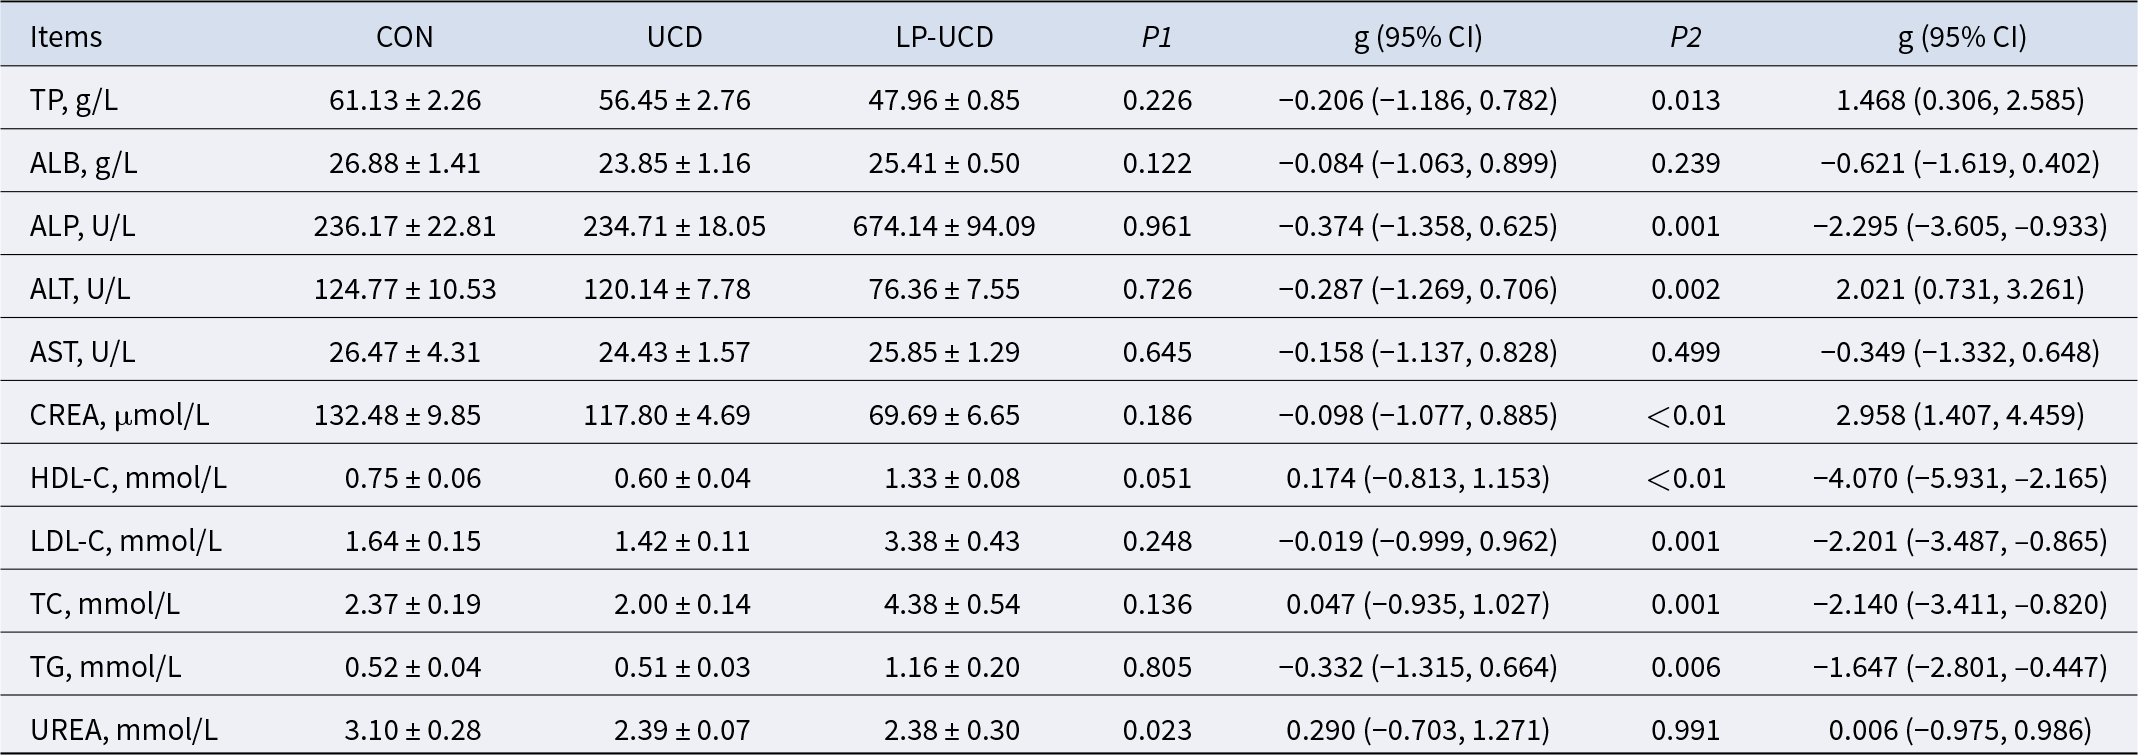
Compared with CON group, UCD group decreased the serum UREA content (P < 0.05, Table 4) and showed a tendency to decrease HDL-C (P = 0.051). Compared with UCD group, LP-UCD group decreased the serum contents of TP, ALT, and CRE (P < 0.05), while increased the contents of ALP, LDL-C, CHO, TG, and HDL-C (P < 0.05).
Effects of unconventional diets or unconventional low-protein diets in gestating sows on offspring serum biochemistry
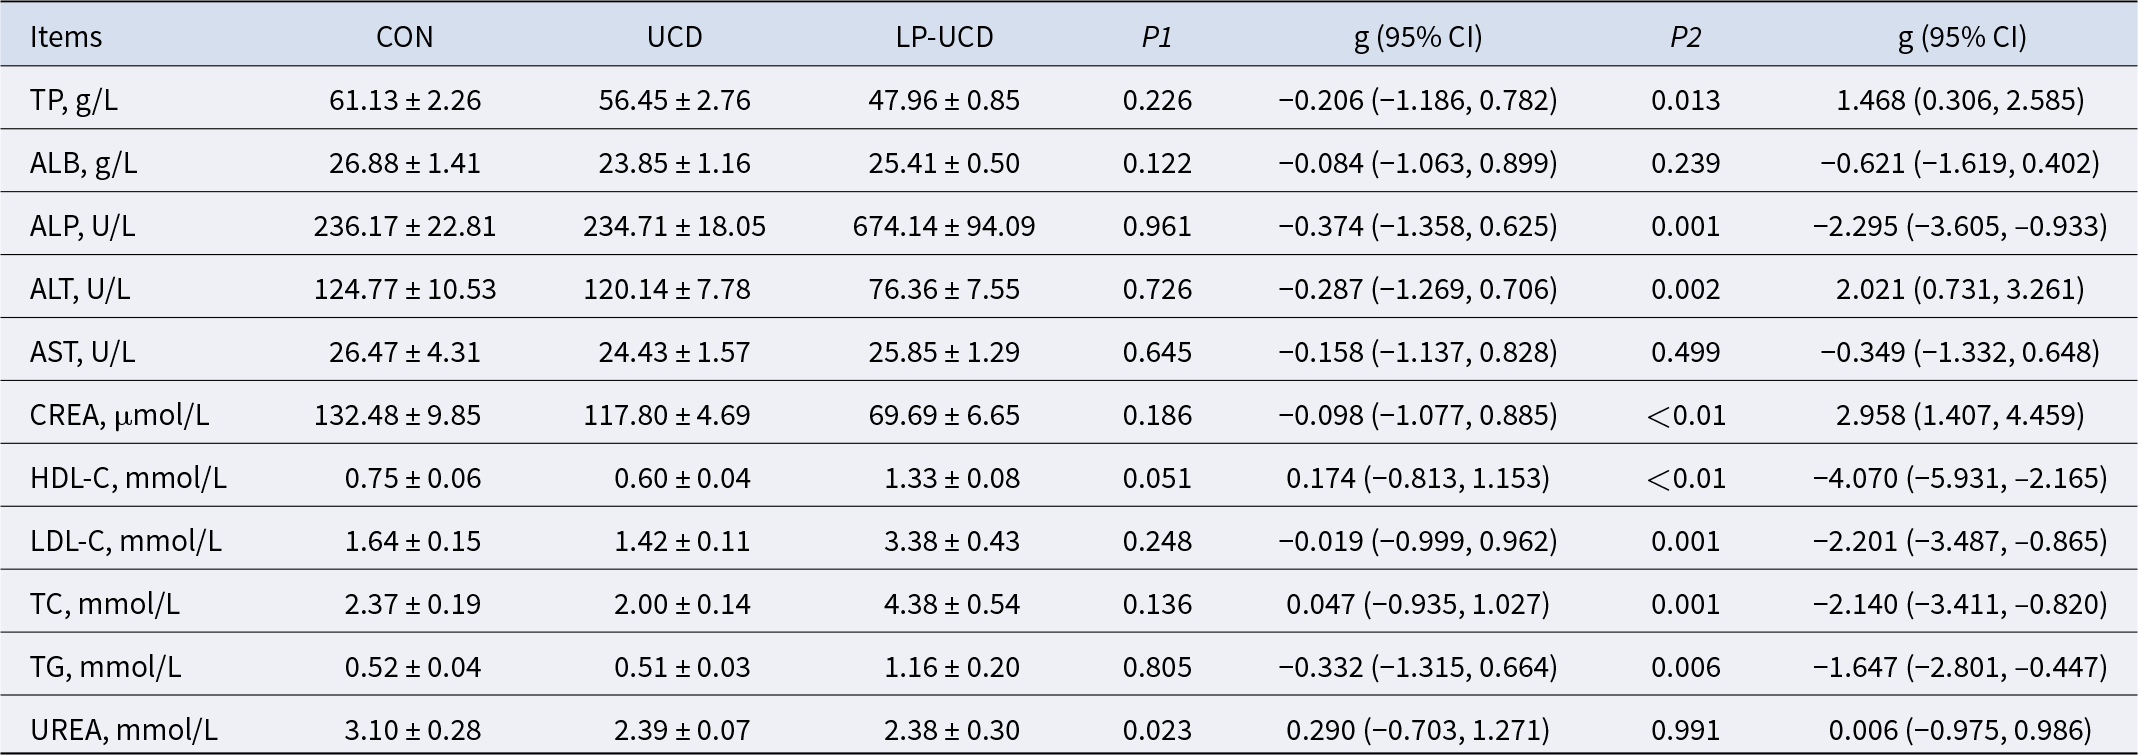
Table 4 Long description
Offspring serum biochemistry is reported as mean plus or minus standard error for three groups labeled, con, ucd, and lp ucd, with p1 for con versus ucd and p2 for ucd versus lp ucd, plus g values with 95 percent confidence intervals for each comparison. Total protein in grams per liter is 61.13 for con, 56.45 for ucd, and 47.96 for lp ucd, with p1 0.226 and p2 0.013. Albumin in grams per liter is 26.88, 23.85, and 25.41, with p1 0.122 and p2 0.239. Alkaline phosphatase in units per liter is 236.17, 234.71, and 674.14, with p1 0.961 and p2 0.001; alanine aminotransferase is 124.77, 120.14, and 76.36, with p1 0.726 and p2 0.002; aspartate aminotransferase is 26.47, 24.43, and 25.85, with p1 0.645 and p2 0.499. Creatinine in micromoles per liter is 132.48, 117.80, and 69.69, with p1 0.186 and p2 less than 0.01. High density lipoprotein cholesterol in millimoles per liter is 0.75, 0.60, and 1.33, with p1 0.051 and p2 less than 0.01; low density lipoprotein cholesterol is 1.64, 1.42, and 3.38, with p1 0.248 and p2 0.001; total cholesterol is 2.37, 2.00, and 4.38, with p1 0.136 and p2 0.001; triglycerides are 0.52, 0.51, and 1.16, with p1 0.805 and p2 0.006. Urea in millimoles per liter is 3.10, 2.39, and 2.38, with p1 0.023 and p2 0.991.
Note: Values are mean ± standard error (n = 7). CON: sow corn-soybean meal diet – offspring basal diet; UCD: sow unconventional diet – offspring basal diet; LP-UCD: sow unconventional low-protein diet – offspring basal diet. TP: total protein; ALB: albumin; ALP: alkaline phosphatase; ALT: alanine aminotransferase; AST: aspartate aminotransferase; CREA: creatinine; HDL-C: high-density lipoprotein cholesterol; LDL-C: low-density lipoprotein cholesterol; TC: total cholesterol; TG: triglycerides; UREA: urea; P1: CON vs. UCD; P2: UCD vs. LP-UCD.
Carcass traits
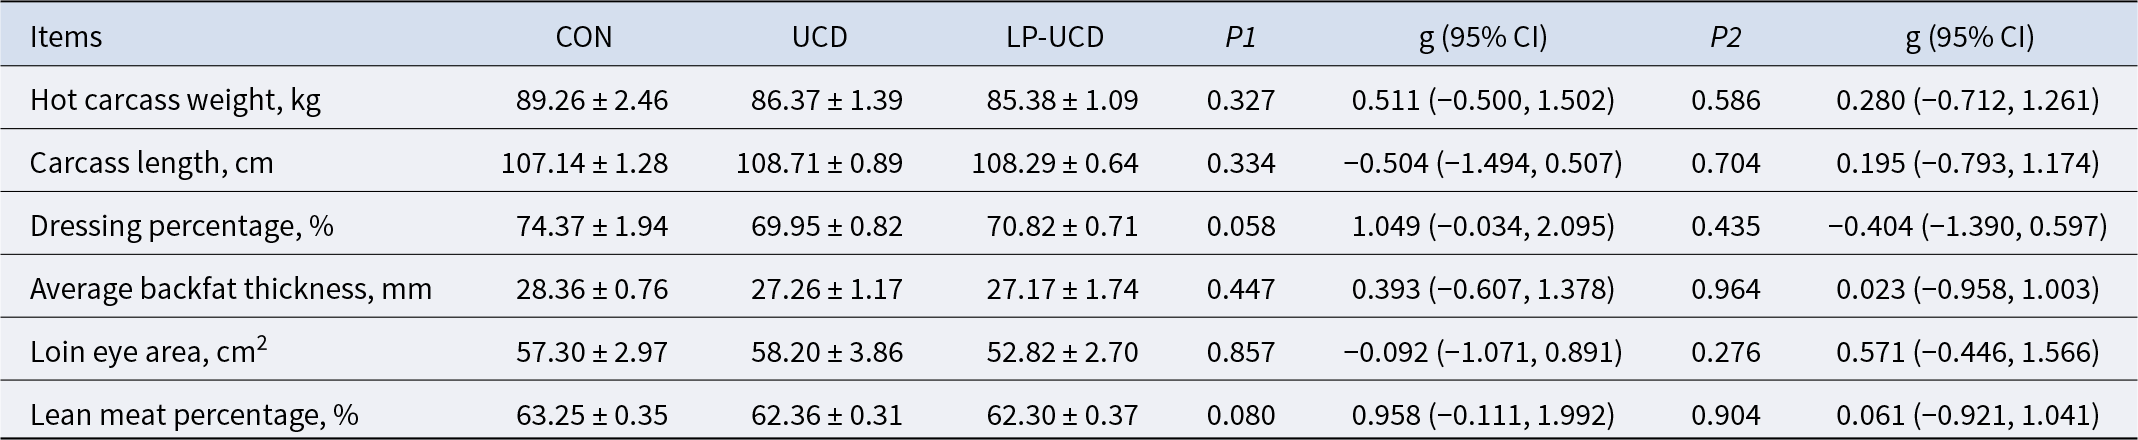
Neither the UCD nor LP-UCD groups significantly affected the carcass traits of the offspring. However, compared with CON group, UCD group exhibited tendencies toward decreased dressing percentage (P = 0.058, Table 5) and lean meat percentage (P = 0.080).
Effects of unconventional diets or unconventional low-protein diets in gestating sows on carcass traits of offspring
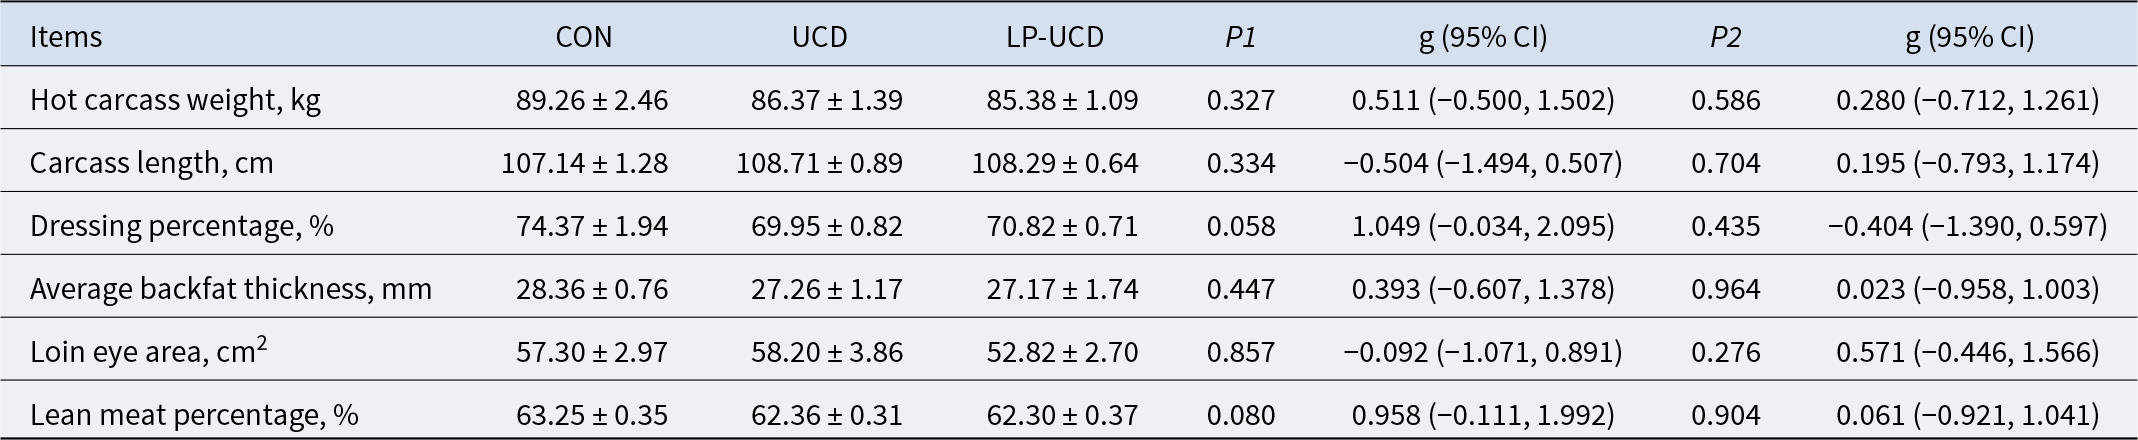
Table 5 Long description
Carcass traits are reported as mean plus or minus standard error for three groups labeled con, ucd, and lp ucd, with p1 comparing con versus ucd and p2 comparing ucd versus lp ucd, each paired with g and a 95 percent confidence interval. Hot carcass weight in kilograms was 89.26 for con, 86.37 for ucd, and 85.38 for lp ucd; p1 was 0.327 with g 0.511 and confidence interval from minus 0.500 to 1.502, and p2 was 0.586 with g 0.280 and confidence interval from minus 0.712 to 1.261. Carcass length in centimeters was 107.14, 108.71, and 108.29; p1 was 0.334 with g minus 0.504 and confidence interval from minus 1.494 to 0.507, and p2 was 0.704 with g 0.195 and confidence interval from minus 0.793 to 1.174. Dressing percentage was 74.37, 69.95, and 70.82; p1 was 0.058 with g 1.049 and confidence interval from minus 0.034 to 2.095, and p2 was 0.435 with g minus 0.404 and confidence interval from minus 1.390 to 0.597. Average backfat thickness in millimeters was 28.36, 27.26, and 27.17; p1 was 0.447 with g 0.393 and confidence interval from minus 0.607 to 1.378, and p2 was 0.964 with g 0.023 and confidence interval from minus 0.958 to 1.003. Loin eye area in square centimeters was 57.30, 58.20, and 52.82; p1 was 0.857 with g minus 0.092 and confidence interval from minus 1.071 to 0.891, and p2 was 0.276 with g 0.571 and confidence interval from minus 0.446 to 1.566. Lean meat percentage was 63.25, 62.36, and 62.30; p1 was 0.080 with g 0.958 and confidence interval from minus 0.111 to 1.992, and p2 was 0.904 with g 0.061 and confidence interval from minus 0.921 to 1.041.
Note: Values are mean ± standard error (n = 7). CON: sow corn-soybean meal diet – offspring basal diet; UCD: sow unconventional diet – offspring basal diet; LP-UCD: sow unconventional low-protein diet – offspring basal diet; P1: CON vs. UCD; P2: UCD vs. LP-UCD.
Meat quality
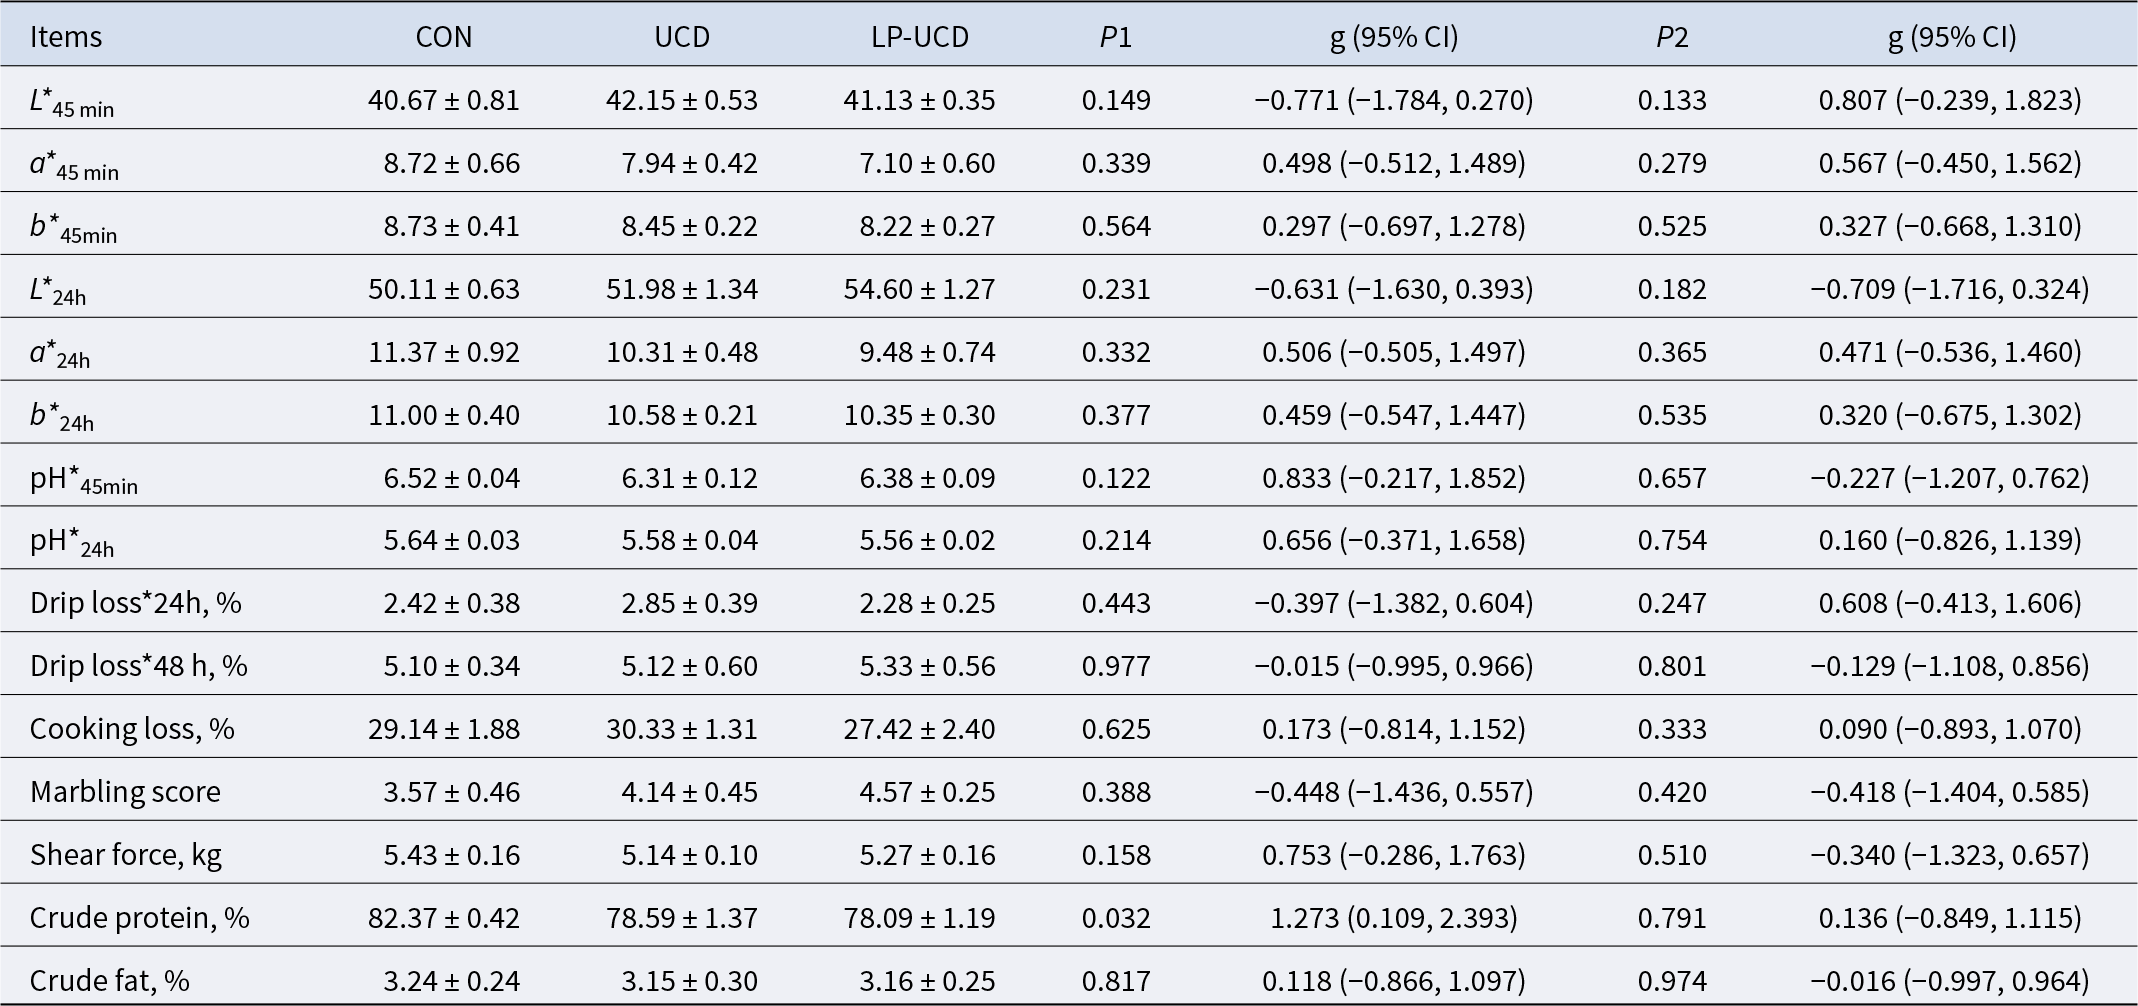
The UCD and LP-UCD groups had no significant effects on meat quality of the offspring (Table 6). However, compared with CON group, the crude protein content in the longissimus dorsi muscle of finishing pigs in UCD group was lower (P < 0.05).
Effects of unconventional diets or unconventional low-protein diets in gestating sows on meat quality of offspring
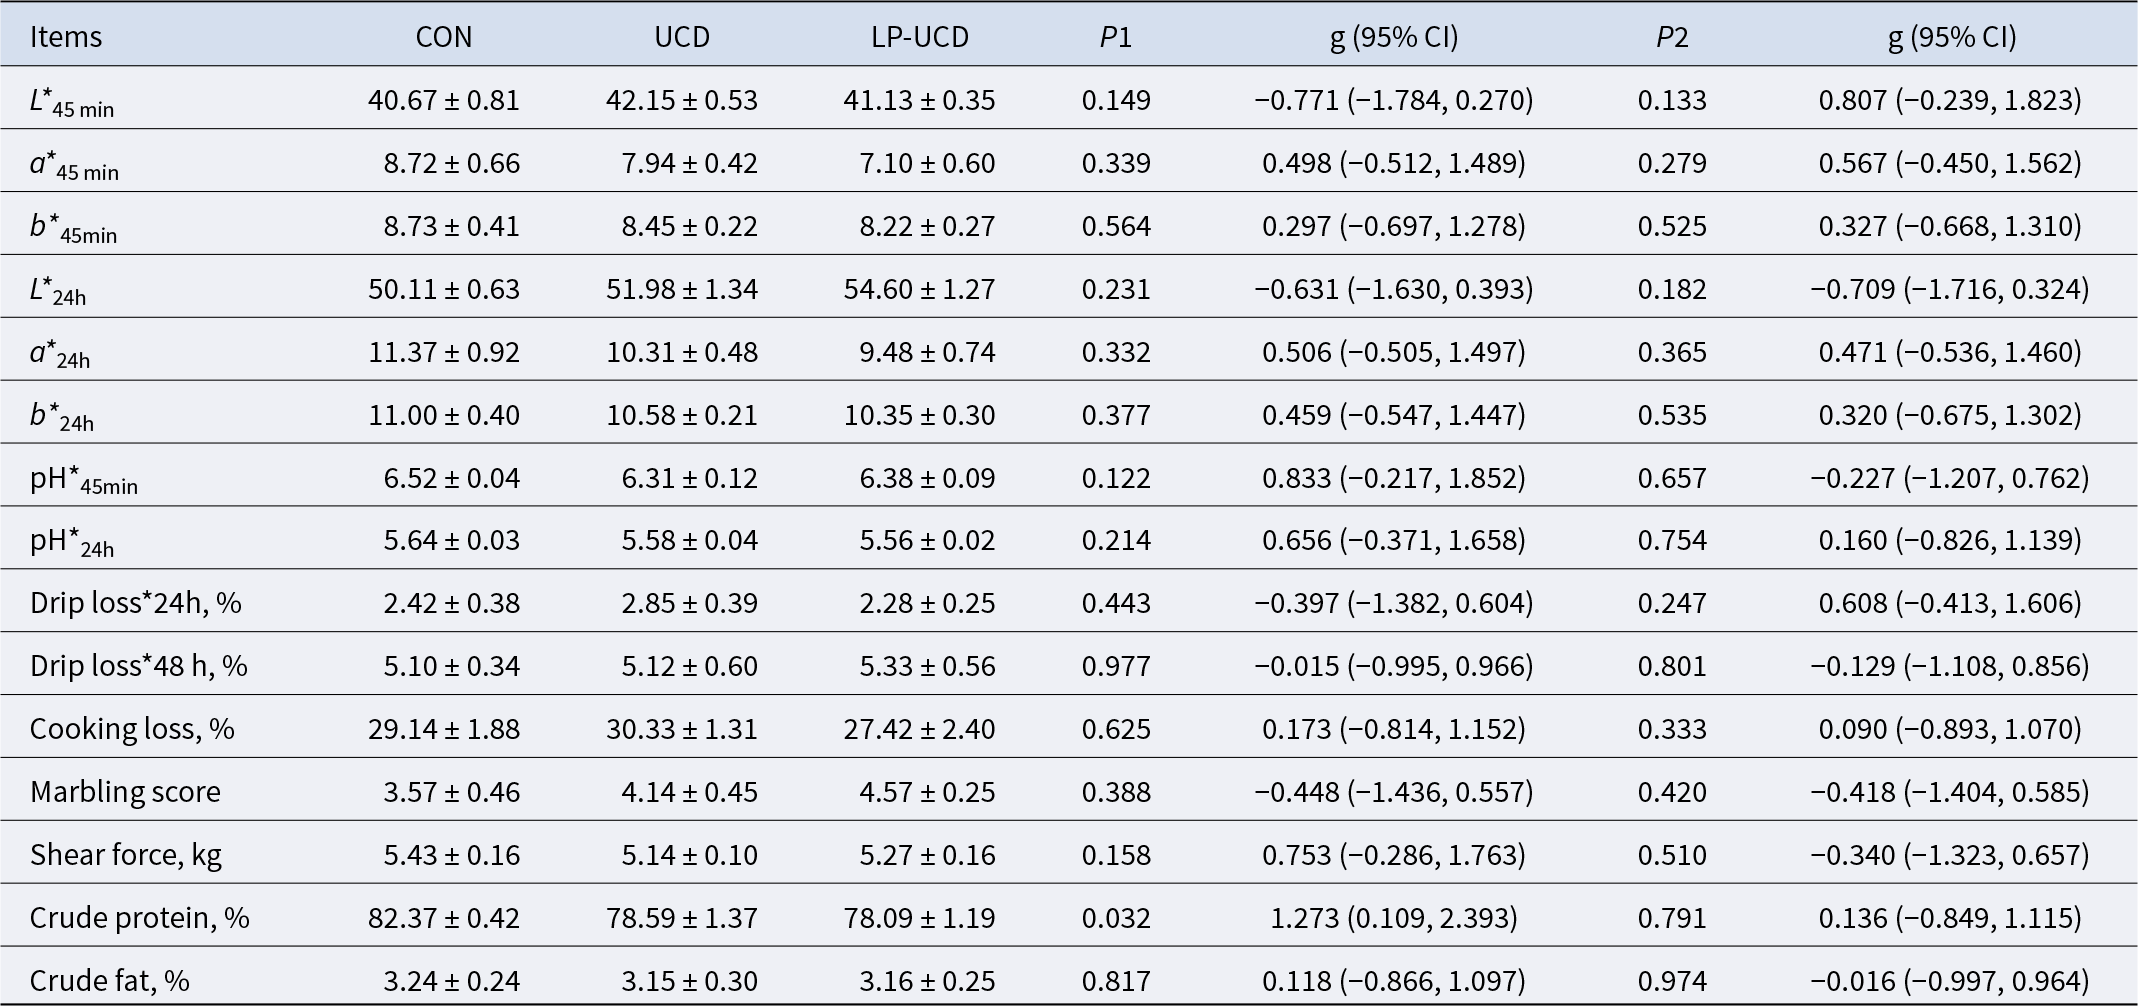
Table 6 Long description
Meat quality outcomes are listed for Items across three groups, CON, UCD, and LP-UCD, with P1 and effect size g with 95% confidence interval for CON versus UCD, and P2 and g with 95% confidence interval for UCD versus LP-UCD. Color measures at 45 minutes were L star 40.67 plus or minus 0.81 in CON, 42.15 plus or minus 0.53 in UCD, and 41.13 plus or minus 0.35 in LP-UCD; a star 8.72 plus or minus 0.66, 7.94 plus or minus 0.42, and 7.10 plus or minus 0.60; b star 8.73 plus or minus 0.41, 8.45 plus or minus 0.22, and 8.22 plus or minus 0.27. Color measures at 24 hours were L star 50.11 plus or minus 0.63 in CON, 51.98 plus or minus 1.34 in UCD, and 54.60 plus or minus 1.27 in LP-UCD; a star 11.37 plus or minus 0.92, 10.31 plus or minus 0.48, and 9.48 plus or minus 0.74; b star 11.00 plus or minus 0.40, 10.58 plus or minus 0.21, and 10.35 plus or minus 0.30. pH at 45 minutes was 6.52 plus or minus 0.04 in CON, 6.31 plus or minus 0.12 in UCD, and 6.38 plus or minus 0.09, and pH at 24 hours was 5.64 plus or minus 0.03, 5.58 plus or minus 0.04, and 5.56 plus or minus 0.02. Drip loss at 24 hours percent was 2.42 plus or minus 0.38 in CON, 2.85 plus or minus 0.39 in UCD, and 2.28 plus or minus 0.25, and drip loss at 48 hours percent was 5.10 plus or minus 0.34, 5.12 plus or minus 0.60, and 5.33 plus or minus 0.56; cooking loss percent was 29.14 plus or minus 1.88, 30.33 plus or minus 1.31, and 27.42 plus or minus 2.40. Marbling score was 3.57 plus or minus 0.46 in CON, 4.14 plus or minus 0.45 in UCD, and 4.57 plus or minus 0.25, and shear force in kg was 5.43 plus or minus 0.16, 5.14 plus or minus 0.10, and 5.27 plus or minus 0.16. Composition measures were crude protein percent 82.37 plus or minus 0.42 in CON, 78.59 plus or minus 1.37 in UCD, and 78.09 plus or minus 1.19, and crude fat percent 3.24 plus or minus 0.24, 3.15 plus or minus 0.30, and 3.16 plus or minus 0.25; for all other rows, P1 and P2 values shown are greater than 0.05.
Note: Values are mean ± standard error (n = 7). CON: sow corn-soybean meal diet – offspring basal diet; UCD: sow unconventional diet – offspring basal diet; LP-UCD: sow unconventional low-protein diet – offspring basal diet. L*: brightness; a*: redness; b*: yellowness; P1: CON vs. UCD; P2: UCD vs. LP-UCD.
Expression of metabolism-related genes in longissimus dorsi muscle and liver
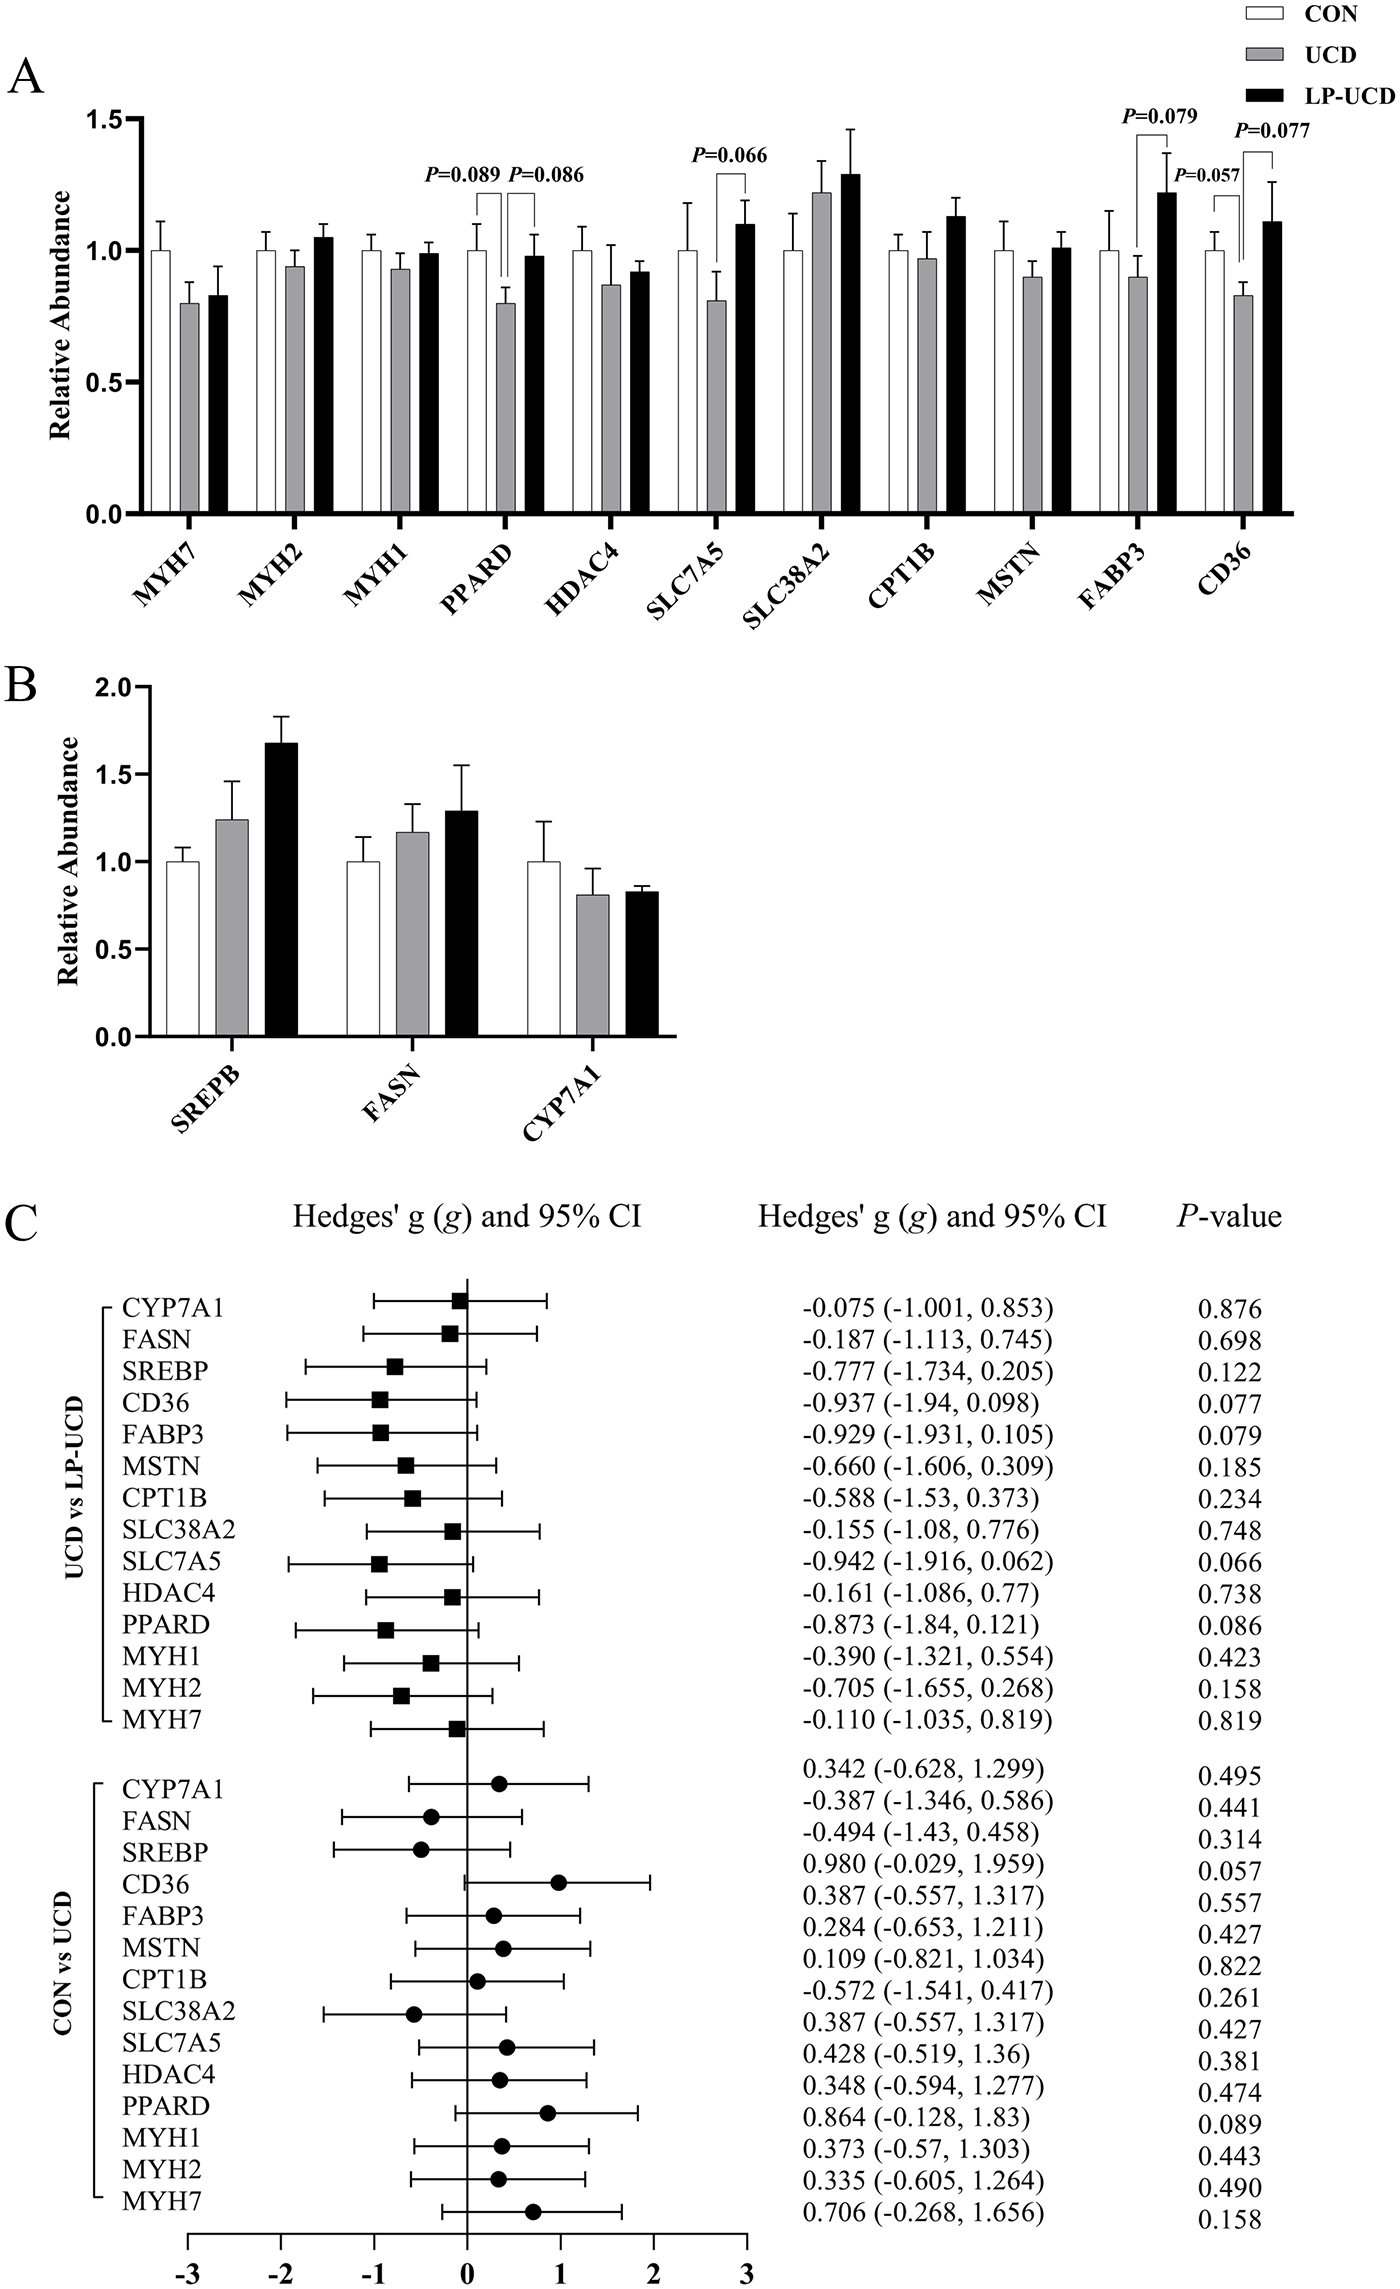
Compared with CON group, UCD group showed no significant differences in the expression of myofiber type-related genes in the longissimus dorsi muscle, but there were tendencies to decrease the expression of peroxisome proliferator-activated receptor delta (PPARD, P = 0.089, Fig. 1) and CD36 molecule (CD36, P = 0.057). Compared with UCD group, LP-UCD group showed tendencies to increase expression of PPARD (P = 0.086), solute carrier family 7 member 5 (SLC7A5, P = 0.066), fatty acid binding protein 3 (FABP3, P = 0.079), and CD36 (P = 0.077).
Effects of unconventional diets and unconventional low-protein diets in gestating sows on the muscle fiber types and expression of lipid metabolism-related genes of offspring. (A) Muscle fiber types and lipid metabolism-related genes in Longissimus dorsi muscle. (B) Lipid metabolism-related genes in liver. (C) Forest plot of Hedges’ g effect sizes (95% CI) and P-values for pairwise comparisons between CON vs. UCD and UCD vs. LP-UCD.
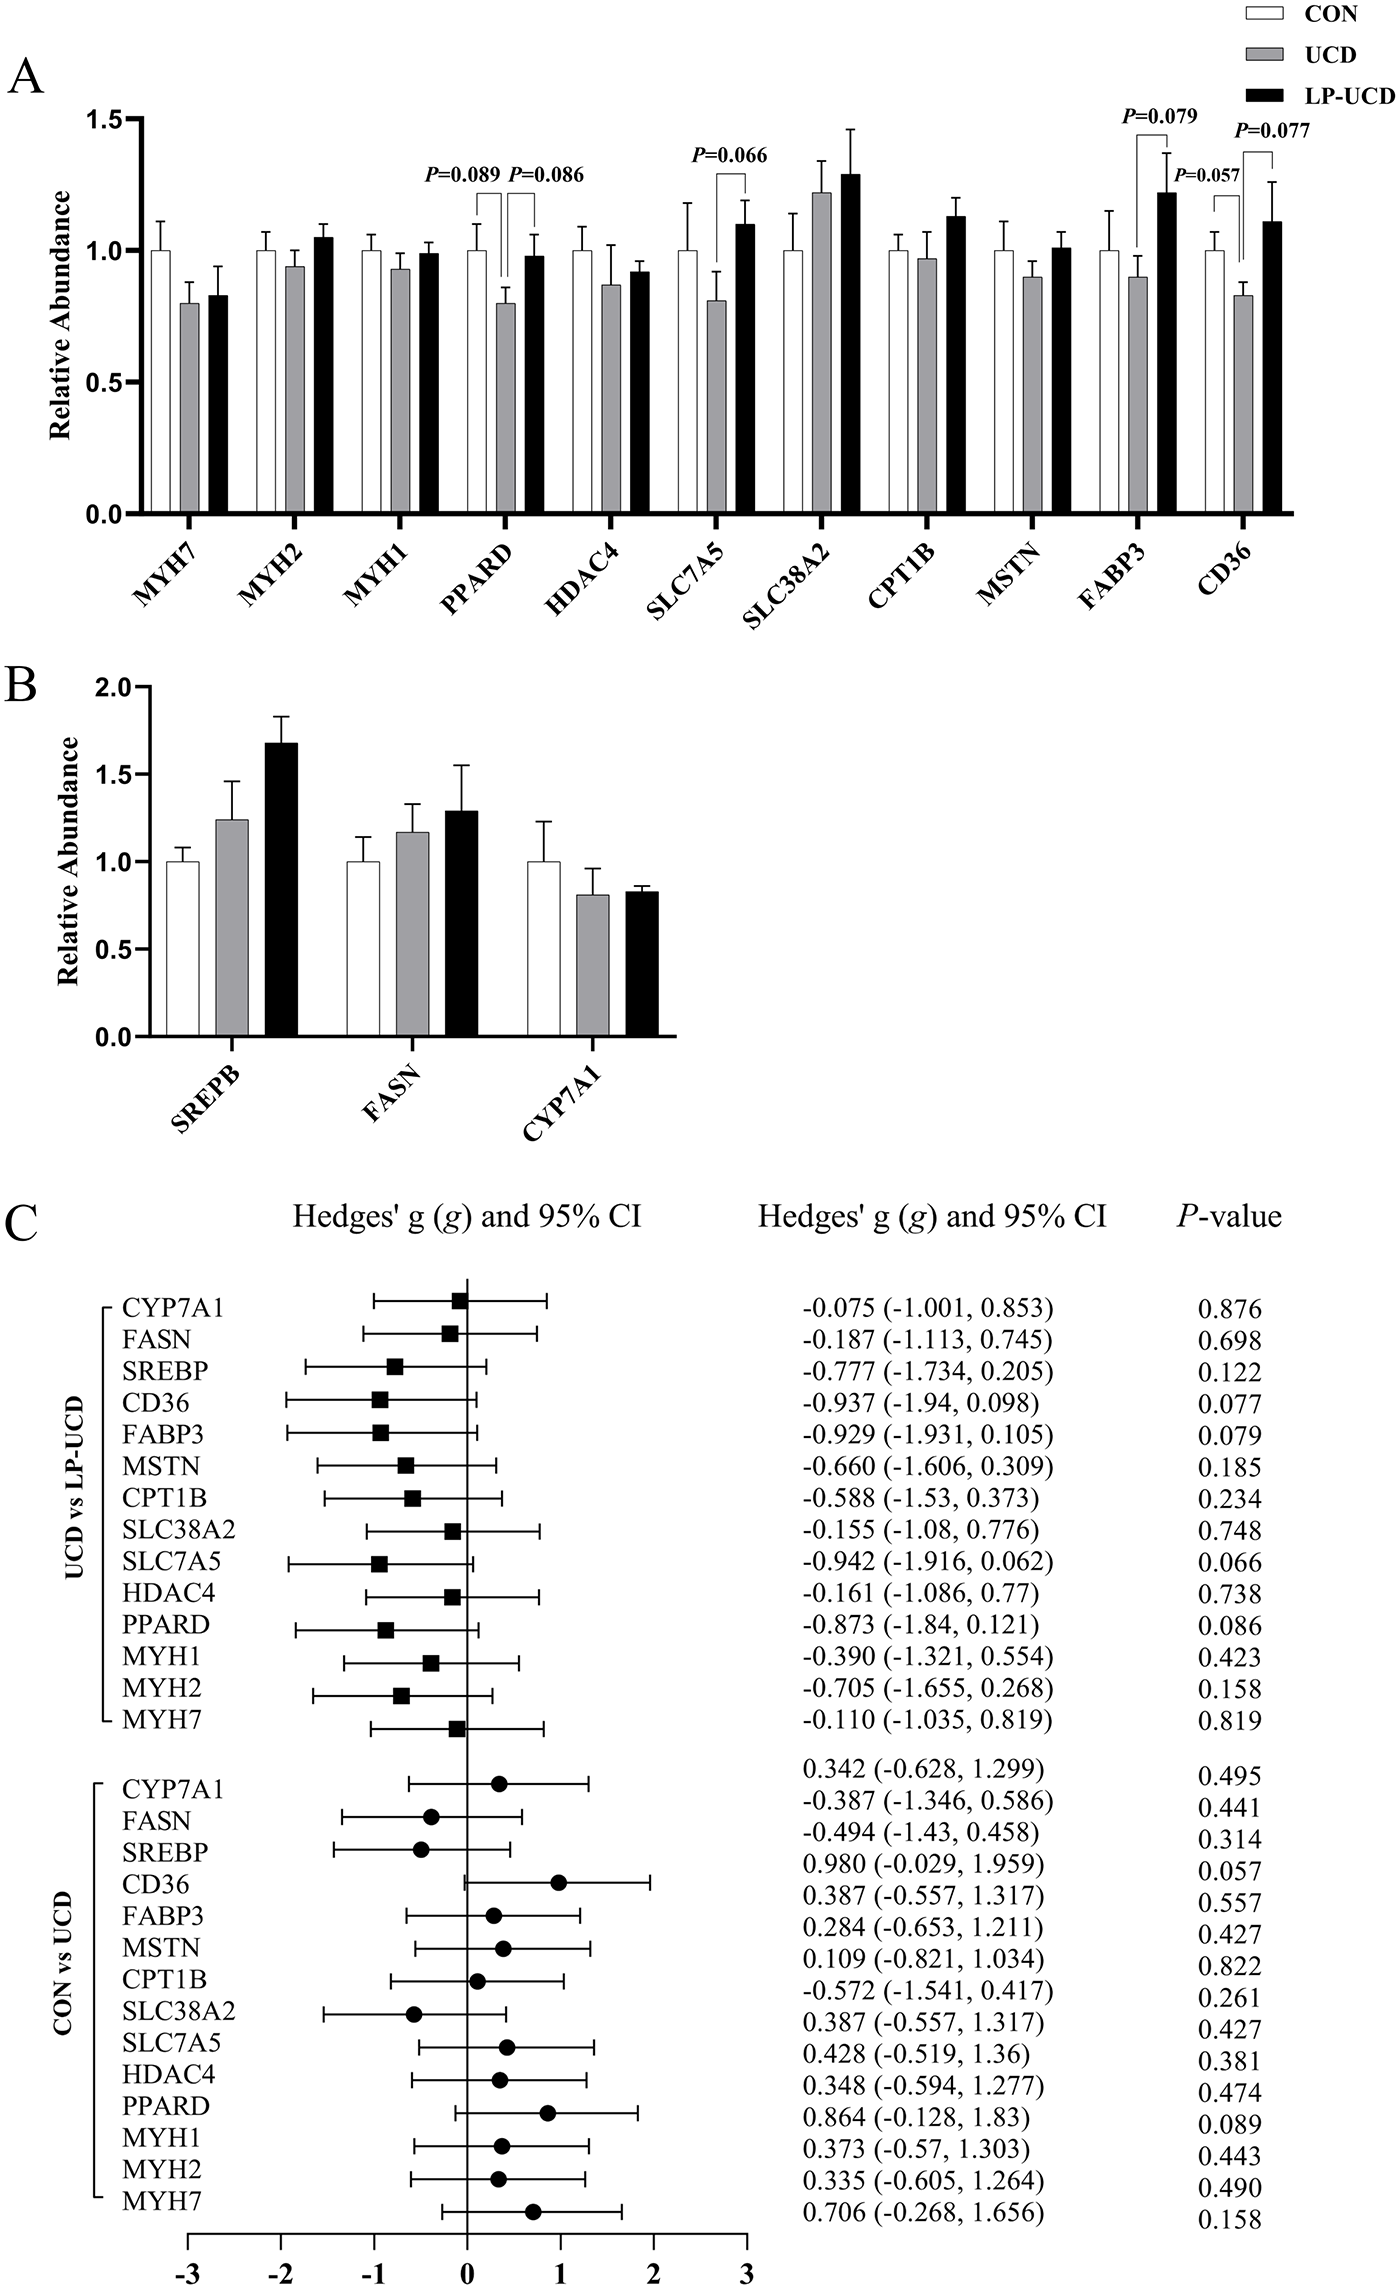
Figure 1 Long description
A bar chart of gene expression in the Longissimus dorsi muscle. The x-axis represents genes: MYH7, MYH1, MYH2, PPARD, HDAC4, SLC7A5, SLC3A2, CPT1B, FASN, FABP3, CD36. The y-axis is labeled Relative Abundance, unitless, ranging from 0.0 to 1.5. Groups are CON, UCD, LP UCD. Notable P values include PPARD at 0.089 and CD36 at 0.057, indicating trends but not statistical significance. Panel B shows a bar chart of liver gene expression. The x-axis represents genes: SREBP, FASN, CPT1A1. The y-axis is labeled Relative Abundance, unitless, ranging from 0.0 to 2.0. Groups are CON, UCD, LP UCD. Panel C shows a forest plot of Hedges g effect sizes for gene comparisons between groups. The x-axis is labeled Effect Size (Hedges g), ranging from minus 3 to 3. No confidence intervals exclude zero, indicating no statistically significant effects. P values around 0.057 to 0.096 suggest trends. The plot includes genes like CYP7A1, FASN, SREBP, CD36, FABP3, CPT1B, CPT1A, SLC3A2, SLC7A5, HDAC4, PPARD, MYH1, MYH2, MYH7. Overall, the data show tendencies in gene expression changes but lack significant differences.
Short-chain fatty acids
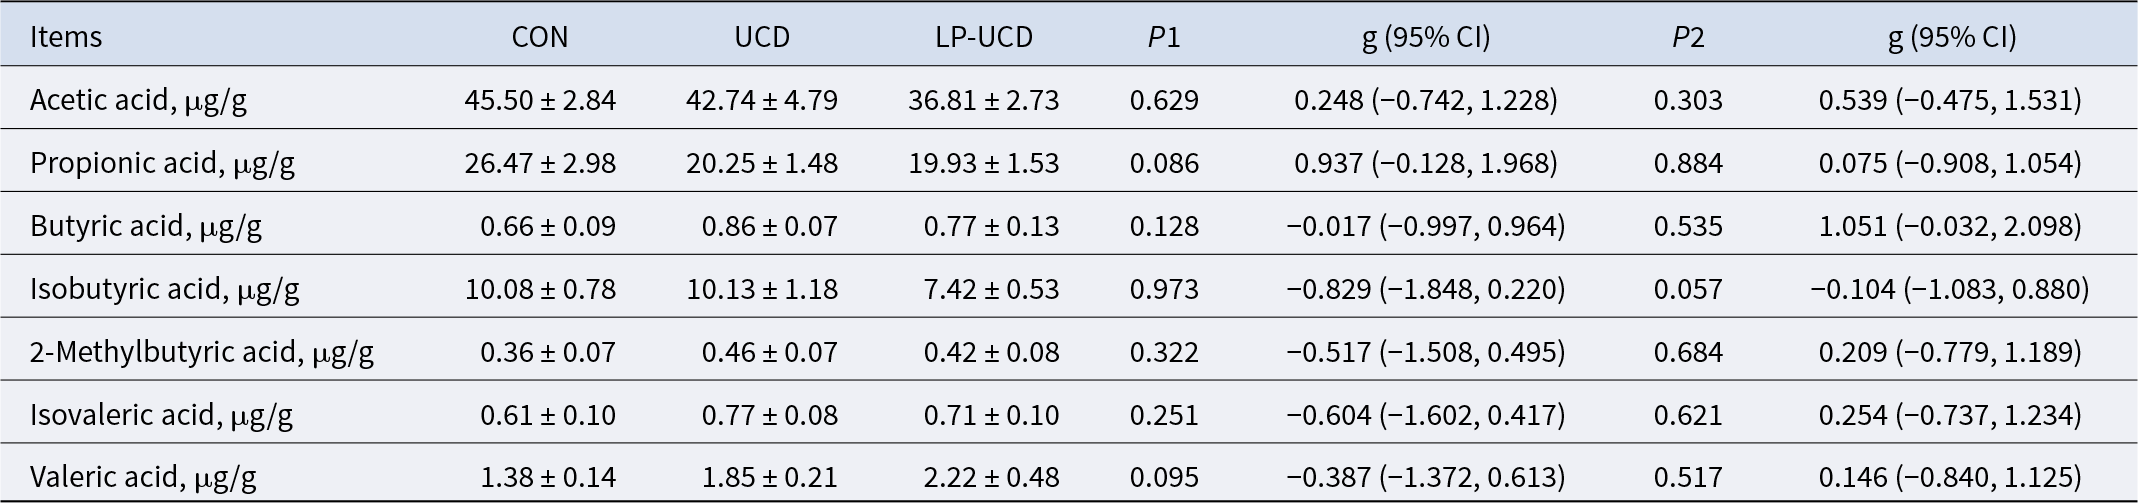
Compared with CON group, UCD group showed a tendency to decrease propionic acid content (P = 0.086, Table 7) and a tendency to increase valeric acid content (P = 0.095, Table 7). Compared with UCD group, LP-UCD group showed a tendency to decrease isovaleric acid content (P = 0.057).
Effects of unconventional diets or unconventional low-protein diets in gestating sows on short-chain fatty acid content of offspring
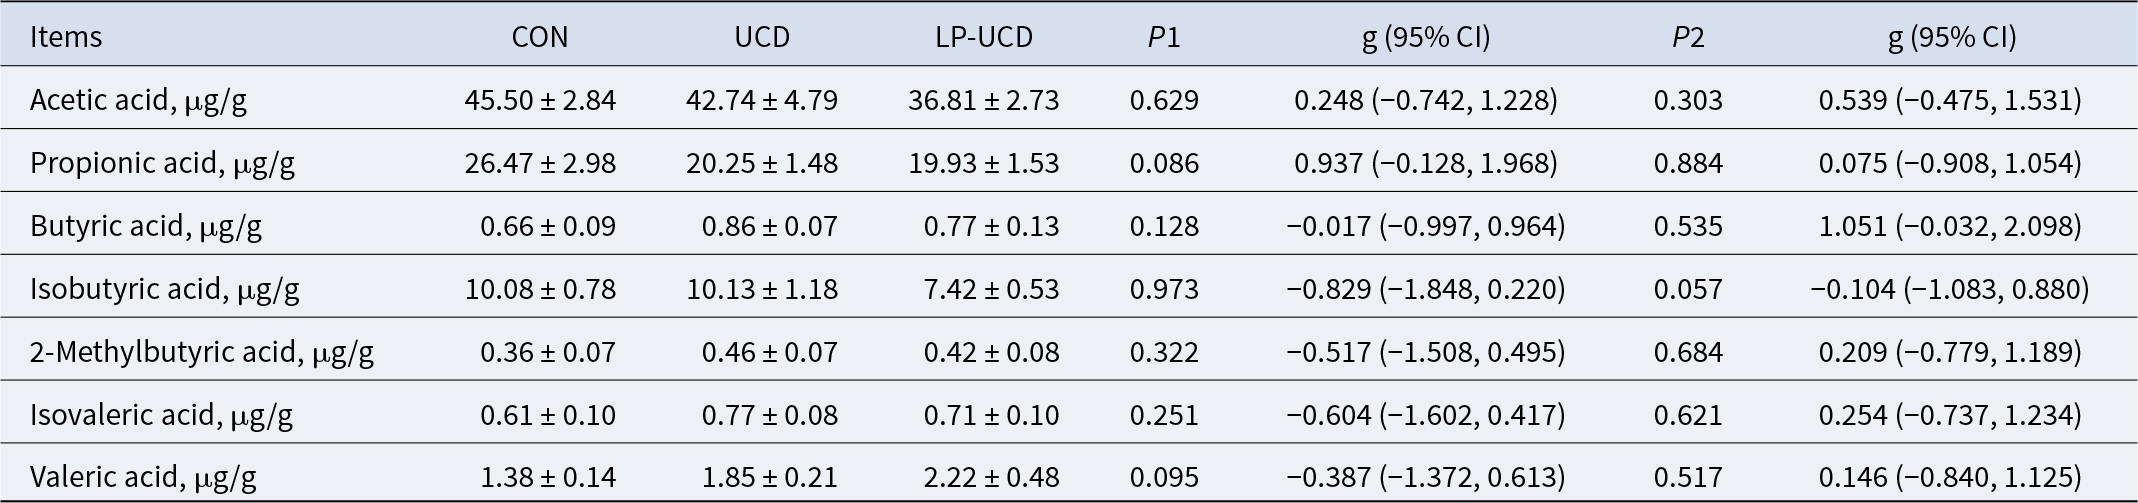
Table 7 Long description
Short chain fatty acid content is reported in micrograms per gram for offspring in three groups labeled, con, ucd, and lp ucd, with each value given as mean plus or minus standard error. For acetic acid, means are 45.50 for con, 42.74 for ucd, and 36.81 for lp ucd, with p1 0.629 and p2 0.303, and g values 0.248 with 95 percent confidence interval from minus 0.742 to 1.228 for p1 and 0.539 with 95 percent confidence interval from minus 0.475 to 1.531 for p2. For propionic acid, means are 26.47, 20.25, and 19.93, with p1 0.086 and p2 0.884, and g values 0.937 with 95 percent confidence interval from minus 0.128 to 1.968 and 0.075 with 95 percent confidence interval from minus 0.908 to 1.054. For butyric acid, means are 0.66, 0.86, and 0.77, with p1 0.128 and p2 0.535, and g values minus 0.017 with 95 percent confidence interval from minus 0.997 to 0.964 and 1.051 with 95 percent confidence interval from minus 0.032 to 2.098. For isobutyric acid, means are 10.08, 10.13, and 7.42, with p1 0.973 and p2 0.057, and g values minus 0.829 with 95 percent confidence interval from minus 1.848 to 0.220 and minus 0.104 with 95 percent confidence interval from minus 1.083 to 0.880. For 2 methylbutyric acid, means are 0.36, 0.46, and 0.42, with p1 0.322 and p2 0.684, and g values minus 0.517 with 95 percent confidence interval from minus 1.508 to 0.495 and 0.209 with 95 percent confidence interval from minus 0.779 to 1.189. For isovaleric acid, means are 0.61, 0.77, and 0.71, with p1 0.251 and p2 0.621, and g values minus 0.604 with 95 percent confidence interval from minus 1.602 to 0.417 and 0.254 with 95 percent confidence interval from minus 0.737 to 1.234. For valeric acid, means are 1.38, 1.85, and 2.22, with p1 0.095 and p2 0.517, and g values minus 0.387 with 95 percent confidence interval from minus 1.372 to 0.613 and 0.146 with 95 percent confidence interval from minus 0.840 to 1.125.
Note: Values are mean ± standard error (n = 7). CON: sow corn-soybean meal diet – offspring basal diet; UCD: sow unconventional diet – offspring basal diet; LP-UCD: sow unconventional low-protein diet – offspring basal diet; P1: CON vs. UCD; P2: UCD vs. LP-UCD.
Microbiota
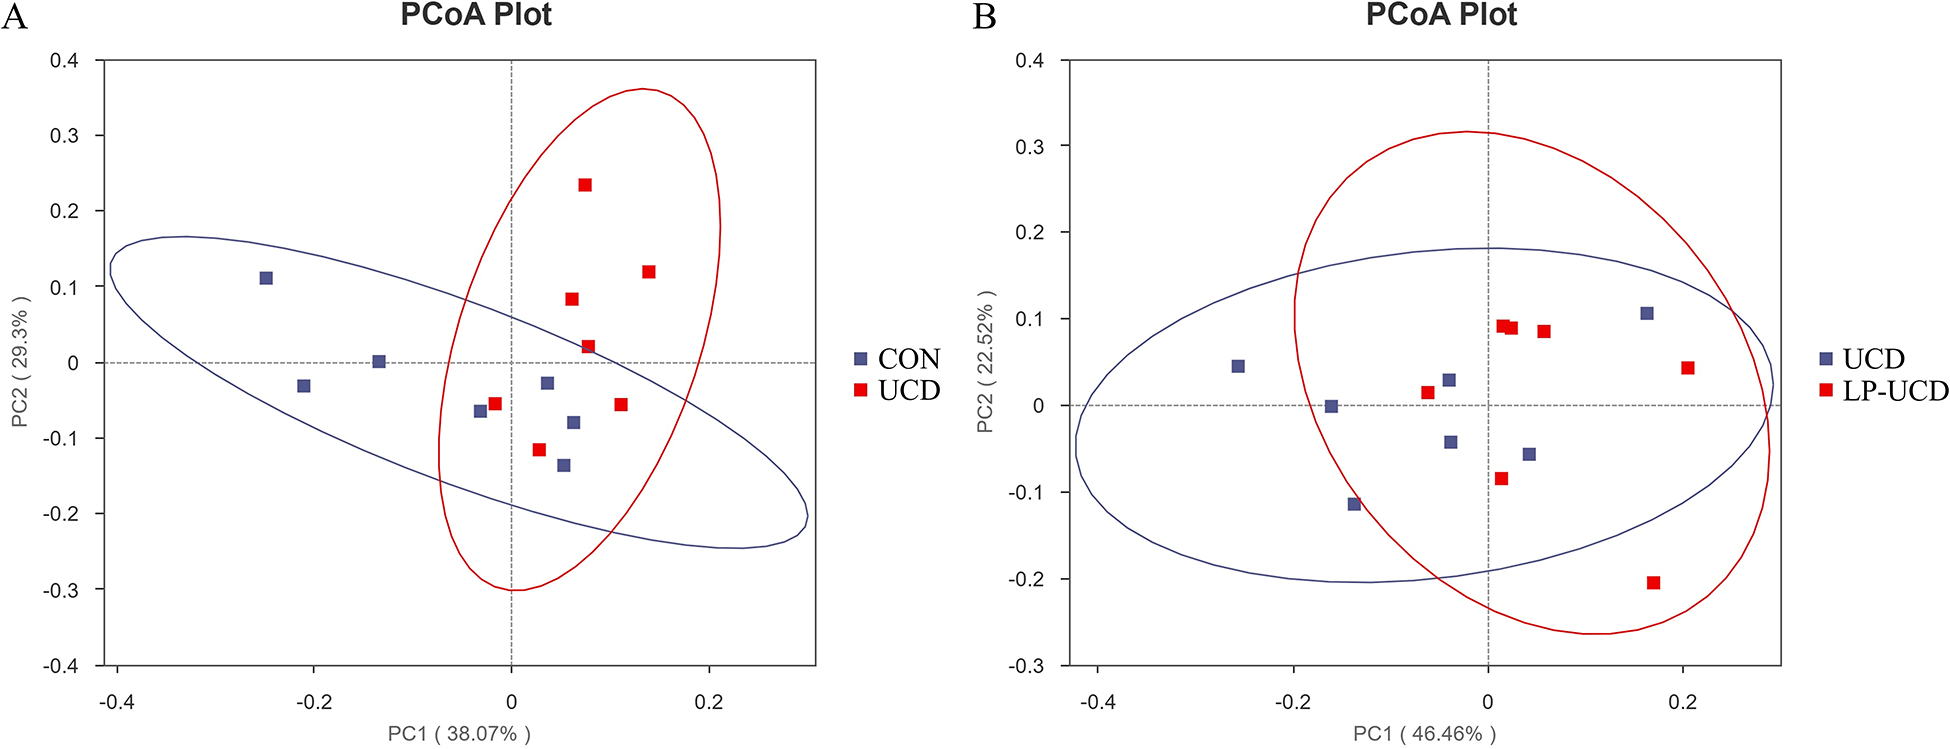
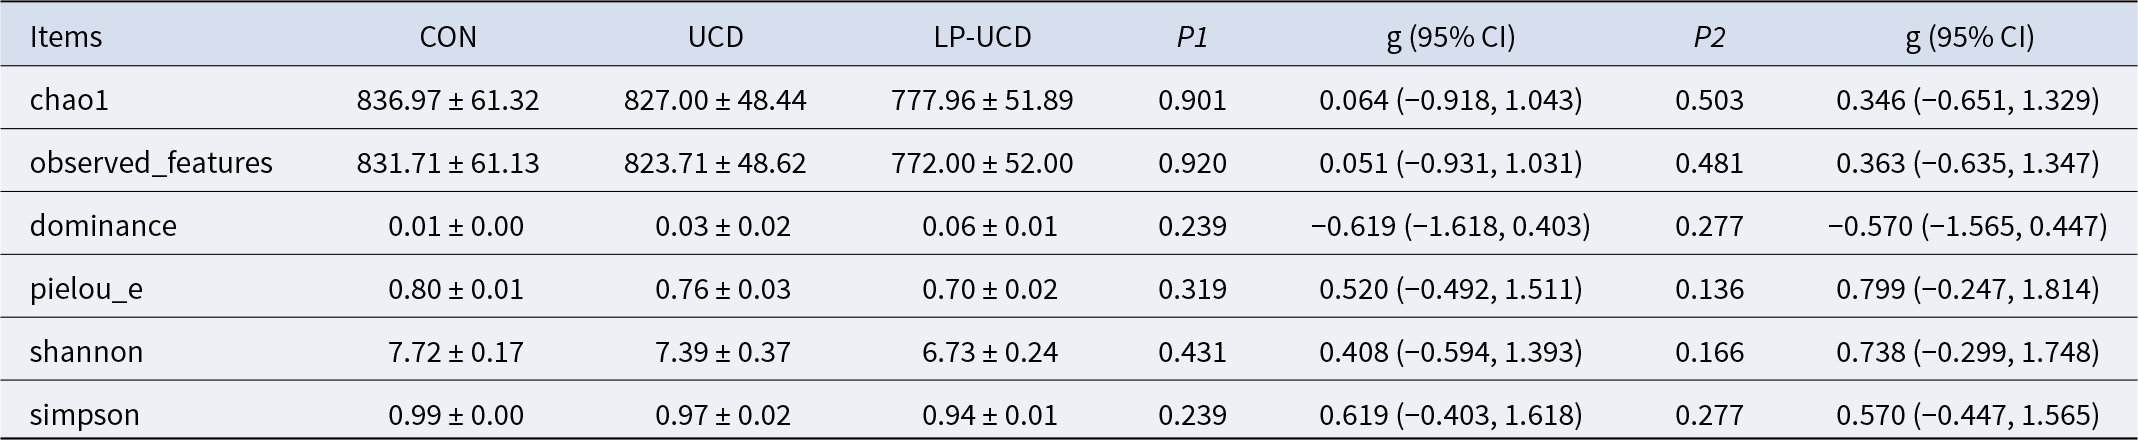
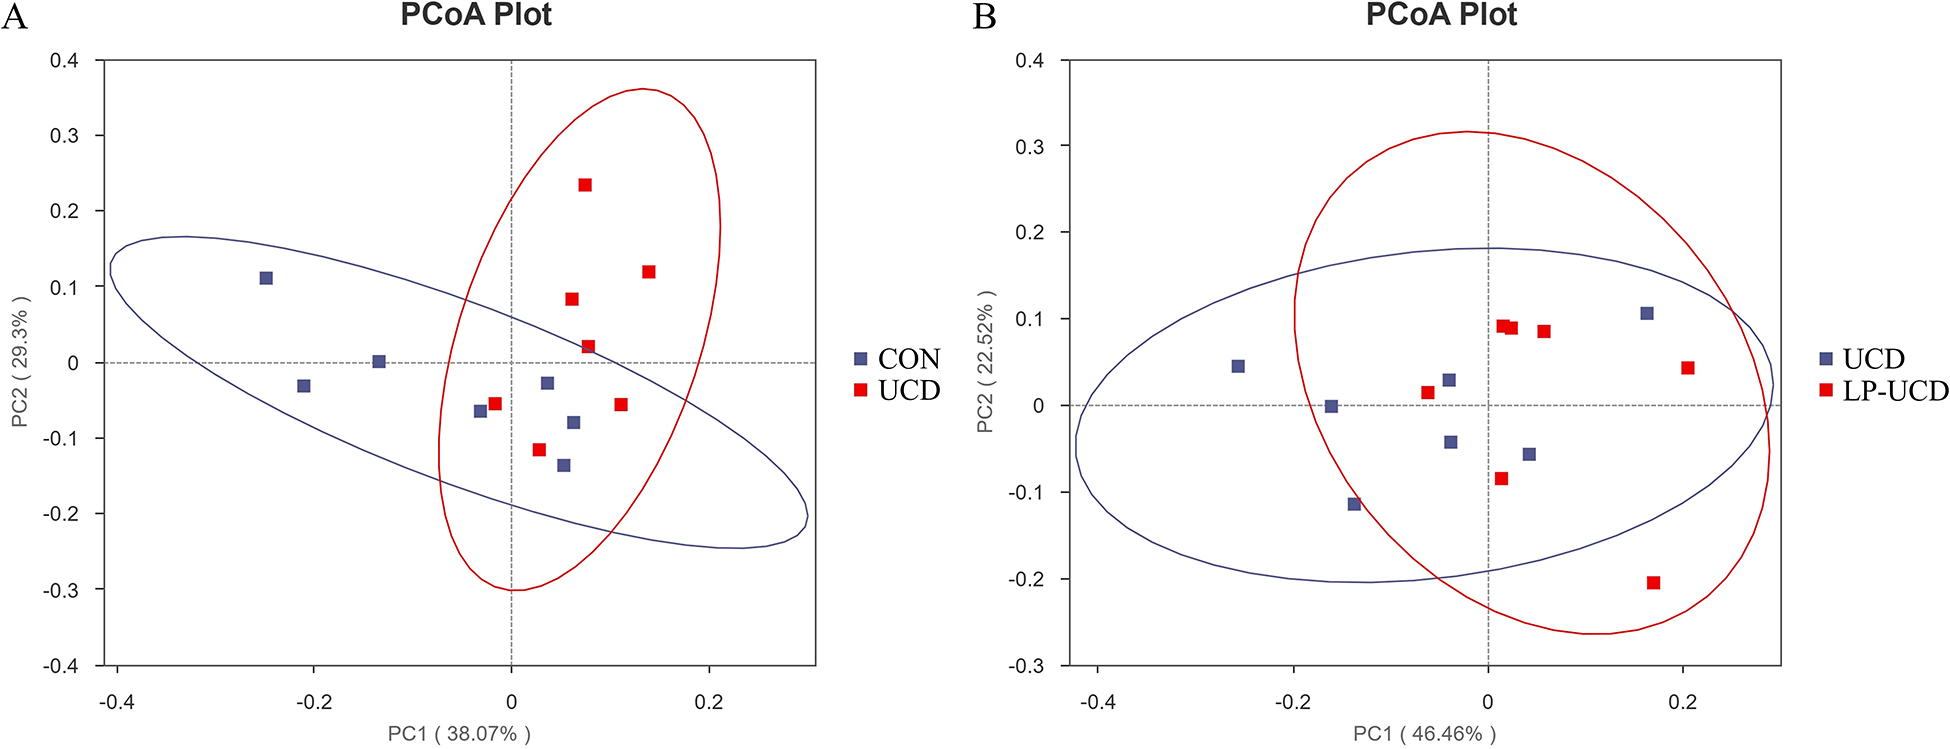
Alpha diversity analysis of the colonic microbiota in finishing pigs across the three treatment groups revealed that neither the UCD nor LP-UCD groups significantly affected the alpha diversity (Table 8). Similarly, neither treatment significantly affected the beta diversity of the colonic microbiota (Fig. 2). No significant separation was observed between CON and UCD (R 2 = 0.098, P = 0.312) nor between UCD and LP-UCD (R 2 = 0.124, P = 0.186) (Table 9).
Effects of unconventional diets and unconventional low-protein diets in gestating sows on the α-diversity of the colonic microbiota in offspring
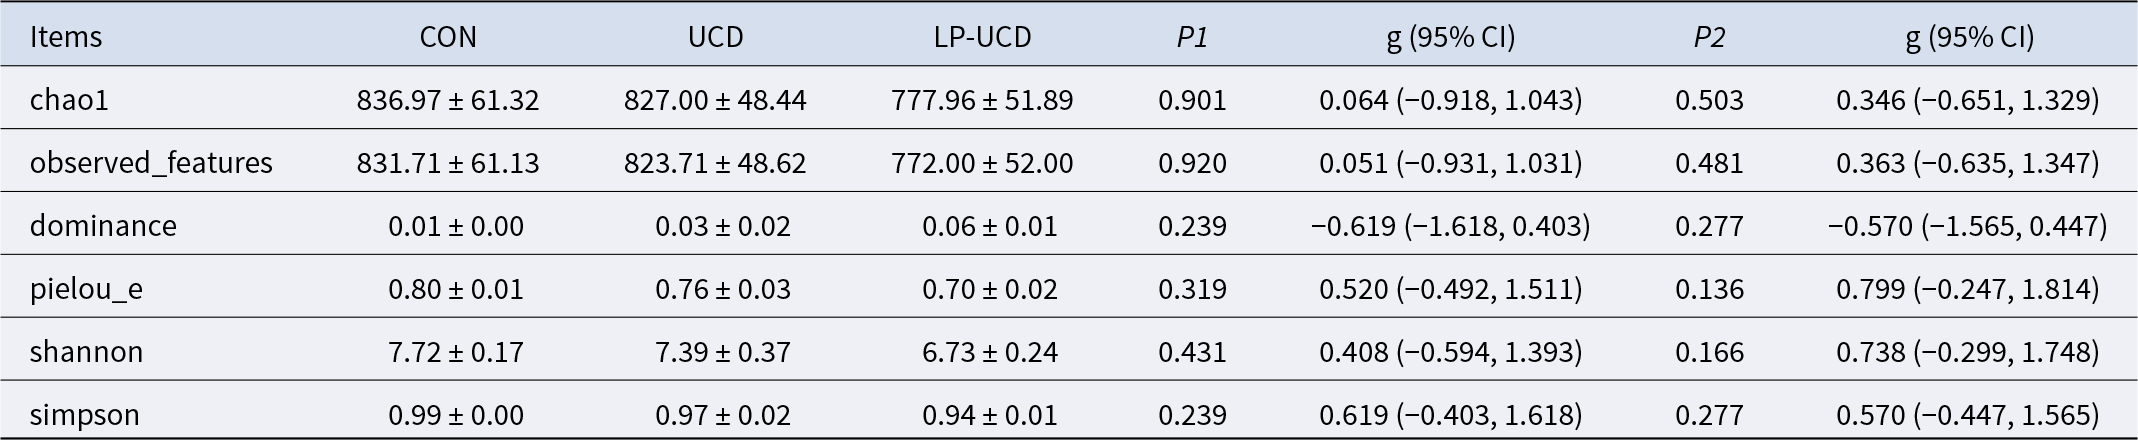
Table 8 Long description
Alpha diversity indices are reported for three groups labeled con, ucd, and lp ucd, with p1 comparing con versus ucd and p2 comparing ucd versus lp ucd; each comparison also lists g with a 95 percent confidence interval. For chao1, values are 836.97 plus or minus 61.32 for con, 827.00 plus or minus 48.44 for ucd, and 777.96 plus or minus 51.89 for lp ucd; p1 is 0.901 with g 0.064 and a 95 percent confidence interval from minus 0.918 to 1.043, and p2 is 0.503 with g 0.346 and a 95 percent confidence interval from minus 0.651 to 1.329. For observed features, values are 831.71 plus or minus 61.13, 823.71 plus or minus 48.62, and 772.00 plus or minus 52.00; p1 is 0.920 with g 0.051 and a 95 percent confidence interval from minus 0.931 to 1.031, and p2 is 0.481 with g 0.363 and a 95 percent confidence interval from minus 0.635 to 1.347. For dominance, values are 0.01 plus or minus 0.00, 0.03 plus or minus 0.02, and 0.06 plus or minus 0.01; p1 is 0.239 with g minus 0.619 and a 95 percent confidence interval from minus 1.618 to 0.403, and p2 is 0.277 with g minus 0.570 and a 95 percent confidence interval from minus 1.565 to 0.447. For pielou e, values are 0.80 plus or minus 0.01, 0.76 plus or minus 0.03, and 0.70 plus or minus 0.02; p1 is 0.319 with g 0.520 and a 95 percent confidence interval from minus 0.492 to 1.511, and p2 is 0.136 with g 0.799 and a 95 percent confidence interval from minus 0.247 to 1.814. For shannon, values are 7.72 plus or minus 0.17, 7.39 plus or minus 0.37, and 6.73 plus or minus 0.24; p1 is 0.431 with g 0.408 and a 95 percent confidence interval from minus 0.594 to 1.393, and p2 is 0.166 with g 0.738 and a 95 percent confidence interval from minus 0.299 to 1.748. For simpson, values are 0.99 plus or minus 0.00, 0.97 plus or minus 0.02, and 0.94 plus or minus 0.01; p1 is 0.239 with g 0.619 and a 95 percent confidence interval from minus 0.403 to 1.618, and p2 is 0.277 with g 0.570 and a 95 percent confidence interval from minus 0.447 to 1.565.
Note: Values are mean ± standard error (n = 7). CON: sow corn-soybean meal diet – offspring basal diet; UCD: sow unconventional diet – offspring basal diet; LP-UCD: sow unconventional low-protein diet – offspring basal diet; P1: CON vs. UCD; P2: UCD vs. LP-UCD.
PERMANOVA results based on weighted UniFrac distance

Table 9 Long description
PERMANOVA results are reported for weighted UniFrac distance, with columns for comparison, distance method, R2, pseudo F, and p value. Three comparisons are listed: overall across CON, UCD, and LP UCD; CON vs UCD; and UCD vs LP UCD. For the overall comparison, R2 is 0.152, pseudo F is 1.567, and p value is 0.208. For CON vs UCD, R2 is 0.098, pseudo F is 1.087, and p value is 0.312. For UCD vs LP UCD, R2 is 0.124, pseudo F is 1.415, and p value is 0.186.
Note: (n = 7). CON: sow corn-soybean meal diet – offspring basal diet; UCD: sow unconventional diet – offspring basal diet; LP-UCD: sow unconventional low-protein diet – offspring basal diet. Permutations = 9999. R 2 indicates the effect size (variance explained by maternal diet).
Effects of unconventional diets and unconventional low-protein diets in gestating sows on the microbial β-diversity in the colonic content of offspring. (A) CON vs. UCD. (B) UCD vs. LP-UCD.
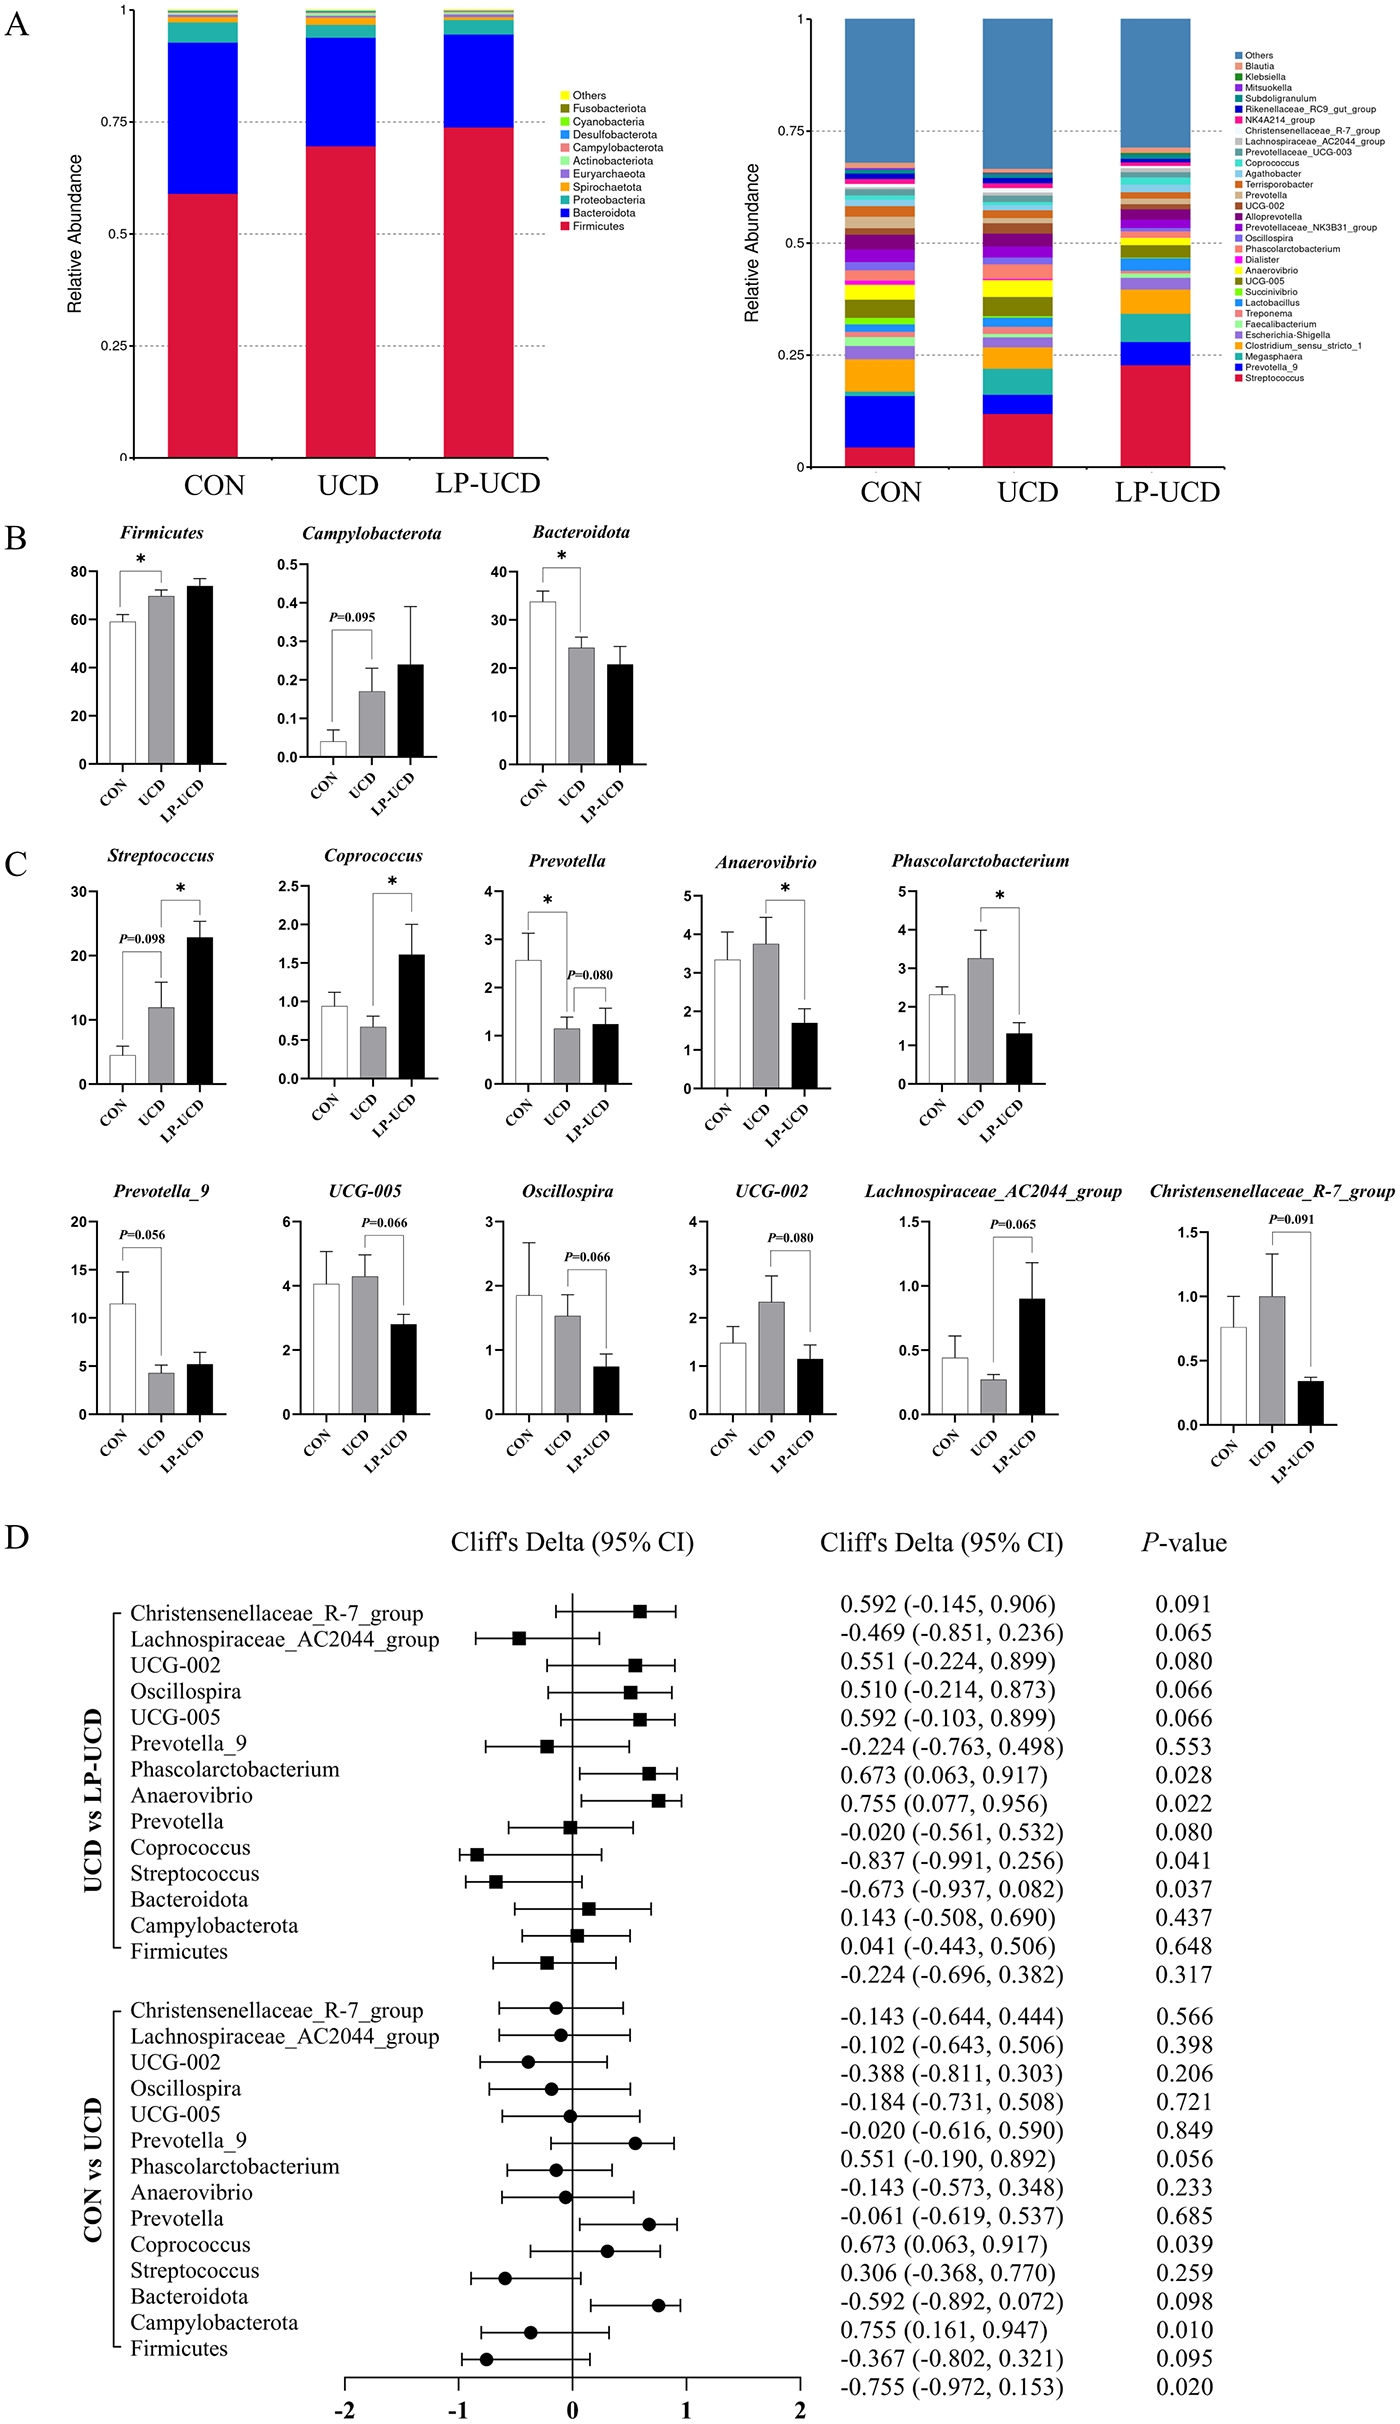
Regarding changes in the relative abundance of colonic microbiota at the phylum level: compared with CON group, UCD group increased the relative abundance of Firmicutes (P < 0.05, Fig. 3B) and showed a tendency to increase the relative abundance of Campylobacterota (P = 0.095), while it decreased the relative abundance of Bacteroidota (P < 0.05). Compared with UCD group, no significant changes were observed in the relative abundances of any phyla in LP-UCD group (Fig. 3B).
Effects of unconventional diets and unconventional low-protein diets in gestating sows on the microbial composition in the colonic content of offspring. (A) Relative abundance at the phylum level. (B) Relative abundance at the genus level. (C) Significance testing at the phylum and genus levels. (D) Forest plot of Cliff’s delta effect sizes (95% confidence intervals) for phylum-level (B) and genus-level (C) comparisons between CON vs. UCD and UCD vs. LP-UCD. P-values are indicated.
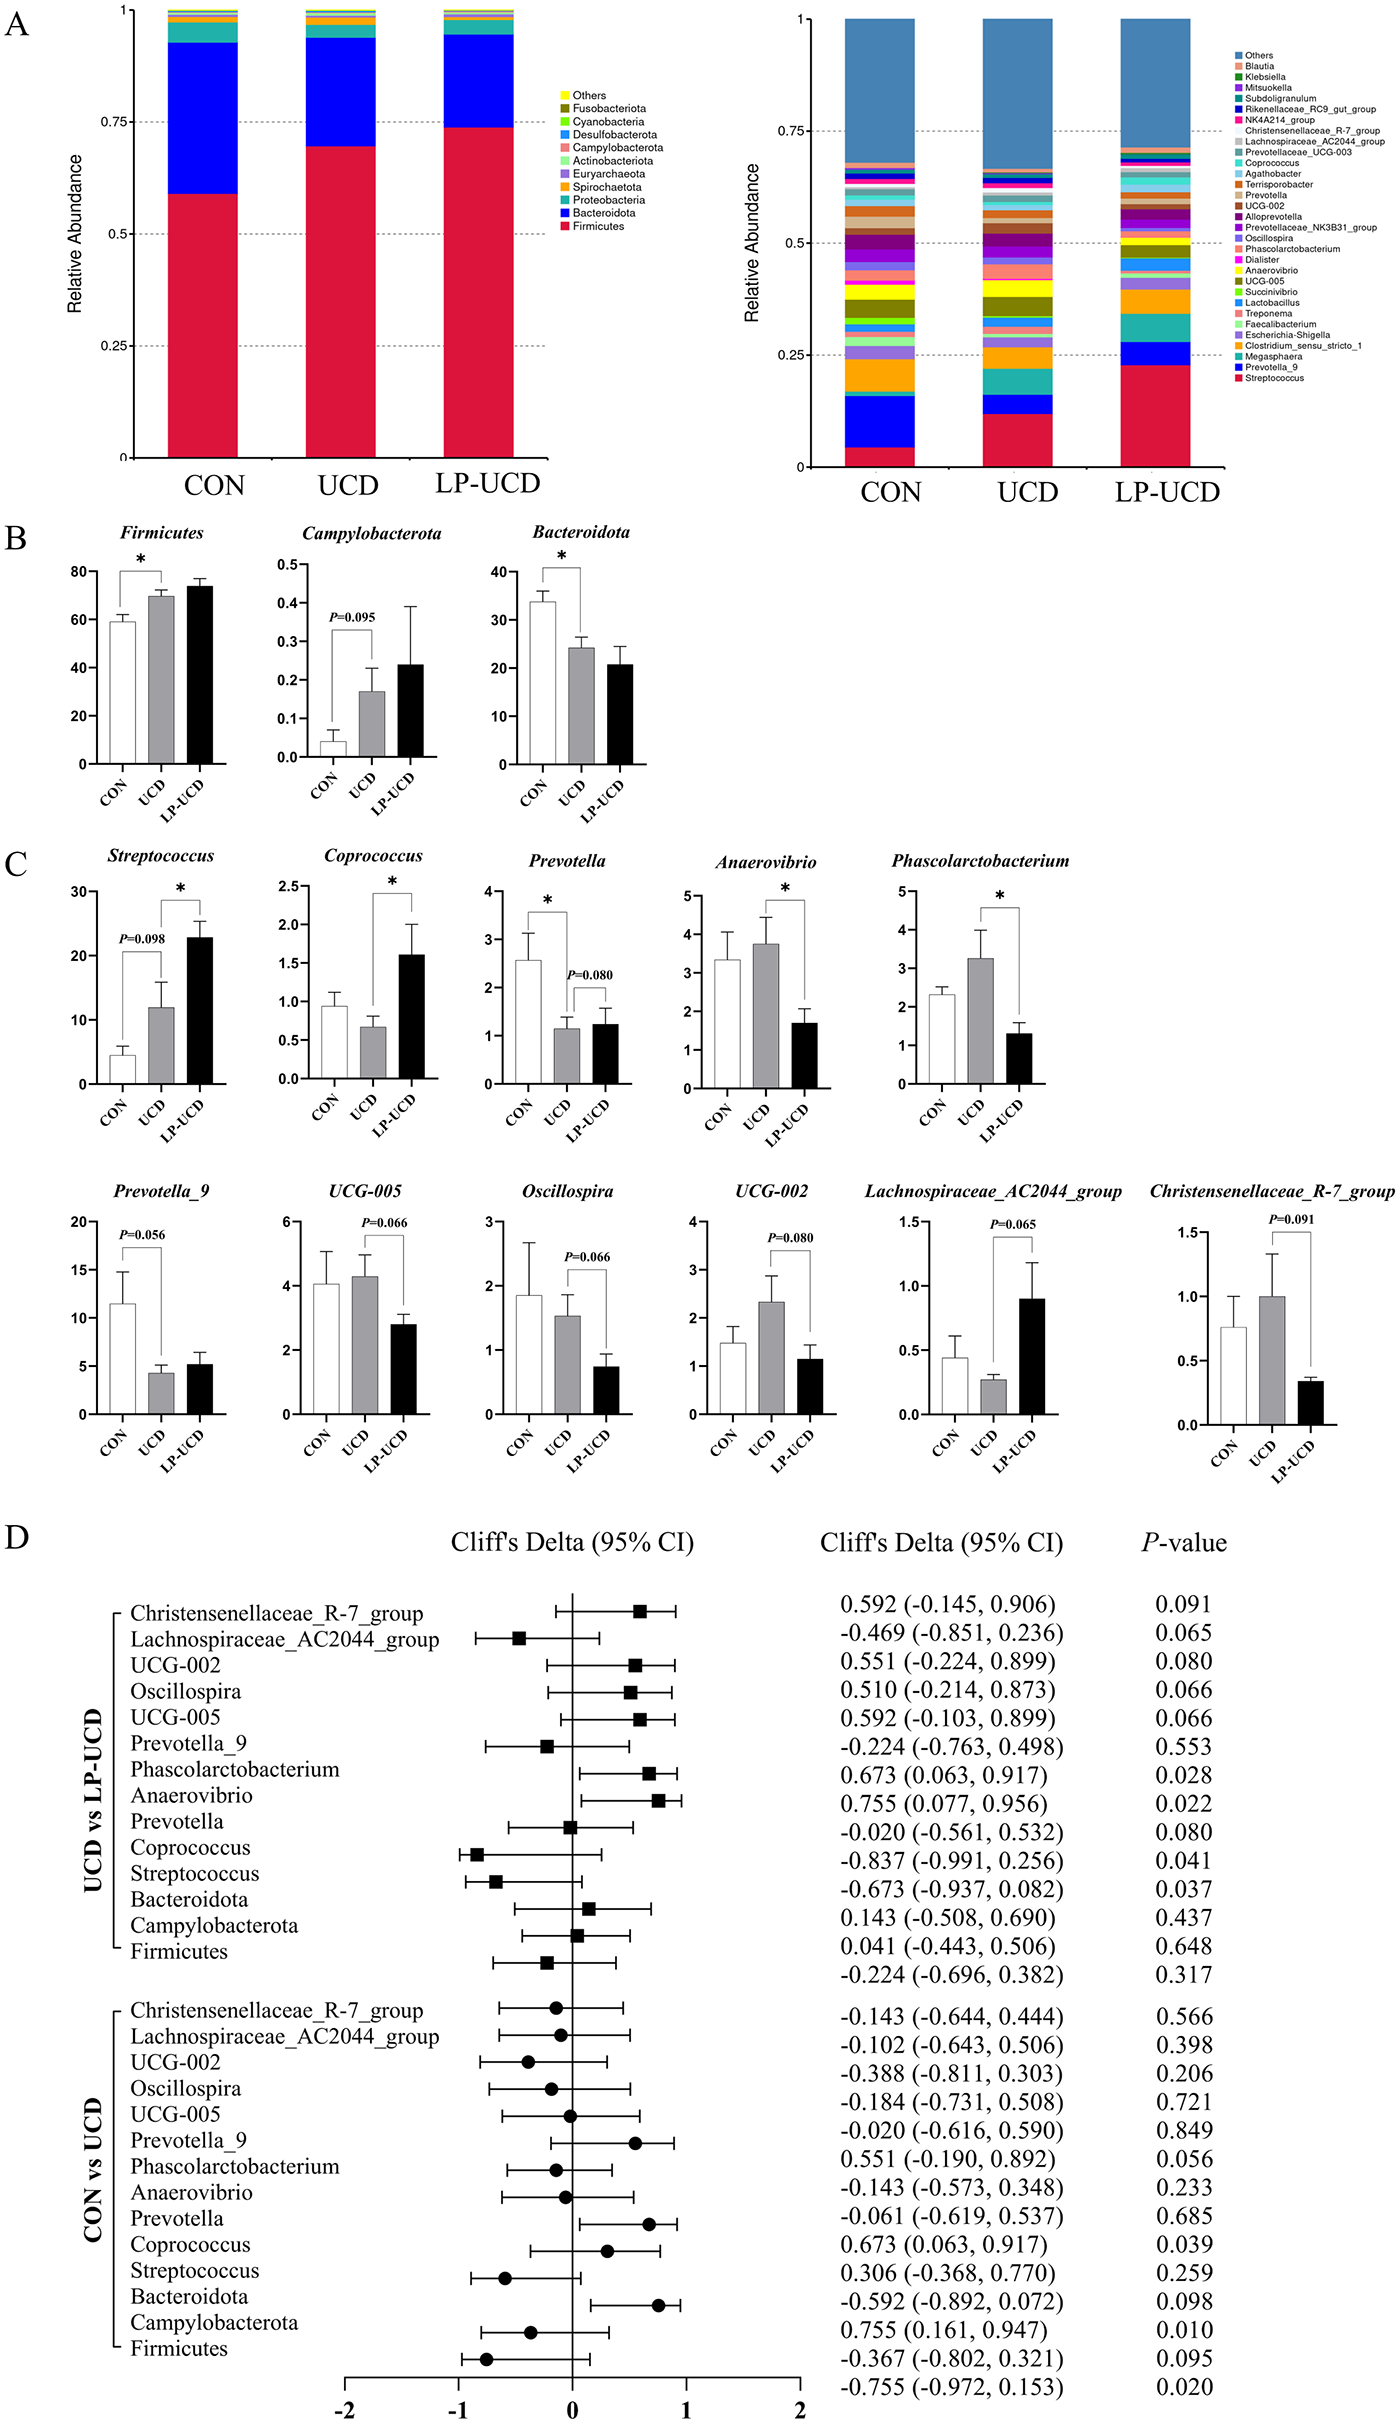
Figure 3 Long description
The composite figure contains four panels labeled A, B, C and D, comparing microbial composition across three groups: CON (conventional diet), UCD (unconventional diet) and LP-UCD (unconventional low-protein diet). Image A shows two stacked bar charts of relative abundance at the phylum level and genus level. The x-axis lists the three groups: CON, UCD and LP-UCD. The y-axis represents relative abundance as a fraction from 0 to 1. Each bar is divided into segments representing different phyla or genera. At the phylum level, Firmicutes, Bacteroidota and Campylobacterota are among the visible segments. At the genus level, multiple genera are represented by distinct segments across the three groups. Image B shows grouped bar charts for individual taxa at the phylum level. The x-axis labels the three groups: CON, UCD and LP-UCD. The y-axis represents relative abundance. Taxa shown include Firmicutes, Campylobacterota and Bacteroidota. Each bar includes error bars. Asterisks mark statistically significant differences between groups. Firmicutes appears higher in UCD compared to CON. Bacteroidota appears lower in UCD compared to CON. Image C shows grouped bar charts at the genus level. The x-axis lists the three groups: CON, UCD and LP-UCD. The y-axis represents relative abundance. Taxa shown include Streptococcus, Coprococcus, Prevotella, Anaerovibrio, Phascolarctobacterium, Prevotella 9, UCG-005, Oscillospira, UCG-002, Lachnospiraceae AC2044 group and Christensenellaceae R-7 group. Error bars are present on each bar. Asterisks indicate significant differences for select taxa between groups. Image D shows a forest plot of Cliff′s Delta effect sizes with 95 percent confidence intervals. The x-axis represents Cliff′s Delta values ranging from negative 2 to positive 2. The y-axis lists individual taxa names. Two comparison sets are shown: UCD vs LP-UCD (upper section) and CON vs UCD (lower section). Each row shows a point estimate with a horizontal line representing the 95 percent confidence interval. A vertical reference line is placed at 0. A column labeled P-value appears on the right side. For UCD vs LP-UCD, listed taxa and values include: Christensenellaceae R-7 group, 0.892 with 95 percent confidence interval negative 0.031 to 0.936, P-value 0.091; Lachnospiraceae AC2044 group, negative 0.469 with 95 percent confidence interval negative 0.831 to 0.230, P-value 0.065; UCG-005, 0.551 with 95 percent confidence interval 0.224 to 0.899, P-value 0.080; Prevotella 9, negative 0.734 with 95 percent confidence interval negative 0.763 to 0.691, P-value 0.053; Phascolarctobacterium, 0.073 with 95 percent confidence interval 0.083 to 0.917, P-value 0.028; Anaerovibrio, negative 0.260 with 95 percent confidence interval negative 0.280 to 0.532, P-value 0.026; Coprococcus, negative 0.671 with 95 percent confidence interval negative 0.937 to 0.083, P-value 0.057; Bacteroidota, 0.143 with 95 percent confidence interval negative 0.338 to 0.690, P-value 0.648; Campylobacterota, negative 0.400 with 95 percent confidence interval negative 0.441 to 0.500, P-value 0.317. For CON vs UCD, listed taxa and values include: Christensenellaceae R-7 group, negative 0.145 with 95 percent confidence interval negative 0.644 to 0.444, P-value 0.566; Lachnospiraceae AC2044 group, negative 0.384 with 95 percent confidence interval negative 0.644 to 0.444, P-value 0.566; UCG-005, negative 0.288 with 95 percent confidence interval negative 0.580 to 0.332, P-value 0.849; Prevotella 9, negative 0.030 with 95 percent confidence interval negative 0.516 to 0.590, P-value 0.849; Phascolarctobacterium, negative 0.073 with 95 percent confidence interval 0.083 to 0.917, P-value 0.039; Anaerovibrio, 0.673 with 95 percent confidence interval 0.083 to 0.917, P-value 0.039; Coprococcus, 0.143 with 95 percent confidence interval negative 0.338 to 0.770, P-value 0.223; Bacteroidota, negative 0.755 with 95 percent confidence interval negative 0.902 to 0.072, P-value 0.035; Firmicutes, negative 0.367 with 95 percent confidence interval negative 0.302 to 0.321, P-value 0.317.
At the genus level: Compared with CON group, UCD group showed a tendency to increase relative abundance of Streptococcus (P = 0.098, Fig. 3C), decreased the relative abundance of Prevotella (P < 0.05), and showed a tendency to decrease relative abundance of Prevotella_9 (P = 0.056). Compared with UCD group, LP-UCD group increased the relative abundances of Streptococcus and Coprococcus (P < 0.05, Fig. 3C), and showed tendencies to increase relative abundances of Lachnospiraceae_AC2044_group (P = 0.065) and Prevotella (P = 0.080). LP-UCD group decreased the relative abundances of Anaerovibrio and Phascolarctobacterium (P < 0.05, Fig. 3C), and showed tendencies to decrease the relative abundances of UCG-005 (P = 0.066), Oscillospira (P = 0.066), UCG-002 (P = 0.080), and Christensenellaceae_R-7_group (P = 0.091). The top 10 phyla in relative abundance at the phylum level and the top 30 genera in relative abundance at the genus level are presented in Supplementary Table S1.
Discussion
Maternal nutritional status during gestation, encompassing basal diet composition, nutritional additives, and organic substance intake, exerts long-term effects on offspring growth and development (Upadhaya et al. Reference Upadhaya, Chung and Jung2022). Research has found that nutritional interventions in sows during late gestation and lactation (such as the use of organic acid-preserved grains) not only exert a “nutritional programming” effect by improving the sows’ own nutrient digestibility and gut microbiota but also consistently enhance the feed utilization efficiency, nutrient digestibility, and long-term growth performance of their offspring after weaning (Maher et al. Reference Maher, Sweeney and Vigors2025a, Reference Maher, Sweeney and Vigors2025b). In the present study, replacing corn and soybean meal with alternative feed ingredients in the sow gestation diet had no significant effect on the growth performance of their offspring during the growing-finishing phase. This aligns with findings in other species, such as growing lambs, where soybean meal substitution with cottonseed meal, peanut meal, rapeseed meal, or distillers’ grains also yielded no significant impact on growth performance (Yin et al. Reference Yin, Chen and Yang2024). Consistently, a recent study on Langshan chickens also reported that substituting soybean meal with a solid-state fermented rapeseed meal-apple pomace-wheat bran mixture showed no significant effect on growth performance (Wang et al. Reference Wang, Xing and Zhang2024). Similarly, a diet incorporating equal proportions of rapeseed meal, cottonseed meal, and sunflower meal had no significant effect on finishing pig growth performance (He et al. Reference He, Liu and Wen2024). Notably, the unconventional low-protein diet significantly reduced the feed-to-gain ratio during the early growth stage and showed a tendency to increase weight gain, suggesting improved feed utilization efficiency after reducing the crude protein level and balancing amino acids. The intestinal development of piglets directly affects their subsequent growth performance, as a functionally intact intestine is the core site for the digestion and absorption of nutrients and an important barrier for maintaining body health (Tan et al. Reference Tan, Xiao and Wang2024). The superior early growth performance might be attributed to the optimized intestinal development of neonatal piglets resulting from the unconventional low-protein diet fed to sows during gestation (Li et al. Reference Li, Wei and Mao2026), although no significant effect was observed on overall growth performance.
Serum biochemical parameters serve as indicators of nutrient metabolism and the functional status of tissues and organs in animals, reflecting the health and physiological status of pigs (Lu et al. Reference Lu, Zhang and Lei2022). Among these, serum UREA nitrogen value is negatively correlated with protein utilization and growth performance traits, and its level directly reflects the body’s utilization of dietary protein (Marín-García et al. Reference Marín-García, Llobat and López-lujan2022). In this study, the unconventional diet group significantly reduced serum UREA content and showed a tendency to decrease HDL-C. One study found that complete replacement of soybean meal with miscellaneous meals reduced serum UREA levels in growing pigs (He et al. Reference He, Zhan and Cao2023). This might reflect improved protein utilization efficiency in the offspring due to the replacement of corn and soybean meal with unconventional feed ingredients in the sow gestation diet. Compared with the UCD group, the LP-UCD group significantly increased the serum levels of LDL-C, total cholesterol, TG, and HDL-C. Similarly, some studies have found that dietary protein restriction significantly increased plasma total lipids, total cholesterol, HDL-C, and LDL-C levels in finishing pigs. Notably, the magnitude of increases in serum ALP, total cholesterol, and TG in the LP-UCD group warrants attention. ALP is an important indicator of hepatobiliary system function, and its substantial elevation may reflect altered hepatobiliary function, cholestatic changes, or hepatocellular injury. However, because liver tissue was not collected for histopathological examination in this study, we cannot exclude the possibility of mild liver injury or cholestasis, which is a major limitation of the present study. It is speculated that this might be due to maternal protein restriction, changes in dietary fatty acid composition, or increased endogenous lipid synthesis from microbial metabolism, thereby affecting lipid absorption, synthesis, and transport pathways (Madeira et al. Reference Madeira, Rolo and Lopes2017).
Carcass traits are important indicators for measuring the fattening efficiency of pigs (Cheng et al. Reference Cheng, He and Zheng2024). Meat quality directly affects the edible and commercial value of pork. Nutrition during the gestation and lactation periods of sows has significant programming effects on the fat deposition and fatty acid composition of their offspring, directly influencing the meat quality of the offspring finishing pigs (Yan et al. Reference Yan, Guo and Yin2023). By regulating the nutrition during gestation and lactation (such as adding resveratrol, adjusting protein levels, or adding specific fat sources), the amount of fat deposition, the distribution of fat, and the types and proportions of fatty acids in the muscle of the offspring pigs can be purposefully influenced, ultimately achieving effective improvement of the meat quality of the offspring (Ci et al. Reference Ci, Sun and Huang2014; Meng et al. Reference Meng, Sun and Bai2020; Pan et al. Reference Pan, Jia and Yang2018; Rehfeldt et al. Reference Rehfeldt, Stabenow and Pfuhl2012). Maternal nutrition may exert programming effects on the regulation of offspring fatty acid composition. In this study, the unconventional diet and unconventional low-protein diet groups had no significant effects on the carcass and meat quality of the offspring, but the unconventional diet group showed tendencies for decreased dressing percentage and lean meat percentage compared to the control group. Results from Liu et al. indicated that replacing soybean meal with a mixture of meals had no significant negative effects on the growth performance and meat quality of finishing pigs (Liu et al. Reference Liu, He and Wen2025). Similarly, studies have shown that incorporating small amount of rapeseed meal into pig diets has no adverse effects on growth performance and meat quality (Do et al. Reference Do, Kim and Fang2017; Shi et al. Reference Shi, He and Wang2015). While rapeseed meal-based diets did not affect pork quality but might influence the average daily gain of pigs (Choi et al. Reference Choi, Jeong and Kim2015; Zmudzińska et al. Reference Zmudzińska, Bigorowski and Banaszak2020). Notably, a soybean-meal-free diet with a 2% crude protein reduction showed a tendency to decrease lean meat percentage in finishing pigs, though it did not have a significant impact on overall meat quality or carcass traits (Deng et al. Reference Deng, Wang and Jiang2025) – a pattern consistent with the trends observed in this study.
Lipid metabolism plays a pivotal role in pig growth, meat quality, and health, directly impacting production efficiency and economic outcomes (Xiong Reference Xiong2025). In this study, while the unconventional diet group did not induce significant differences in the expression of myofiber type-related genes in the longissimus dorsi muscle, it showed a trend toward downregulating PPARD, which is involved in fatty acid oxidation, increased glucose uptake and storage, and an increase in type I fibers (Hong et al. Reference Hong, Pan and Guo2019). This downregulation indicates a shift from slow-twitch to fast-twitch fibers and accelerated protein turnover, though the gene expression results did not reach statistical significance. Notably, compared with the UCD diet group, the LP-UCD diet group showed consistent upregulation trends in the expression of PPARD, SLC7A5, FABP3, and CD36. PPARD acts as a core regulatory factor dominating fatty acid oxidative metabolism. FABP3 is responsible for fatty acid uptake and intracellular transport (Cho et al. Reference Cho, Kim and Jeon2011), while upregulation of CD36 can enhance glycolysis and fatty acid oxidation while reducing hepatic lipid accumulation (Luo et al. Reference Luo, Zheng and Wei2021). L-type amino acid transporter 1 is the primary bidirectional transporter for large neutral amino acids, responsible for transporting leucine into muscle cells (Persaud et al. Reference Persaud, Cormerais and Pouyssegur2018). Despite elevated serum lipid levels in the LP-UCD group, intramuscular fat and carcass fat did not increase. This dissociation may reflect tissue-specific regulation of lipid metabolism: the upregulated expression of PPARD and CD36 in skeletal muscle suggests enhanced fatty acid oxidation, which may have counterbalanced lipid storage (Nahlé et al. Reference Nahlé, Hsieh and Pietka2008). The coordinated upregulation of these genes suggests that the LP-UCD diet may promote fatty acid oxidative as an energy supply pathway in skeletal muscle, potentially shifting energy metabolism towards the more efficient fatty acid oxidation pathway.
Alterations in maternal gut microbiota during gestation can affect offspring health (Fan et al. Reference Fan, Shen and Yang2025). Simultaneously, gut microbiota is closely related to other factors affecting meat quality, including fiber characteristics and lipid metabolism (Zhou et al. Reference Zhou, Ma and Kang2024; Zhu et al. Reference Zhu, Azad and Li2024). Numerous studies have confirmed the important role of gut bacteria in regulating lipid metabolism in pigs (Xie et al. Reference Xie, Zhu and Xu2022; Zhang et al. Reference Zhang, Yun and Lai2023). SCFAs are produced by the microbial fermentation of dietary fiber in the pig gastrointestinal tract and are also important metabolites for pigs to obtain energy from fibrous feed (Tiwari et al. Reference Tiwari, Mandal and Neupane2022). SCFAs can regulate fetal growth and development by influencing transport proteins and widely distributed signaling receptors (Qin et al. Reference Qin, Zhang and Chen2024). Firmicutes and Bacteroidota are the two dominant phyla in pigs (Chen et al. Reference Chen, Xu and Chen2017). Microbiota analysis in this study showed that the unconventional diet was associated with alterations in the colonic microbiota composition of the offspring. Compared with the control group, the unconventional diet group showed an increased abundance of Firmicutes and a decreased abundance of Bacteroidota, resulting in an elevated Firmicutes/Bacteroidota ratio (F/B ratio). Although an elevated F/B ratio has been associated with enhanced energy harvesting capacity in some studies (Yoshida et al. Reference Yoshida, Yamashita and Osone2021), the offspring in the present study did not exhibit corresponding increases in body weight, backfat thickness, or intramuscular fat. This discrepancy suggests that the F/B ratio shift may primarily reflect compositional changes in the microbial community rather than functional alterations in energy harvest. Among them, Bacteroidota includes genera that can promote fat decomposition and reduce obesity; an increase in this ratio might also be associated with the fat storage capacity of pigs (Yoshida et al. Reference Yoshida, Yamashita and Osone2021). However, it has also been reported that Firmicutes can promote a fat phenotype in broilers, mice, and humans (Kang et al. Reference Kang, Kang and Yang2022; Pinart et al. Reference Pinart, Dötsch and Schlicht2021; Zhang et al. Reference Zhang, Liu and Li2020). Propionate is mainly produced by Bacteroidota in the gut via the succinate pathway and is related to glucose metabolism (Döring and Basen Reference Döring and Basen2024). The decreased abundance of Bacteroidota corroborates the reduced propionate content in the unconventional diet group in this study. At the genus level, Prevotella and Prevotella_9 belong to the Bacteroidota phylum and were found to be decreased. Compared with the UCD group, the LP-UCD group significantly increased the relative abundances of Streptococcus and Coprococcus. Streptococcus includes Lactococcus lactis, a cultivable lactic acid bacterium considered beneficial for gut health under certain conditions (Long et al. Reference Long, Wu and Tan2022); however, this genus also contains potential pathogens such as Streptococcus suis. Since species-level identification was not performed in this study, the increase in Streptococcus abundance should be interpreted with caution. Coprococcus is considered a potential contributor to butyrate production (Singh et al. Reference Singh, Lee and Son2022). Although Coprococcus abundance was increased in the LP-UCD group, fecal butyrate content did not increase significantly. Butyrate may have been rapidly absorbed and metabolized by colonic epithelial cells, and thus fecal butyrate levels may not fully reflect actual production (den Besten et al. Reference den Besten, van Eunen and Groen2013). Additionally, butyrate production is influenced by substrate availability and microbial interactions. Previous studies have shown that Prevotella can improve PD-1/PD-L1 inhibitor-associated cardiotoxicity in colonic macrophages by producing butyrate (Chen et al. Reference Chen, Liu and Wang2022). Another study found that Prevotella has the potential as a dietary supplement to improve the selenium nutritional status and meat quality of finishing pigs (Liang et al. Reference Liang, Zeng and Hu2025). The significantly decreased relative abundances of Anaerovibrio and Phascolarctobacterium in the LP-UCD group may be associated with changes in the intestinal microenvironment; however, their functional roles in the pig gut remain poorly characterized, and the biological significance of their reduced abundance warrants further investigation.
It should be noted that all microbiota analyses in this study are based on 16S rRNA gene sequencing, which only reveals compositional associations at the genus level and cannot establish causal relationships between specific taxa and host phenotypes. Future studies employing fecal microbiota transplantation or gnotobiotic models are warranted to test causality and elucidate the underlying mechanisms.
Conclusions
This study demonstrates that substituting conventional corn and soybean meal with alternative ingredients such as wheat and broken rice in the diet of gestating sows does not compromise the final growth performance or meat quality of their offspring during the growing-finishing stage. However, it modifies the expression of genes associated with fat transport and amino acid absorption in muscle tissue, while reshaping the colonic microbial community by modulating the offspring’s serum protein and lipid metabolism. Notably, the unconventional low-protein diet further demonstrates the potential to improve feed utilization efficiency during the early growth stage of the offspring through the aforementioned mechanisms. These findings provide novel insights into how maternal nutritional programming influences the health and production efficiency of offspring pigs.
Supplementary material
The supplementary material for this article can be found at https://doi.org/10.1017/anr.2026.10067.
Author Contributions
Y.L.: Investigation, Data curation, Formal analysis, Writing – original draft, Visualization. W.W.: Investigation, Methodology. Xiangyu Mao: Investigation, Resources. W.L.: Investigation, Software. X.Z.: Investigation, Validation. X.J.: Methodology, Supervision. L.C.: Supervision, Validation. Yan Lin: Supervision, Resources. Y.Z.: Supervision, Methodology. G.L.: Methodology, Investigation. J.W.: Methodology, Investigation. D.W.: Conceptualization, Supervision. S.X.: Conceptualization, Funding acquisition, Project administration, Supervision, Writing – review and editing.
Financial Support
This study was funded by the Major Scientific and Technological Special Project of Sichuan Province (2021ZDZX0009), National key research and development program (2021YFD1300202), China Agriculture Research System (CARS-35), and Sichuan Innovation Team of China Agriculture System (SCCXTD-2024-8).
Conflicts of Interest
The authors declare no conflict of interest.



 Open access

