

Introduction
The local response to exercise and/or tissue injury involves the production of cytokines, which are released at the site of inflammationReference Pedersen, Ostrowski, Rohde and Bruunsgaard1. Very strenuous exercise can be accompanied by an increase in circulating pro-inflammatory cytokinesReference Pedersen, Ostrowski, Rohde and Bruunsgaard1. Tumour necrosis factor-α (TNF-α) and interferon-γ (IFN-γ) are major pro-inflammatory cytokinesReference Mosmann and Sad2, while interleukin-6 (IL-6) appears to be an inflammatory mediatorReference Pedersen, Ostrowski, Rohde and Bruunsgaard1. Cytokines promote the influx of lymphocytes, neutrophils, monocytes and other cells into the tissue in order to clear any antigens and help heal damaged tissueReference Pedersen, Ostrowski, Rohde and Bruunsgaard1. In particular, IFN-γ and TNF-α promote an inflammatory responseReference Mosmann and Sad2, and IL-6 functions as both a pro-inflammatory and an anti-inflammatory cytokineReference Moldoveanu, Shephard and Shek3, which may explain the conflicting reports about the exact function of IL-6 during exercise. While IL-6 does not directly induce inflammationReference Pedersen, Ostrowski, Rohde and Bruunsgaard1, it does affect hepatocytes, B cells and mononuclear phagocytes responsible for the production of TNF-αReference Moldoveanu, Shephard and Shek3. IL-6 also appears to have the ability to inhibit low-grade TNF-α productionReference Pedersen, Ostrowski, Rohde and Bruunsgaard1. Modulation of the TNF-α response to exercise is influenced by intensity and duration of the exercise stimulus, but exercise may have either a slight or no influence on circulating TNF-αReference Moldoveanu, Shephard and Shek3. It appears that the majority of research involving TNF-α has focused on the effects of long bouts of exercise (i.e. marathon, 2 h at 60% VO2max), and less attention has been paid to the expression of mRNA for TNF-α and production of TNF-α over short, intense bouts of exerciseReference Moldoveanu, Shephard and Shek3. While the effect of exercise on cytokine mRNA expression and cytokine production has been examined in humans, information is limited on comparable studies in horses.
Cranberries have long been touted for their ability to treat and prevent urinary tract infections, but lately they have been noted for their anti oxidant propertiesReference Youdim, McDonald, Kalt and Joseph4, Reference Sun, Chu, Wu and Liu5. Similarly, ginger is a spice that has been used not only as an anti oxidant, but also to ease the symptoms of arthritic painReference Srivastava and Mustafa6. Recent studies have demonstrated that supplementing the diet with anti oxidants is effective in reducing the secretion of inflammatory cytokines in exercising human malesReference Vassilakopoulos, Karatza, Katsaounou, Kollintza, Zakynthinos and Roussos7. In an effort to reduce and prevent cellular damage, as well as to increase creatine kinase (CK) and aspartate aminotransferase (AST), anti oxidants are often employed to protect the integrity of cell membranes. Consequently, the anti oxidant properties of cranberry and ginger may help prevent such damage, thus attenuating the degree of muscle cell damage and permeability. The anti-inflammatory properties of both cranberry and ginger extracts have been investigated for use in humans suffering with pain from inflammationReference Surh8 and arthritisReference Srivastava and Mustafa6, Reference Altman and Marcussen9, but there appear to be no published studies taking place during the course of exercise and recovery, particularly in horses.
Equine athletes are often treated with non-steroidal anti-inflammatory drugs (NSAIDs) to reduce inflammation and post-exertion soreness. Prolonged use of NSAIDs can cause undesirable side effects, such as gastric ulcersReference MacAllister, Morgan, Borne and Pollet10. A natural alternative to NSAIDs may help to avoid such problems. Both cranberry (Vaccinium macrocarpon) and ginger (Zingiber officinale) extracts screened in cell culture and rodent ear inflammation models have shown anti-inflammatory efficacyReference Franke and Rosen11. Scientific evidence is lacking with regard to the efficacy of natural supplements used to improve health. Nutraceuticals claiming to relieve pain and inflammation are of particular importance, because if an ingredient is proved to work, it has the potential to reduce the amount of pharmaceutical products ingested in humans, horses and other athletic species. Therefore, this study had a twofold purpose. First, we wished to determine whether cranberry and ginger extracts were safe to administer to horses at the calculated dose. Secondly, the study was designed to measure markers of muscle damage (CK and AST) and other indices of performance (thermoregulation, and core and rectal temperatures), as well as the expression of mRNA of the cytokines TNF-α, IFN-γ and IL-6 in plasma of exercising horses. Cranberry and ginger extracts have been classified as generally regarded as safe products, and thus they posed no risk to the horses' well-being; however, since there have been no reported studies of their administration to horses, the first objective of the study was to verify whether there were overt negative side effects of administration. The second and primary objective of the study was to test the hypothesis that the extracts would alter cytokine markers of inflammation, and direct physiological responses to exercise and recovery, as well as indirect physiological factors with the potential to impact performance and recovery, during and after a short, exhaustive bout of exercise.
Materials and methods
Animals and dosing
The Rutgers University Institutional Animal Care Review Board approved all methods and procedures used in this experiment. Nine healthy, unfit Standardbred mares (aged 10 ± 4 years, ~450 kg) were tested using a crossover design, where they were assigned to the initial order of treatment in a randomized fashion. The mares were accustomed to the laboratory and running on the treadmill before the start of the experiment.
Horses were initially assigned to receive one of three extracts (water, cranberry or ginger). Three horses ran each day, Monday–Wednesday, between 09.00 and 12.00 hours. There was 1 week between the trials. Each horse received the extract or water via nasogastric tube, approximately 1 h prior to testing. Since extracts were stored in the refrigerator, they were placed in a warm water bath for 10–20 min prior to administration to avoid gastrointestinal (GI) upset. When water was given, lukewarm tap water was used.
During the study, the horses were housed as a group on an exercise lot. Each mare was fed approximately 2.5 kg of total mixed ration hay cubes (Eckenberg Farms™, Mattawa, WA, USA) twice a day (~5 kg/day total) at about 07.00 and 15.00 hours. Water and grass hay were provided ad libitum. The ration was formulated to meet the energy guidelines of the National Research Council (1989) for adult horses conducting periodic exercise. Mares were not fed on the morning of the exercise test.
A pilot study was performed to determine whether the ginger and cranberry extracts were safe to administer to horses and to collect plasma samples to determine whether the flavonols and gingerols of interest would be taken up into the plasma. To accomplish this, a dose of approximately 30 g of each extract in 2 l of water was given via nasogastric tube to two healthy, Standardbred mares. The dose was extrapolated from the mg kg− 1 dose used in rodent and human studies performed at the Rutgers University Nutraceutical Institute. During the pilot trial, the mares were placed in stalls, and offered their normal rations (discussed below) over the 36-h study. Grass hay and water were provided ad libitum. Heart rate (HR), rectal temperature, respiration, capillary refill time, hydration status and GI function were assessed at the following time points: 0 (pre-dosing), 30 min, 1, 2, 4, 6, 8, 10, 12, 16, 20, 24 and 36 h post-dosing.
Extract preparation
To prepare the extracts, 30 g of cranberry (90 MX cranberry powder; Ocean Spray, Inc., East Wareham, MA, USA) or ginger extract (Sabinsa Corporation, Piscataway, NJ, USA) were dissolved in 100 ml of ethanol, and 10 g of lecithin were added. The mixture was brought to a boil, and was then slowly added to warm (48.9°C) water under high shear conditions. This pre-emulsion was then dispersed in 1500 ml of warm water, also under high shear conditions, to yield 30 g of extract in 2 l of waterReference Vvedenskaya, Rosen, Guido, Russell, Mills and Vorsa12.
High-performance liquid chromatography (HPLC) analysis of 90 MX cranberry extract
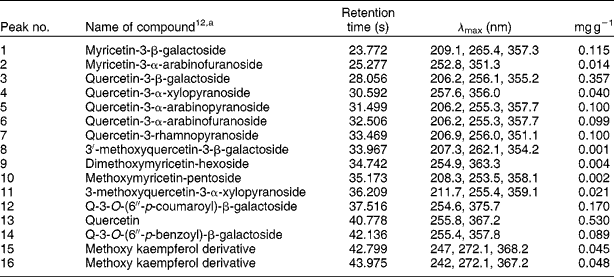
Analytical detection and quantification of proanthocyanidins and flavonol glycosides were completed with HPLC (Waters, Milford, MA, USA) using a C18 Luna column (4.6 × 150 mm; 5 μm; Phenomenex, Torrance, CA, USA) (Table 1). Eighty per cent acetone extract of 90 MX cranberry powders (40 μl) was injected into the column, and a gradient elution was used for fractional separation with two solvents at a flow rate of 1 ml min− 1. Solvent A consisted of 10% MeOH in H2O adjusted to pH 3.5 with formic acid. Solvent B consisted of 20% H2O (pH 3.5), 20% MeOH and 60% acetonitrile. The gradient consisted of 0 min – 100% A, followed by 5 min – 85% A, 10 min – 80% A, 20 min – 75% A, 25 min – 73% A, 27 min – 60% A, 60% A – 30 min, 35 min – 50% A, 40 min – 10% A, 45 min 0% A, 50 min – 100% A, and was held at 100% A for a final 55 min. Equilibration at 100% A was performed before and after each injection for 5 min. Flavonol glycosides and proanthocyanidins were identified and quantified using in-house standards and published methodsReference Wilson, Singh, Vorsa, Goettl, Kittleson and Roe13. Scanning by the photodiode array detector (PDA) occurred was done at 280 nm for proanthocyanidins and at 366 nm for flavonol glycosides, while data acquisition and processing were performed using Waters Empower™ Chromatography Software.
HPLC finger print of the flavonols present in 90 MX cranberry juice

a Structure based on LC–MS data.
Cranberry bioavailabilty pilot study
The cranberry bioavailability study was conducted using plasma samples collected from one horse during the above-mentioned safety study. Plasma and urine samples were collected before administration and at 0.5, 1, 2, 4, 6, 8 and 12 h post-administration. These samples were analysed for cranberry flavonols using HPLC and previously published methodsReference Gregoire, Singh, Vorsa and Koo14. Plasma samples (1 ml) were mixed with 300 μl of 20% acetic acid and 3 ml of acetonitrile and vortexed for 5 min. The acidified samples were vortexed and centrifuged three times for 10 min at 10 000 × g (4°C). After each centrifugation, the supernatant was collected, pooled and concentrated to dryness under a gentle stream of nitrogen gas at ambient room temperature. Dried plasma extract was redissolved in 100 μl of MeOH for HPLC and liquid chromatography (LC)–mass spectrometry (MS) analyses. For urine, a 10-ml aliquot was measured into an Eppendorf tube, followed by the addition of 30 ml of ethyl acetate and 1 ml of acetic acid-extracting solvent. The mixture was vortex-mixed for 2 min using a vortex mixer and was then centrifuged at 10 000 × g for 10 min. The organic layer was transferred into a flask and concentrated to 1 ml using a rotavapour under reduced temperature and pressure. One millilitre of urine extract was further transferred to a new tube and blow-dried under a gentle stream of nitrogen gas at ambient room temperature (~25°C). Dried urine extract was redissolved in 100 μl of MeOH for HPLC and LC–MS analyses.
The HPLC analysis used a Dionex HPLC analyzer that consisted of G-40 gradient pump, PDA detector 100, AS 50 Auto sampler, AS50 Thermal compartment and an ED40 electrochemical detector. Separation of flavonoids and its metabolites was performed on a Luna C8 column (250 × 4.6 mm, 5 μm; Phenomenex) using a linear gradient 0–100% B for 40 min. The solvent system consisted of solvent A – 100 mM ammonium acetate buffer (pH 3.5 with formic acid)–MeOH (90:10 v/v), and solvent B – 100 mM ammonium acetate buffer (pH 3.5 with formic acid)–MeOH–acetonitrile (20:20:60 v/v/v). Flow rate was 1 ml min− 1; 40 μl were used for injection; and detection was done at 366 nm for flavonols and at 280 nm for proanthocyanidins.
For the MS analysis, the samples were injected into an LC–MS system, consisting of a Waters 717plus autosampler, Waters 616 pump together with Waters 600S pump controller, an in-line degasser, Waters 996 PDA, Waters Thermabeam electron impact (EI, 70 eV) single quadrupole mass detector and a Varian 1200L triple quadrupole mass detector with electrospray ionization interface (ESI) operated in a negative ionization mode. Data from the detectors (except the Varian 1200L mass detector) were collected and compiled using Waters Millennium 32 software package, complemented by the Wiley library of EI mass spectral data, 6th edition. Data from the Varian 1200L mass detector were collected and compiled using Varian's MS Workstation, version 6.3, SP1. The electrospray voltage was − 4 kV; heated capillary temperature was 240°C; sheath gas, air, was used; and mass detector scanning was done from 110 to 1400 amu. The LC separation of compounds in the sample was achieved using a reverse phase column, Phenomenex C8, 5 μm particle size, 100 Å pore size, 250 × 4.6 mm, and a gradient of acetonitrile (solvent D) with 0.5% acetic acid in double-distilled water (solvent A). Flow rate was 0.5 ml min− 1.
Standards and reagents utilized in the analysis included quercetin, quercetin-3-rhamnoside (Q-3-rhamnoside; Indofine Chemical Co. Inc., Hillsborough, NJ, USA), myricetin-3-galactoside (M-3-galactoside), quercetin-3-galactoside (Q-3-galactoside) standard that was isolated and characterized using LC–MS and NMR spectroscopyReference Gregoire, Singh, Vorsa and Koo14, and Q-3-glucuronide that was synthesized and characterized using LC–MS and NMR spectroscopy. HPLC- grade MeOH, acetone, ethyl acetate, acetonitrile, formic acid and water were obtained from Fisher Scientific (Pittsburgh, PA, USA).
Ginger extract bioavailabilty pilot study
This pilot experiment was conducted using plasma samples from the second horse used during the above-mentioned safety study. In short, the crude ginger extract was fed via nasogastric tube, and blood samples were collected before administration (0 h) and at 0.5, 1, 2, 4, 6, 8, 10, 12, 16, 20, 24 and 36 h post-dosing. Plasma samples were stored at − 80°C, and were later extracted to concentrate and measure ginger metabolites using HPLC. The extraction for ginger metabolites was done by deproteinizing 300 μl of plasma with 4 ml of ice-cold MeOH and by centrifuging at 10 730 rpm for 10 min at 4°C. The supernatant containing the ginger metabolites was collected and evaporated to dryness under nitrogen. This was dissolved in 1 ml of chloroform,and washed with 3 ml of water followed by 5 ml of chloroform. The chloroform fraction was collected and dried with nitrogen. This was dissolved in 200 μl of MeOH, filtered through 45-μm nylon filters and used for HPLC analysis. A pure 6-gingerol sample was also run for comparison. HPLC analysis was conducted using Shimadzu LC 10 AS connected to a Varian UV detector. The HPLC conditions used were as follows: column: Supelco discovery, C-18; sample injection: 20 μl; mobile phase: 55% water and 45% acetonitrile, isocratic condition; and detection: UV 280 nm. Each sample was analysed in triplicate.
Graded exercise test (GXT)
The GXT used previously published methods to measure maximal oxygen uptake (VO2max) and indices of exercise performanceReference Kearns and McKeever15–Reference McKeever, Agans, Geiser, Lorimer and Maylin17. Before the test, the horses were weighed and catheterized with two catheters (Angiocath, 14 gauge; Becton Dickinson, Inc., Parsippany, NJ, USA) on the left side and with one catheter introducer (6 French; Argon Medical, Athens, TX, USA) on the right side. Catheters were inserted percutaneously into the jugular veins using sterile techniques and local lidocaine anaesthesia. The horses were then walked onto the treadmill, where a dual-port micromanometer pressure-sensing catheter (Millar Instruments, Houston, TX, USA and Electrocatheter, Rahway, NJ, USA) was inserted and positioned for the measurement of pulmonary artery pressure (PAP), right ventricular pressure (RVP) and HR. Verification of the position of the ports on the pressure-sensing catheter was performed before and after exercise by using the representative blood pressure waveforms recorded on the physiological recording system (Biopac, Santa Barbara, CA, USA). To record the core (right atrial) temperature, a thermistor probe (Model # BAT-10 Thermometer; Physitemp Instruments, Clifton, NJ, USA) was inserted through the lower catheter on the left side, and sealed with silicone. Rectal temperature was taken before and at 2 and 5 min post-GXT, with the probe (Precision 4000A Thermometer; YSI, Inc., Yellow Springs, OH, USA) inserted approximately 15–30 cm.
During the incremental exercise tests, the mares ran on a high-speed horse treadmill (Sato I; Equine Dynamics, Inc., Lexington, KY, USA) at a fixed 6% grade. Horses wore the indirect open-flow calorimeter apparatus (Oxymax-XL; Columbus Instruments, Inc., Columbus, OH, USA) used to measure oxygen uptake. The GXTs started at an initial speed of 4 m s− 1 for 1 min. Speed was then increased to 6 m s− 1, followed by incremental increases of 1 m s− 1 every 60 s (omitting 5 m s− 1) until the horses reached fatigue. Fatigue was defined as the point where the horses could not keep up with the treadmill despite humane encouragement. At the point of fatigue, the treadmill was stopped, and post-exercise calorimetry and haemodynamic data were collected for 5 min. Oxygen uptake was measured continuously during the test and was recorded at 10-s intervals using the open-flow calorimetry system. Recovery time was defined as the time for VO2 to recover from the peak observed at fatigue to a post-exercise plateau. Core body temperature was measured during the last 10 s of each increment during the test using the thermistor probe. Analogue haemodynamic data were recorded continuously and digitized for later analysis (Biopac Physiological Recording System). Rectal temperature and body weight were obtained again immediately upon completion of the test.
Blood chemistry
Blood samples (20 ml) were obtained during the tests at rest, during the last 10 s of each increment of the test, immediately at the end of the test, and at 2, 5 and 30 min, 1, 2, 4 and 24 h post-GXT to measure haematocrit (HCT) and total protein (TP) and blood lactate concentrations. Blood samples were placed into pre-chilled tubes containing sodium heparin (Vacutainer; Becton Dickinson, Inc., Franklin Lakes, NJ, USA), and were immediately placed on ice. Blood lactate concentrations were measured in duplicate using a lactate analyser (Sport 1500, YSI, Inc.). HCT and plasma protein were measured in duplicate using the microhaematocrit technique and refractometry. Another set of blood samples (20 ml) were collected at rest, and at 2, 4 and 24 h post-GXT, and placed in pre-chilled tubes containing EDTA (Vacutainer; Becton Dickinson, Inc., Franklin Lakes, NJ, USA) for the measurement of plasma CK and AST concentrations at a veterinary reference laboratory (IDEXX, Little Falls, NJ, USA), using an enzymatic reaction assay (BMD Roche/Hitachi 747-100; High Technology, Inc., Walpole, MA, USA).
Haemodynamics
PAP and RVP were measured continuously in real time using a micromanometer catheter transducer (Millar Instruments). The transducer was calibrated at the level of the heart before and after each horse performed a GXT against a mercury manometer. Position was verified before and after the GXT using representative waveforms. All data were recorded on a physiological recording system (MP 100; Biopac Systems, Inc., Goleta, CA, USA) and stored on the computer. Analogue pressure data were also measured and digitized on the computer (Acknowledge; Biopac Systems, Inc.). HR was calculated by counting the number of pressure waves in the final 10 s of each stage of the exercise test.
Real-time polymerase chain reaction (RT-PCR)
The blood samples were collected via venepuncture into PAXgene™ Blood RNA Tubes (Qiagen, Inc., Santa Clarita, CA, USA) before exercise, immediately at the end of the test, and at 30 min, 1, 2, 4 and 24 h post-GXT. Total RNA was subsequently isolated from the tubes using spin columns according to the manufacturer's instructions. The RNA was quantified using a spectrophotometer (BioPhotometer; Eppendorf, Hamburg, Germany). In all cases, OD260/280 ratios were >1.9, and RNA yields were >50 μg ml− 1. One microgram of RNA was reverse-transcribed into cDNA in an 80-μl reaction mixture containing 20 units of AMV reverse transcriptase, 0.5 μg of oligo dT primers, 40 units of RNAsin and 5 mM MgCl2 (Promega, Madison, WI, USA). Cytokine-specific cDNA was then amplified and quantitated by ‘real-time’ PCR (ABI Systems 7500 Sequence Detection System, Foster City, CA, USA) using the Taq thermostable DNA polymerase and primers based on the sequences for equine cytokines and β-glucuronidase (β-gus). Specific primers and FAM (6-carboxy-fluorescein)-labelled probes for each cytokine and β-gus, provided as Assay-by-Design kits (ABI), were added to 25-μl reaction mixtures in 96-well microplates containing the Taq polymerase (12.5 μl of Universal Master Mix; ABI) and 5 μl of cDNA. The following PCR conditions were employed: 95°C for 10 min followed by 40 cycles of 95°C for 15 s and 60°C for 60 s, as recommended by the manufacturer.
Differences in RNA isolation and cDNA construction between samples were corrected using β-gus as an internal control for each sampleReference Breathnach, Sturgill-Wright, Stiltner, Adams, Lunn and Horohov18. Relative differences in cytokine mRNA expression resulting from exercise were determined by relative quantification. Relative quantification provides accurate comparison between the initial levels of target cDNA in a sample without requiring that the exact copy number be determinedReference Livak and Schmittgen19. The pre-exercise samples were selected as the calibrator, and the change in cytokine gene expression post expression relative to the calibrator was then determined for each sample.
Statistical analysis
Results are expressed as means ± standard error of the mean. For comparison by group and time, a two-way ANOVA for repeated measures was used with the a priori level of statistical significance set at P < 0.05. Post hoc comparisons were made using t-tests for paired comparisons and Student–Newman–Keuls tests (Sigma Stat 2.0; SPSS, Inc., Chicago, IL, USA).
Results
Safety study
No significant change (P>0.05) was noted in any of the parameters (HR, rectal temperature, respiration, capillary refill time, hydration status and GI function) measured over 36 h (data not shown).
Cranberry extract analysis and bioavailability
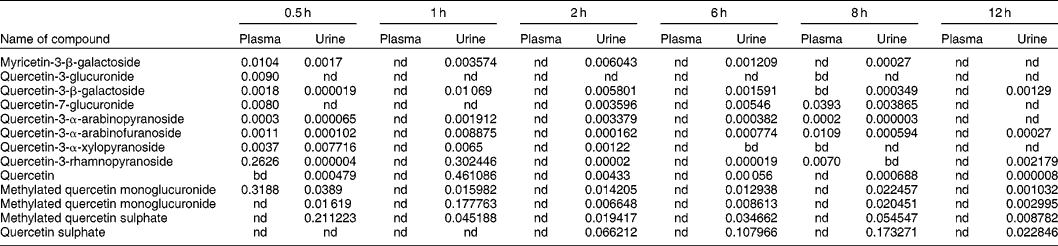
Details of the flavonols contained in the cranberry powder are given in Table 1. The major flavonol components were Q-3-galactoside, M-3-galactoside, Q-3-rhamnoside and quercetin. Major proanthocyanidin components were monomers (0.000823 mg g− 1), dimers (0.0846 mg g− 1), trimers (0.0334 mg g− 1) and polymeric proanthocyanidins over degree-of-polymerization DP (0.1188 mg g− 1). As with previous published reports, several anthocyanins were also identifiedReference Wilson, Singh, Vorsa, Goettl, Kittleson and Roe13. This is the first report to identify these flavonols and metabolites in plasma and urine of horses. The key observation was that there was a rapid uptake of the cranberry extract, with metabolites appearing in the blood within 15 min post-administration and excretion in the urine occurring at 12 h (Table 2).
Quantity of individual metabolites in horse plasma and urine after oral ingestion of 80% acetone extract of 90 MX cranberry powders

Metabolites and parent compounds identified using HPLC–MS and quantified by HPLC at 366 nm. Quantity is expressed in μg ml− 1 of plasma and urine.nd, Not detected; bd, below detection level.
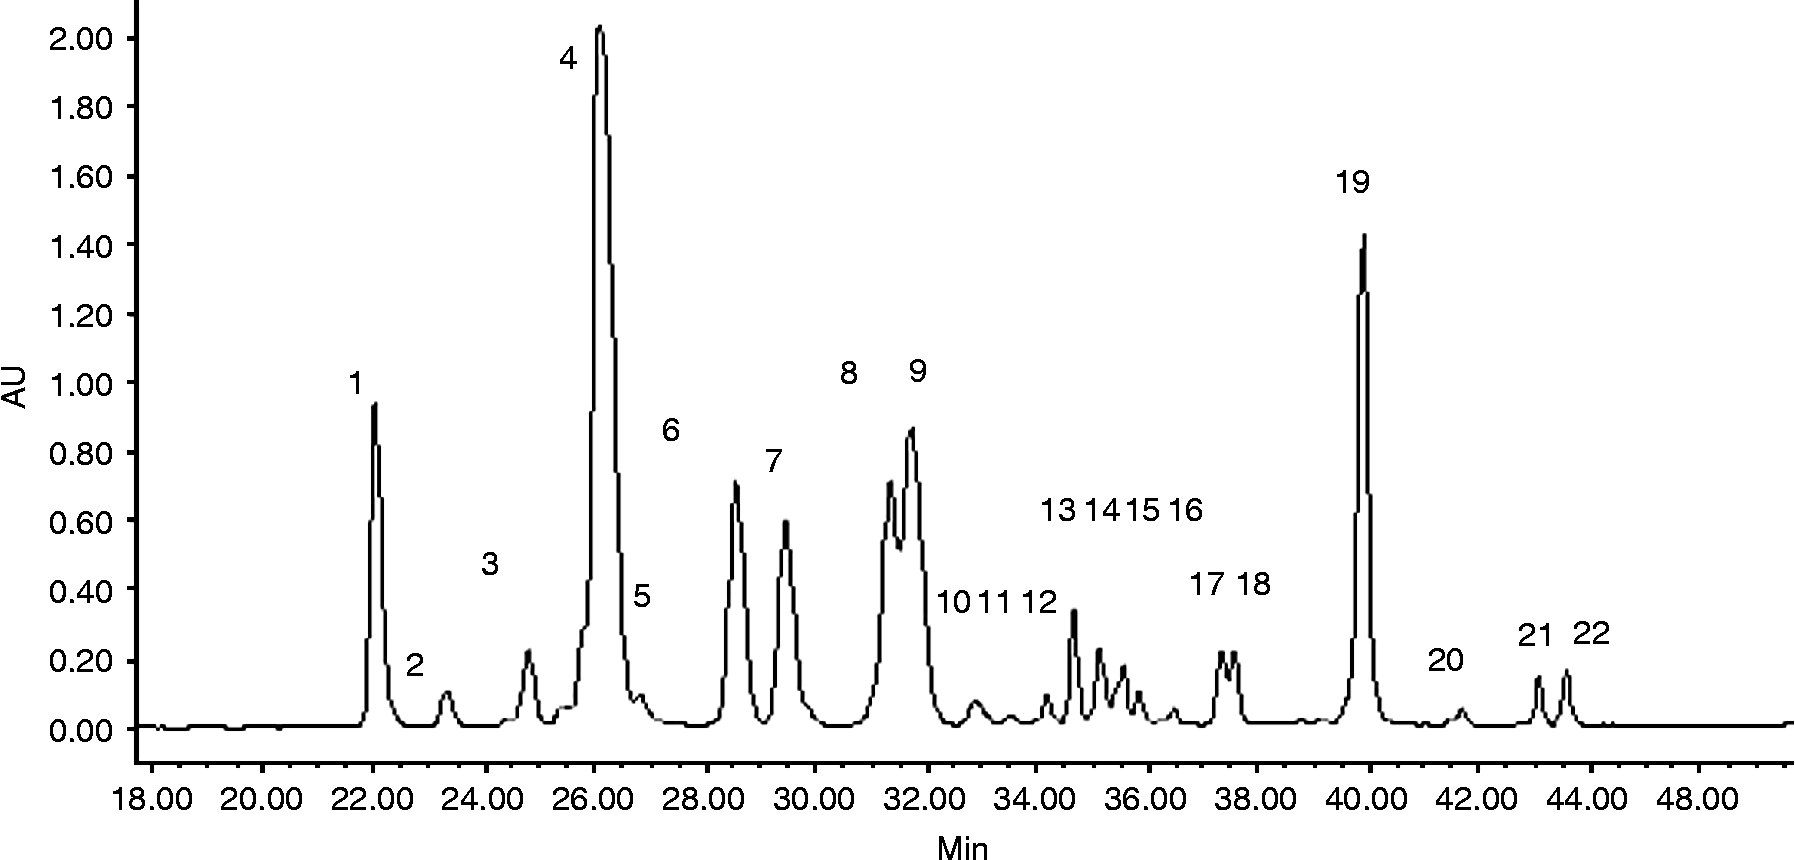
Plasma and urine collected at different intervals after ingestion of the cranberry extract were analysed by HPLC–PDA and LC–MS. No peaks were found in pre-dose samples of either urine or plasma. In urine, a variety of anthocyanins appeared based on UV spectra, but contents were extremely low for quantification. No proanthocyanidins were detected in plasma and urine. Compared with the bioavailability of anthocyanins and proanthocyanidins, substantial amounts of flavonols were present in plasma and urine, with a total of 12 quercetin- and one myricetin-based compounds being detected (Table 2). The mass spectra of selected flavonols and their metabolites were identified based on mass spectra that are illustrated in Fig. 1. HPLC–ESI–MS identified a total of seven previously known flavonols in plasma and urine extracts (Table 2). Only brief descriptions of the structural elucidations are provided, since all the flavonols identified and quantified from cranberry extract have been characterized in previous studies (Table 1)Reference Vvedenskaya, Rosen, Guido, Russell, Mills and Vorsa12, Reference Wilson, Singh, Vorsa, Goettl, Kittleson and Roe13. Q-3-galactoside, quercetin-3-pyranoside, quercetin-3-furanoside, quercetin-3-xylopyranoside and Q-3-rhamnoside were all characterized by loss of the corresponding sugar moiety, as indicated by a difference of m/z 162, 132 and m/z 146, respectively, which resulted in the aglycone quercetin at m/z 301 (Fig. 1). In contrast, M-3-galactoside was identified based on an intense [M − H]− ion peak at m/z 479 and a fragment ion at m/z 317 and in-house standard. Two of the 13 compounds that were identified in plasma and urine were quercetin-3-glucuronide and quercetin-7-glucuronide, with their detections occurring between 14 and 15 min (chromatogram not shown). The same [M − H]− ion and fragmentation pattern (m/z 477, 301) was exhibited by both monoglucuronides, but differences in retention times and comparisons with authentic standards and/or published data revealed the presence of the glucuronic acid at 3 and 7 positions of quercetinReference Vorsa, Singh, Shabrova, Schaich, Jin and Quadro20. Two methylated quercetin monoglucuronides, one methylated quercetin sulphate, one quercetin sulphate and quercetin were also identified by HPLC–ESI–MS from plasma and urine, with their detections occurring after 21–28 min (chromatogram not shown). Identifications of all the metabolites were based on the comparison of ESI–MS fragmentation patterns and retention times with in-house standards, and were also based on the interpretation of ESI–MS fragmentation and comparison with published dataReference Day, Mellon, Barron, Sarrazin, Morgan and Williamson21, Reference Giusti, Rodríguez-Saona, Griffin and Wrolstad22.
HPLC chromatogram of flavonol glycoside present in 90 MX cranberry powder

Ginger extract analysis and bioavailability
The HPLC chromatogram for the pre-administration had no ginger metabolites. Therefore, samples collected at 0 h were used as a negative reference. HPLC chromatograms were analysed for samples collected at 0 h and for the 0.5, 1, 2 and 4 h time points after ginger administration. The sample for 30 min post-ginger administration did not contain detectable ginger metabolites. However, for the plasma samples collected at 1 and 2 h post-ginger administration, quantifiable peaks representing ginger additional metabolites appeared at around 22 min, disappearing after 3 h of the HPLC analysis. The peak plasma concentration of 6-gingerol was 6.7 μg ml− 1. This peak occurred at 30 min with a steady but rapid decline suggestive of a very short plasma half-life. Plasma 6-gingerol appeared to be rapidly eliminated from the body, and concentrations returned to baseline10 h post-administration.
Graded exercise test
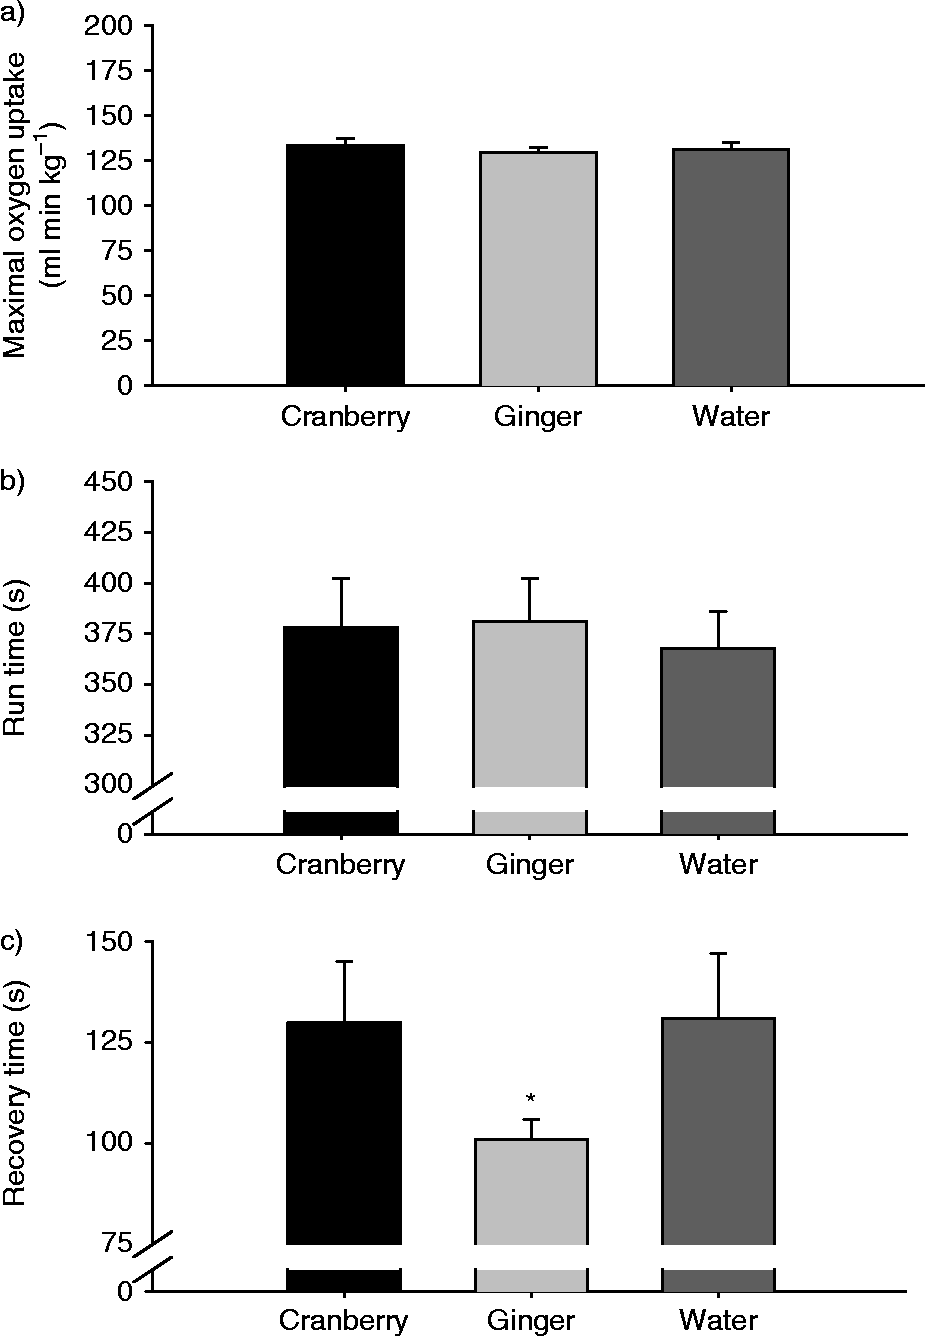
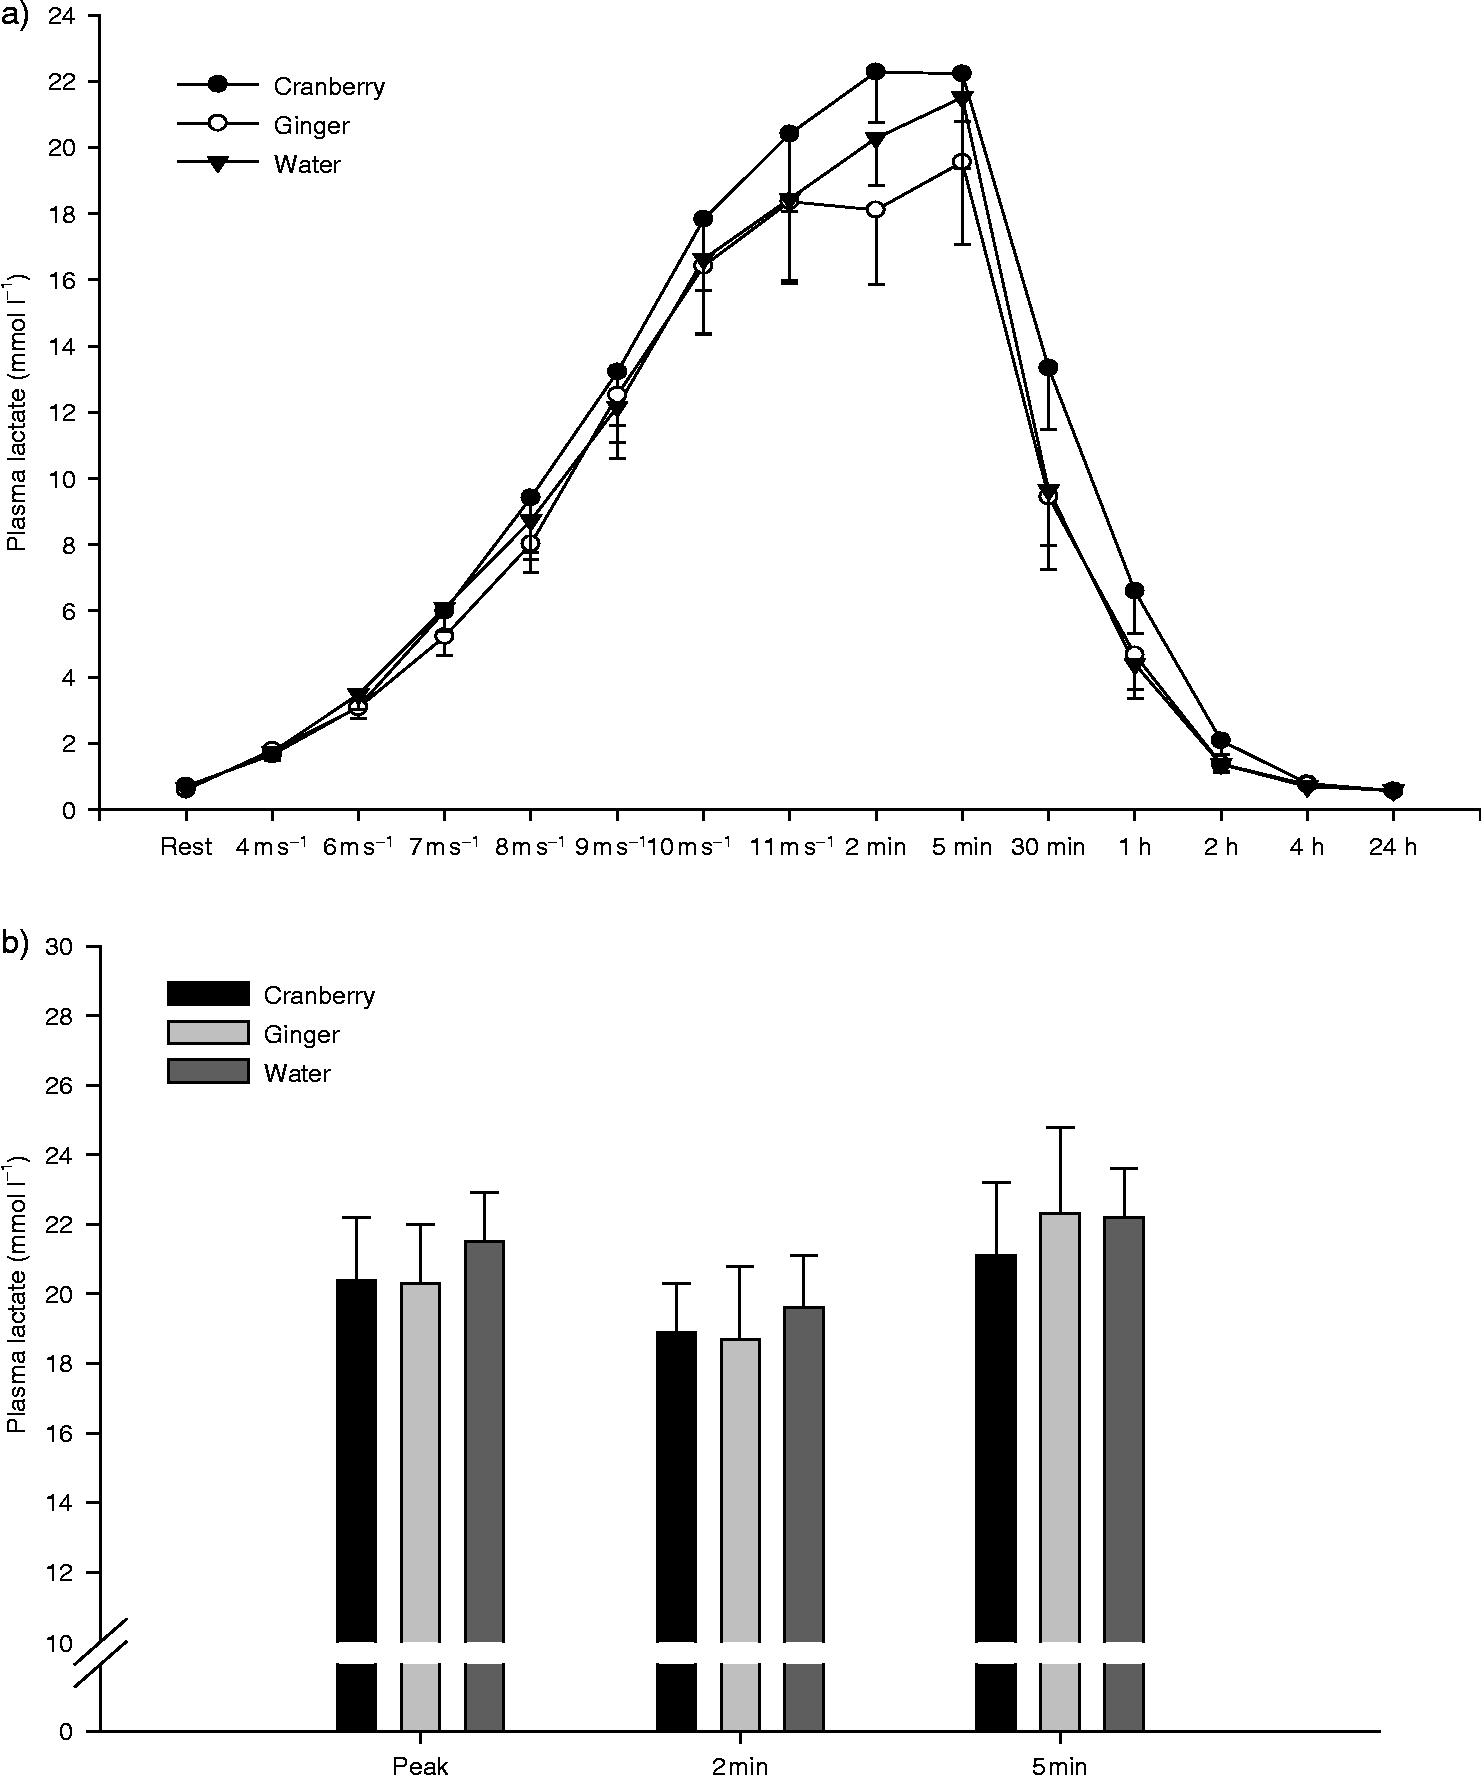
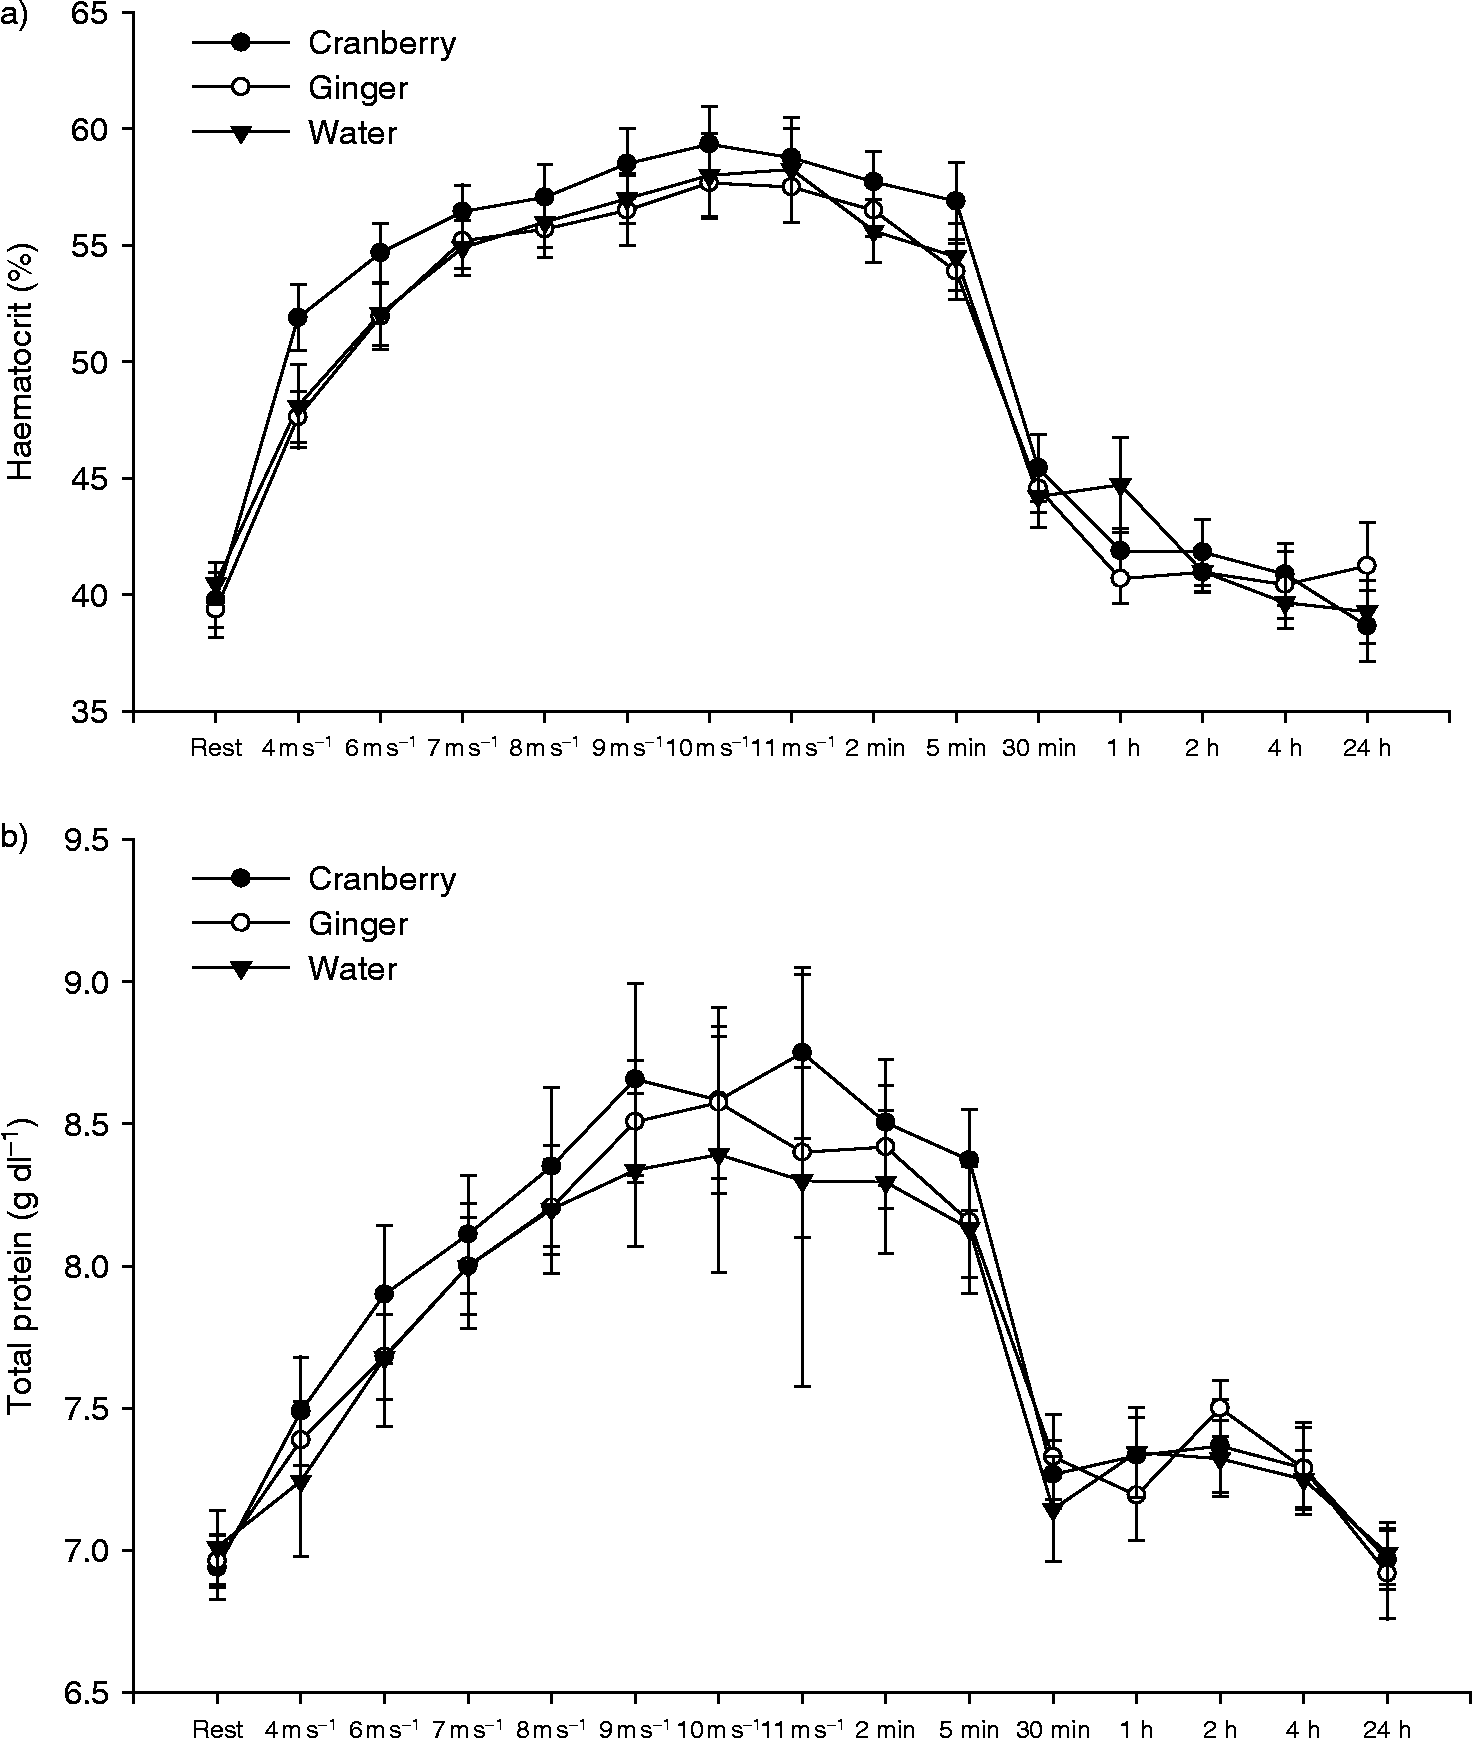
There was no effect of treatment (P>0.05) on VO2max (133 ± 4 ml kg− 1 min− 1, 130 ± 3 ml kg− 1 min− 1 and 133 ± 3 ml kg− 1 min− 1 in the water, ginger and cranberry groups, respectively) or run-time to fatigue (378 ± 24, 381 ± 21 and 368 ± 18 s in the water, ginger and cranberry groups, respectively; Fig. 2a and 2b). VO2 recovery time was significantly less in the ginger group (101 ± 3 s) than in the water (130 ± 14 s) or cranberry (131 ± 16 s) group (Fig. 2c). No treatment effects (P>0.05) were seen on peak plasma lactate concentration (Fig. 2), HCT or TP (Figs 3 and 4), core temperature, rectal temperature, HR or blood pressure (data not shown).
Graphs present mean ± SE values for maximal oxygen consumption (a), run-time (b) and VO2 recovery time (c) measured during the GXTs performed following administration of either water, cranberry extract or ginger extract. An asterisk (*) denotes a significant (P < 0.05) difference between groups

Graphs present mean ± SE plasma lactate concentration (a) measured during the GXTs and plasma lactate concentrations (b) measured at the peak of exercise and at 2 and 5 min post-exercise following administration of either water, cranberry extract or ginger extract. Exercise produced significant increases (P < 0.05) versus resting mean by 4 m s− 1 in all groups. Lactate concentration returned to pre-GXT concentrations (P>0.05) by 4 h of recovery in all three groups

Graphs present mean ± SE HCT (a) and total plasma protein concentration (b) measured during the GXTs following administration of either water, cranberry extract or ginger extract. Exercise produced significant increases (P < 0.05) versus resting mean by 4 m s− 1 in all groups

Markers of cell damage and inflammation
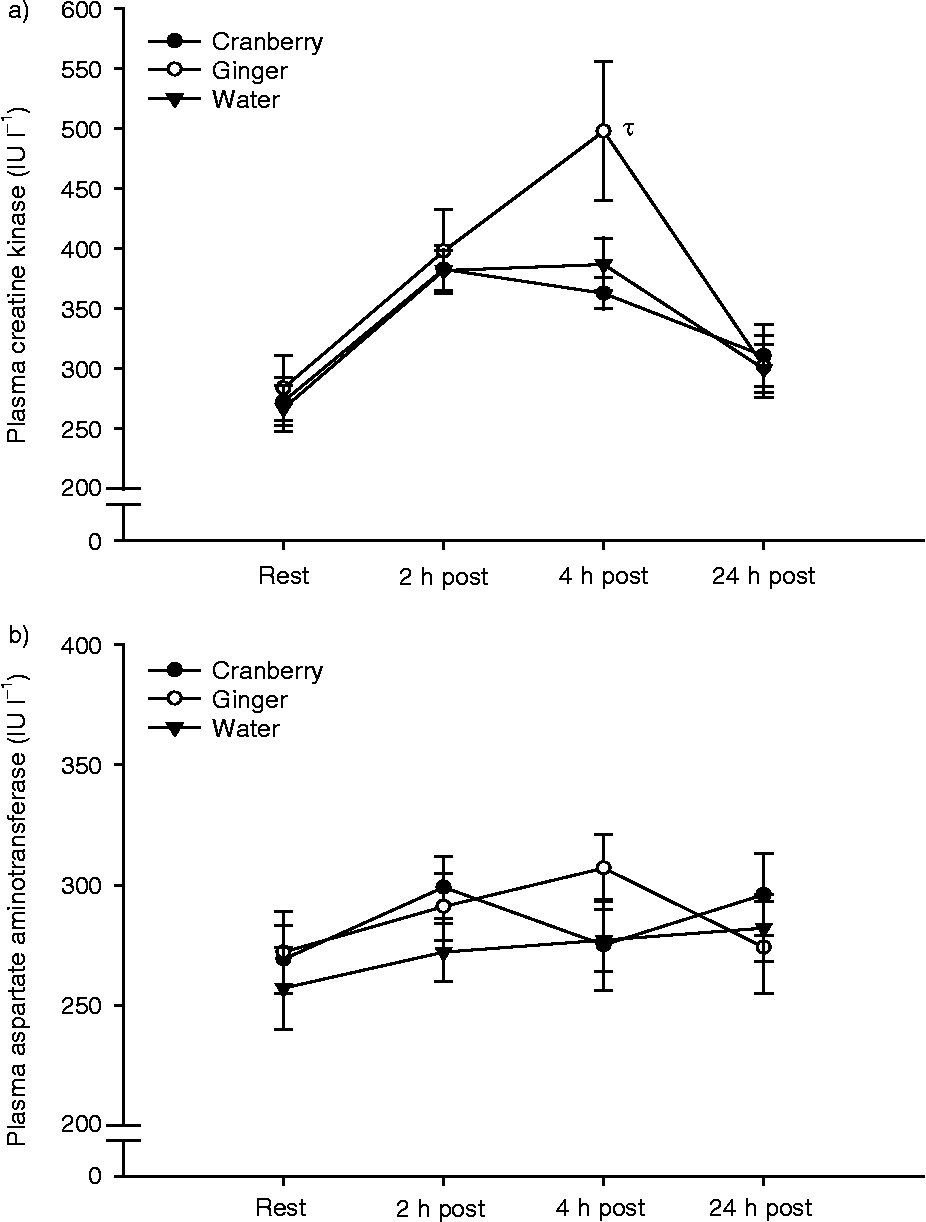
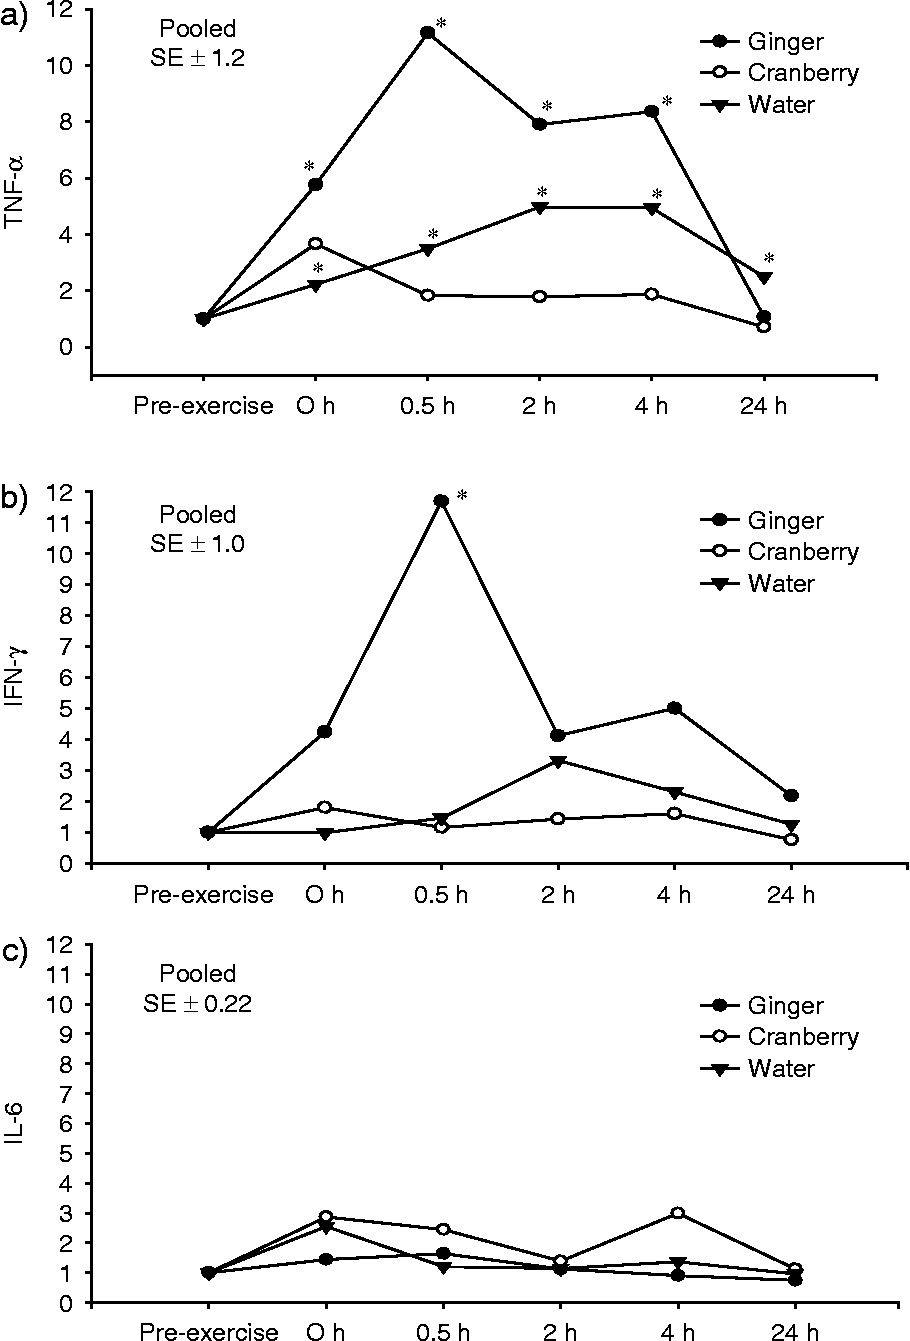
There were significant differences (P < 0.05) due to exercise in plasma CK concentration at 2 and 4 h post-GXT compared with baseline. Plasma CK concentrations were greater (P < 0.05) in the ginger group than in the cranberry and water groups, at 4 h post-GXT (Fig. 5a). Plasma CK concentrations returned to baseline within 24 h in all groups. Plasma AST concentrations were not affected (P>0.05) by either exercise or treatment (Fig. 5b). There was a significant effect of treatment on TNF-α and IFN-γ mRNA expression (Fig. 6a and 6b). TNF-α mRNA was elevated (P < 0.05) in the ginger group from 30 min to 4 h post GXT compared with baseline, but returned to baseline (P>0.05) within 24 h. In the water (control) group, there was a significant increase from baseline in TNF-α mRNA by 30 min post-GXT, which remained elevated 24 h later. Expression of TNF-α mRNA did not change (P>0.05) in the cranberry group compared with baseline. Only the ginger group showed a significant increase in IFN-γ mRNA from baseline, which remained elevated for 24 h following GXT. There was no notable change (P>0.05) in the expression of IFN-γ mRNA in the cranberry or water groups. There was no effect (P>0.05) of exercise or treatment on the expression of IL-6 mRNA (Fig. 6c).
Graphs present mean ± SE plasma CK (a) and plasma AST (b) concentrations measured before and after GXTs following administration of either water, cranberry extract or ginger extract. Exercise produced significant increases in CK (P < 0.05) versus resting mean in all groups. A symbol (τ) denotes a significant difference due to treatment (P < 0.05). There were no exercise or treatment effects for AST (P>0.05)

Graphs present mean TNF-α (a), IFN-γ (b) and IL-6 mRNA expression (c). There was a significant effect of exercise on TNF-alpha (6a) and IFN-gamma (6b) mRNA expression when horses were administered ginger and water, but there was no effect of exercise (P < 0.05) when horses were given cranberry. There was no effect (P>0.05) of either exercise or treatment on IL-6 mRNA expression. An asterisk (*) denotes a significant (P < 0.05) difference from PRE-EX

Discussion
A major finding of this study was that ginger extract reduced recovery (defined as the time for VO2 to recover from the peak observed at fatigue to a post-exercise plateau). This marker of recovery focuses on the fast, or alactic, phase of the VO2 recovery curve where one ‘pays back’ the stores of ATP utilized during exercise. It is well known that ATP is essential for every bodily process. Therefore, a faster recovery may enable one to perform subsequent exercise with less time in between bouts. Funding for this project came from the Department of Defense, and the horse was used to screen the extracts for potential efficacy for use in warfighters who would be performing various types of exercise. This marker of recovery was used because of its relevance to performing repeated bouts of exercise in humans; however, ginger extract's positive effect on recovery time may make it a useful tool for horses competing in endurance, jumping or racing events. The ginger extract did not affect other physiological responses to exercise, such as HR, blood pressure, VO2max, run-time to fatigue, plasma TP, HCTs, plasma lactate concentration, core temperature or rectal temperature. Thus, ginger appears to be safe to administer to horses at the dose given; however, further analysis of the compounds present in ginger extract is needed to determine whether those compounds would be picked up by drug tests often done at competitions.
Unfortunately, the above positive benefit was outweighed by ginger's effect on markers of muscle membrane damage and inflammatory cytokines, with a strong increase in the upregulation and expression of mRNA for the pro-inflammatory cytokine TNF-α. This result was unexpected, given that in the literature there are several accounts of ginger's anti-inflammatory propertiesReference Srivastava and Mustafa6, Reference Surh8, Reference Tjendraputra, Tran, Liu-Brennan, Roufogalis and Duke23.
In the present investigation, plasma CK concentrations were elevated 4 h post-GXT in all three groups, but concentrations returned to baseline within 24 h. However, there was a greater spike in CK seen in the ginger group at 4 h post-GXT. The increased plasma CK concentration also seen in the ginger group suggests at a minimum an effect on cell membrane permeability as the resulting post-GXT concentrations, while elevated, were well below those indicative of muscle cell damage. Plasma CK concentration can be used as an indicator of muscle cell leakage and/or frank muscle damage. The enzymes CK and AST are normally present within the muscle cells, and do not appear in plasma unless cell membranes experience an increase in permeability or become damagedReference Marlin and Nankervis24. It is normal to see an increase in both plasma CK and AST concentrations after exercise, but extreme or abnormal increases can suggest that muscle damage has occurredReference Marlin and Nankervis24. Increased levels of CK have been observed in horses immediately post-exercise than compared with pre-exercise, and they usually return to normal within 24 hReference Balogh, Gaal, Ribiczeyne and Petri25. Furthermore, plasma concentrations of CK and AST are often evaluated together. CK is found in both cardiac and skeletal muscle cellsReference Harris, Reed and Bayly26, while AST is found in many cell types throughout the body and is by no means tissue specificReference Cardinett, Kaneko, Harvey and Bruss27, Reference Coffman28. AST is generally bound to mitochondria, and levels usually do not rise unless major damage or cell lysis occursReference Coffman28. In horses, the two enzymes have different rates of clearance from the plasma, which accounts for the observation that AST levels in plasma often stay elevated for considerably longer (i.e. a few weeks) than those of CK (i.e. a few days)Reference Cardinett, Kaneko, Harvey and Bruss27. A good deal of exercise physiology research in both humans and horses utilizes CK as a strong marker of muscle damage. In a study performed on six Thoroughbred mares which experienced symptoms of exertional rhabdomyolysis (commonly known as ‘tying-up’, in which horses experience severe muscle cramping), such a diagnosis was confirmed when CK levels exceeded 1000 U l− 1Reference Ward, Valberg, Gallant and Mickelson29. A wide range of CK values in reference to muscle damage have been discussed in the literature, but it seems that damage is not usually considered pathological below the levels of 1000 U l− 1. The fact that no considerable increases were observed in plasma AST concentration suggests that cell damage was not extensive enough to cause concern.
Another explanation for the elevation in CK and cytokines could be that the ginger extract solution was somewhat caustic, and it may have irritated the GI tract, causing smooth muscle cell damage and upregulation and expression of TNF-α mRNA. The upregulation and expression of TNF-α mRNA in the ginger group suggest that some inflammation may have occurred; however, that increase was moderate and short-lived. It is also possible that ginger does not have anti-inflammatory effects in exercising horses, but instead encourages the upregulation of TNF-α mRNA. The latter explanation is less likely as the available literature does not report any pro-inflammatory consequences of consuming ginger extract. Future studies examining alternate formulations (i.e. pill or powder form) of the ginger extract may clarify this disparity.
Another important finding of the present investigation was that cranberry appears to attenuate the upregulation and expression of TNF-α mRNA, but not the appearance of IFN-γ mRNA. Cytokines such as TNF-α, IL-1β and IL-1α can all induce prostaglandin synthesis in endothelial cells, smooth muscle cells and skeletal muscle; therefore, the production of inflammatory cytokines in response to exercise may stimulate the production of prostaglandinsReference Pedersen, Ostrowski, Rohde and Bruunsgaard1. However, it has been documented that the modulation of the expression of mRNA for TNF-α through exercise is influenced by both intensity and duration of the effort, but exercise may have either a slight or no influence on circulating TNF-αReference Moldoveanu, Shephard and Shek3. Generally, human research indicates that the circulating concentration of TNF-α is either unchanged or shows marginal, delayed increases following exerciseReference Suzuki, Nakaju, Yamada, Totsuka, Sato and Sugawara30. Most of these conclusions stem from studies of extended periods of exercise on rapid systemic cytokine release in humans, with less attention on shorter, intense bouts of exercise.Reference Suzuki, Nakaju, Yamada, Totsuka, Sato and Sugawara30. The upregulation and expression of TNF-α mRNA in the present study were first seen immediately after the cessation of exercise in the ginger and water groups. The highest peak of TNF-α mRNA in the ginger group was observed 30 min post-exercise, and in the water group exercise it was observed at 2 h post-exercise, indicating a slight delay. While there was an immediate increase, the peak appearance and magnitude of TNF-α mRNA expression may have been affected by the extract given. Additionally, the present study evaluated the expression of TNF-α mRNA and not the absolute concentration of TNF-α cytokines present, which may in part account for the disparity between the results described here and the majority of other literature in this area. The possibility also exists that the upregulation and expression of TNF-α mRNA vary in horses compared with their human counterparts in response to an exercise challenge. Considering that TNF-α is a major pro-inflammatory cytokineReference Suzuki, Nakaju, Yamada, Totsuka, Sato and Sugawara30, the anti-inflammatory effect of cranberry extract may prove useful in lessening the severity of symptoms associated with mild discomfort caused by inflammation or delayed onset of muscle soreness.
An unexpected observation made in the present study was the lack of a change in the expression of mRNA for the pro-inflammatory cytokine IFN-γ during the control trials where water was administered. This observation was consistent with some human studies that have found little change in the concentration or expression of mRNA for this cytokine after exerciseReference Weinstock, Konig, Harnischmacher, Keul, Berg and Northoff31. However, this observation contrasts with the results of a study of male humans who performed cycling exercise for 30 min and showed increases in IFN-γ mRNA at 30 min post-exerciseReference Kimura, Suzui, Nagao and Matsumoto32. Interestingly, while there was no increase in IFN-γ during the control trial, there was a peak in IFN-γ mRNA 30 min post-exercise in the ginger group. This response, however, may be due to factors other than exercise (i.e. caustic formulation). Results may differ according to the model used to collect data, and how changes are measured. One cannot overlook the possibility that other cytokines (for example, the pro-inflammatory IL-1β or anti-inflammatory IL-12) may have been present but not accounted for by this investigation.
The data from this study also demonstrated that a short, intense, exhaustive bout of exercise can cause an upregulation and expression of TNF-α mRNA in the plasma of horses, but not the upregulation and expression of IL-6 mRNA. This is consistent with the observations made in a prior study of horsesReference Wilson, Singh, Vorsa, Goettl, Kittleson and Roe13. IL-6 is influenced by other cytokines and thus one could speculate that there was no change in IL-6 because increase in TNF-α observed in the ginger and water groups was not potent enough to stimulate the upregulation and expression of the second wave of cytokines, including IL-6. However, it is more likely that IL-6 was only released within the working muscles and was not accounted for in the peripheral blood cells assayed here. This would be consistent with the current thinking that IL-6 is an anti-inflammatory ‘myokine’Reference Pedersen, Steensberg, Fischer, Keller, Plomgaard, Febbraio and Saltin33. More specifically, the release of IL-6 from working human skeletal muscle is positively related to work intensity, glucose uptake and plasma adrenaline concentration, indicating that IL-6 may be linked to the regulation of glucose homoeostasis during exercise, and/or that IL-6 may work as a sensor of carbohydrate availabilityReference Pedersen, Steensberg, Fischer, Keller, Plomgaard, Febbraio and Saltin33. Transcription of IL-6 mRNA is hindered when muscle glycogen availability is reduced, while other evidence suggests that the liver clears IL-6 during exerciseReference Pedersen, Steensberg, Fischer, Keller, Plomgaard, Febbraio and Saltin33. In the present study, exercise was intense, but short in duration, and thus it was unlikely that transcription of IL-6 mRNA was hindered by depletion of muscle glycogen.
Conclusion
This is the first study to examine the effect of cranberry and ginger extracts on cytokine markers of inflammation and markers of performance in horses. Cranberry extract appears to attenuate the upregulation and expression of TNF-α mRNA after a short, intense bout of exercise in horses. Ginger decreases cardiovascular recovery time dramatically, but may encourage the upregulation and expression of IFN-γ mRNA if given in a liquid formulation. The expression of IL-6 mRNA did not appear to be affected by the GXT or extracts given. The effects of the cranberry and ginger extracts described here may or may not be due to the chemical properties of either the flavonol glycosides or proanthocyanidins detailed in Table 1. Such an inquiry was beyond the scope of this study, but leaves a question for future research to answer. More studies of this kind are needed to find alternatives to administering NSAIDs to treat horses with minor inflammation.
Acknowledgements
The authors would like to thank the following members of the Rutgers University Equine Science Center for their contributions to this research: Todd Wilkinson, Jennifer McKeever, Cindy Betros, Carey A. Williams and Frank Petersen. In addition, the authors thank Jackie Stiltner, from the University of Kentucky, who conducted the RT-PCR assays for the inflammatory cytokines. Support for this work was provided by the United States Department of Defense, US Army Natick Soldier Center and the New Jersey Agricultural Experimentation Station. This paper represents a portion of the thesis submitted for fulfilment of requirements for the Master of Science degree completed by N.R. Liburt.