


INTRODUCTION
Accelerators with higher energy are required to explore deeper material images in particle physics. To reduce costs and complexity, a number of new accelerator schemes with higher acceleration gradients than traditional schemes have been proposed (Wurtele, Reference Wurtele1994). Since the 1980s, in-depth research into laser acceleration of charged particles has been carried out (Leemans et al., Reference Leemans, Nagler, Gonsalves, Ta Th, Nakamura, Geddes, Esarey, Schroeder and Hooker2006; Mourou et al., Reference Mourou, Tajima and Bulanov2006; Chen et al., Reference Chen, Unick, Vafaei-Najafabadi, Tsui, Fedoseevs, Naseri, Masson-Laborde and Rozmus2008). However, challenges still remain in identifying an appropriate scheme. In addition to laser plasma acceleration, simple vacuum laser acceleration has been the focus of extensive attention (Salamin, Reference Salamin2006; Varin et al., Reference Varin, Piché and Porras2005; Kawata et al., Reference Kawata, Maruyama, Watanabe and Takahashi1991; Singh, Reference Singh2005; Malka et al., Reference Malka, Lefebvre and Miquel1997; Hora et al., Reference Hora, Hoelss, Scheid, Wang, Ho, Osman and Castillo2000; Salamin & Keitel, Reference Salamin and Keitel2002; Stupakov & Zolotorev, Reference Stupakov and Zolotorev2001; Wang et al., Reference Wang, Scheid, Hoelss and Ho2001a, Reference Wang, Ho and Yuan2001b; Niu et al., Reference Niu, He, Qiao and Zhou2008). Based on these schemes, related applications have been developed, such as X-ray applications (Bessonov et al., Reference Bessonov, Grobunkov, Ishkhanov, Kosatryukiv, Maslova, Yu., Shvedunov, Tunking and Vinogradov2008) and attosecond electron pulses (Varró & Farkas, Reference Varró and Farkas2008). Theoretical studies have revealed that as a 0 approaches or exceeds 100 (a 0 ≡ eE 0/m eωc is a dimensionless parameter specifying the field intensity, where e and m e are the electron charge and mass, respectively, c is the speed of light in vacuum, and ω is the angular frequency of the electromagnetic wave), electrons can be captured by a focused laser beam and then accelerated to GeV energy (Salamin & Keitel, Reference Salamin and Keitel2002; Wang et al., Reference Wang, Ho, Kong, Zhu, Feng, Scheid and Hora1998, Reference Wang, Scheid, Hoelss and Ho2001a, Reference Wang, Ho and Yuan2001b). This scheme is called the capture acceleration scenario (CAS). However, to demonstrate the advantages of CAS, the high laser intensity required is not easy to achieve using current technology. In addition, as a result of the limitation of the incident electron momentum, the CAS cannot be used for multistage acceleration. Recently, we reported that a capture acceleration channel in a slit laser beam can overcome these difficulties (Wang et al., Reference Wang, Scheid and Ho2007). In this channel, electrons can be captured and accelerated to GeV energy using laser beams with intensity as high as Iλ2 ≈ 1020 Wcm–2μm–2, where λ is the laser wavelength in μm. The range for the optimum incident energy is very wide and can reach GeV magnitude. These results are of interest for laser acceleration experiments because the relatively low intensity can be achieved using current chirped pulse amplification techniques and a wide range of incident energies means that multistage acceleration is possible. We previously studied the mechanism and main characteristics of electron acceleration inside a slit of laser beam (Wang et al., Reference Wang, Scheid and Ho2007).
In the present study, the effects of variations in the slit parameters on the electric field and phase velocity distribution, as well as acceleration of electrons with different initial momentum, were investigated. The results indicate that the longitudinal electric field strength and the minimum phase velocity inside the slit decrease as the slit width increases. The longitudinal electric field strength and the minimum phase velocity vary with the phase difference for the laser field between both sides of the slit and reach maxima when the difference is an odd number of times π. The longitudinal electric field strength and the minimum phase velocity for optimum electron acceleration differ for different incident momentum. Furthermore, a study of the size of the accelerating channel revealed that electrons can be effectively accelerated in quite a large spatial region.
FIELD STRUCTURE OF A SLIT LASER BEAM
Similar to our previous study (Wang et al., Reference Wang, Scheid and Ho2007); we used parallel flattened Gaussian beams (FGBs) with a central distance of (2N + 1)w 00 + d to describe the field distribution near a slit, which can be expressed as:
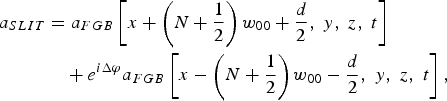
where Δφ is the phase difference between the two laser beams and d is a parameter for denoting the width of the slit width. Figure 1 shows the slit intensity distribution along the x-axis in the focal plane. The case with d = 0 and Δφ = 0 corresponds to one FGB without any slit. Here, an FGB can be expressed as a finite superposition of multi off-axis fundamental Gaussian beams (Tovar, Reference Tovar2001):

Schematic representation of a slit beam shape (solid line) in the focus plane. Two N = 3 multi-Gaussian FGBs are made up of a sum of 2N + 1 off-axis Gaussian beam components (dotted line), respectively.

The function is normalized by the denominator so that its maximum value will be unity. w 00 is the width of the individual Gaussian terms. The high-order corrected vector potential for a monochromatic fundamental Gaussian beam with a long pulse length can be given as (Barton & Alexander, Reference Barton and Alexander1989):


where η = ct − z, ς = z/(kw 002), ξ = x′/w 00, ζ = y′/w 00, ε = 1/(kw 00), ρ2 = ξ2 + ζ2, and Q = 1/(i + 2ς). ϕ0 is the initial phase of the field and f(η) = exp [−(η/cτ)2] is a Gaussian time envelope profile with finite pulse duration τ.
For a linearly polarized pulsed slit laser beam, we assume A = a SLITêx. Under a Lorentz gauge, the scalar potential is:

Then the electric and magnetic components can be obtained using E = −∂A/∂t − ∇Φ and B = ∇× A.
Investigation of the laser intensity and longitudinal electric field distribution of a slit laser beam revealed that we can obtain a well-shaped ponderomotive potential and a strong longitudinal electric field distribution near the central axial if we slit a laser beam and let Δφ = π; in other words, the phases on the two sides of the slit are reversed. Figure 2a shows the amplitude distribution for the longitudinal electric field of a slit laser beam with d = w 00 and Δφ = π in the xz plane. The ponderomotive potential well is beneficial for trapping electrons in the slit and the strong longitudinal electric field will help to accelerate electrons. If Δφ = 0, a similar intense axial electric field will not be obtained in the center of the slit. Figure 2b presents the |E z|max distribution at origin x = y = 0 for different d and Δϕ values. It is evident that |E z|max in the slit center takes a maximum value if Δϕ = (2  + 1)π (
 is an integer) and |E z|max in the slit center decreases with increasing d.
(Color online) (a) The distribution of |E z|max of a slit laser beam with d = w 00 and Δϕ = π in the xz plane, where |E z|max is the maximum longitudinal electric field amplitude in the whole time range. The right insets of Figure 1 shows longitudinal electric field amplitude as a function of x along line y = z = 0. (b) The distribution of |E z|max at origin x = y = 0 for different d and Δϕ. Other parameters chosen are N = 1, a 0 = 1, w 00 = 100 and τ = 200.

PHASE VELOCITY DISTRIBUTION
The physical mechanism underlying CAS is that when an electron is captured, due to laser diffraction near the focus, the effective wave phase velocity along the dynamic trajectory of the captured particle can be less than c, or even less than the speed of the particle. Thus, the captured electron can be kept in the acceleration phase of the wave for a very long time and gain considerable energy (Wang et al., Reference Wang, Ho and Yuan2001b). Here the longitudinal electric field E ‖ is responsible for the energy gain (Wang et al., Reference Wang, Scheid, Hoelss and Ho2001a). The wave phase velocity along a particle trajectory can be calculated via as (Wang et al., Reference Wang, Ho and Yuan2001b):

where φ is the phase of the wave field, (V φ)J is the phase velocity of the wave along the trajectory and (Λφ)J is the gradient of the phase field along the trajectory. Then the phase slippage velocity of an electron in a vacuum electromagnetic field can be approximately estimated by (V φ)J − V ‖, where V ‖ is the velocity along the wave propagation direction. For a relativistic electron, V ‖ ≈ c. Thus, it would be expected that when (V φ)J ≈ c, as in the CAS acceleration stage, there should not be noticeable phase slippage. Note that the minimum value of the phase velocity occurs for an electron trajectory along the direction of the phase gradient (Wang et al., Reference Wang, Ho and Yuan2001b) and the minimum value of the phase velocity is given by V φ,min = ck/|∇φ|.
For a long laser pulse, the variance of the frequency spectrum can be neglected, which can then be regarded as a monochromatic wave with frequency ω0(ω0 = ck 0 = ∂φ/∂t). Without loss of generality, we assume ψ (r, t) = ψrt (r,t)e iφ(r,t) , where |ψrt (r, t)| is the wave amplitude, and φ(r,t) is the phase of the wave. By substituting ψ (r,t) into the classical wave equation, we can obtain the wave vector (Chen et al., Reference Chen, Ho, Wang, Kong, Xie, Wang and Xu2006):

where 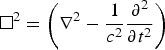 is an operator. Thus, a new formula for the minimum phase velocity is obtained:

A prominent feature of this formula is that the phase velocity depends explicitly on the amplitude distribution of the wave field, whereas the phase does not appear. More importantly, we can construct a phase velocity distribution by designing the amplitude distribution.
For a long laser pulse, we can use Eq. (8) to obtain the minimum phase velocity distribution at a certain time. Because the scale range of V φ,min is too small, we use a parameter δ to display V φ,min = (1 = 10−3δ)c indirectly. Obviously, δ = 0 corresponds to V φ,min = c. Figure 3a shows the δ distribution in the xz plane around the focus at t = z/c for a slit laser pulse with d = w 00 and Δφ = π for parameters N = 1, a 0 = 1, w 00 = 100, and τ = 200. δ is shown as a function of z along the line y = z = 0 for w 00 = 100 and w 00 = 120 are shown in the inset. It is evident that the slit center is a super-luminal phase velocity region and unlike a fundamental-mode Gaussian beam center with a rapid rate of uplift (Chen et al., Reference Chen, Ho, Wang, Kong, Xie, Wang and Xu2006), its distribution is flat. It is evident that the phase velocity in this area decreases as w 00 increases. Figure 3b shows the δ distribution at the origin x = y = 0 for different d and Δϕ. The phase velocity in the slit center takes a relatively large value in the domain near Δϕ = (2  + 1)π (
 is an integer) and the phase velocity in the slit center decreases with increasing d.
(Color online) (a) The distribution of parameter δ, i.e., the minimum phase velocity V φ,min = (1+10−3δ)c, of the axial electric field E z near the focus of the slit laser beam in xz plane at t = z/c. The right inset shows δ as a function of x along line y = z = 0 (solid line for w 00 = 100 and dotted line for w 00 = 120). (b) The parameter δ distribution at origin x = y = 0 for different d and Δϕ. Other parameters are same as those in Figure 1.

SIMULATION RESULTS
The configuration of the electron–laser interaction is the same as used our previous study (Wang et al., Reference Wang, Scheid and Ho2007), as shown in Figure 4. The laser pulse impacts on electrons injected parallel to the z-axis. The pulsed laser beam center is assumed to reach the point x = y = z = 0 at t = 0, and an electron arrives at the xy plane (z = 0) at time t = −Δt d under the condition of free motion, i.e., without the influence of the laser fields. Thus, Δt d specifies the relative delay between the laser pulse and the electron. Here, we take the sign of Δt d such that when Δt d < 0 the laser pulse propagates ahead of the electron and the electron can mainly interact with the trailing temporal edge of the pulse, whereas for Δt d > 0 the electron can interact with the leading edge of the pulse. Our previous study revealed that a vacuum electron capture acceleration channel exists in the slit laser beam (Wang et al., Reference Wang, Scheid and Ho2007).
(Color online) Schematic geometry of the interaction of an electron with a laser beam.

To facilitate calculation and analysis, a relatively simple case is considered (N = 1). Figure 5 shows the maximum net energy exchange ΔEmax = (γfm − γi)m ec 2 as a function of the incoming momentum. The optimum incident energy range is very wide and can reach GeV magnitude, so that multi-stage acceleration is possible. However, it should be noted that the maximum net energy gain does not increase monotonically with the incoming momentum. For higher incident energy, phase slippage between the electron and the laser field in the super-luminal velocity region can be slower so that the electron remains in the accelerating phase for longer, resulting in a greater net energy gain. However, the question arises as to why there are significant decreases in some regions (e.g., near P i = 50 and P i = 3000). According to the above analysis, the energy gain is proportional not only to the accelerating time, but also to the intensity of the accelerating electric field. These two factors are related to the phase velocity distribution and the longitudinal electric field distribution, respectively. We also know that variations in d and Δϕ will significantly change the distributions of the phase velocity and the longitudinal electric field, and a region with low phase velocity always corresponds to a low longitudinal electric field. To obtain good acceleration conditions with low phase velocity and high longitudinal electric field, both parameters should be optimized. Figure 6 shows the distribution of the maximum ejection energy γfm in the two-dimensional plane spanned by d and Δϕ for different values of the injection momentum. Apparently, the optimum d and Δϕ are different for different incident momenta. The results in Figure 5 are for d = w 0 and Δϕ = π, which are near the optimum accelerating region for P i = 10 but correspond to the worst region for P i = 50, so it is not surprising that the energy gain for an electron with P i = 50 is not as good as that for P i = 10. In view of the entire distribution, the acceleration of high-incident-energy electrons is better than that of low-energy electrons. In addition, according to the analysis by Stupakov and Zolotorev (Reference Stupakov and Zolotorev2001), the effective ponderomotive accelerating distance depends on the Rayleigh length and the pulse width of the laser beam and an optimal relationship between them exists for a given incident momentum. In other words, a certain Rayleigh length and pulse width of the laser field corresponds to a certain optimum incident momentum.
Dependence of the maximum net energy exchange ΔE max = (γfm − γi) m ec 2 on the incoming momentum P i = P zi. The circles (○) are for the case of a laser beam with w 00 = 150, the squares (□) for w 00 = 100 and the crosses (×) for w 00 = 50. Other parameters are Δt d = 0, N = 1, a 0 = 10, τ = 200, d = w 00 and Δφ = π.

(Color online) The distribution of maximum ejection energy γfm in the two-dimensional plane spanned by d and Δϕ for different values of injection momentum: (a) P i = 10, (b) P i = 50. Other parameters are Δt d = 0, N = 1, a 0 = 10, τ = 200 and w 00 = 100.

To study the size of the accelerating channel, the acceleration of electrons with different initial positions was simulated with P i = 10, d = 2.5w 00, and Δϕ = 2π/3. If |Δt d| is large enough, the electron experiences a negligible laser field and travels straight ahead. The maximum ejection energy is illustrated in Figure 7 as a function of the electron initial position x 0 for a small delay time Δt d. It is evident that electrons are effectively accelerated in a range of almost twice the slit width (±d). Meanwhile, the accelerating channel in this case is asymmetric. Simulation revealed that when Δϕ =−2π/3, the deviation is just the opposite.
(Color online) The maximum ejection energy γfm as function of the electron initial position x 0 for different delay time Δt d = 0 (solid line), Δt d = 100 (dotted line) and Δt d = −100 (dash dotted line). Other parameters are N = 1, a 0 = 10, τ = 200, w 00 = 100 d = 2.5w 00 and Δφ = 2π/3.

DISCUSSION AND CONCLUSION
The axial electric field intensity distribution of a slit in laser beams was analyzed. We found that a strong axial electric field distribution exists near the central axis of the slit and that this axial electric field decreases with increasing slit width. The phase velocity distribution of the axial electric field near the focus of the slit laser beam was studied. We found that the phase velocity in the slit center takes a relatively large value in the domain for which the phase difference between the two sides of the slit is about an odd number of times π. We also found that the distribution of the phase velocity in the slit center is flat and the phase velocity decreases as the slit width d increases. Our simulations show that compared to a fundamental-mode Gaussian laser beam, electrons can be more favorably captured and accelerated in a laser beam with a slit. If a laser beam with a slit is used, a more intense longitudinal field can be produced and a higher acceleration gradient will be induced. Currently, it is easy to achieve this slit using two parallel laser beams at a certain distance apart and with a phase difference. Our simulation results demonstrate that the size of the accelerating channel is relatively large and electrons distributed on a large scale near the slit center can be captured and accelerated to high energy. This is also of interest for laser acceleration experiments.
ACKNOWLEDGMENTS
This work was supported partly by the National Natural Science Foundation of China (No. 10475018), China Postdoctoral Science foundation 20080441169, and The National High Technology Research.



