Implications
Present work contributes to the evaluation of the energy value of rations for ruminants on nutrient bases. The post-hepatic release of ketogenic nutrients was predicted by a meta-analytical approach. Predictors were derived from INRA Feed Tables and the calculated energy balance of animals, which are easy to use in rationing tools.
Introduction
In ruminant nutrition, the evolution of feed evaluation systems towards nutrient-based systems is an important challenge for the development of multi-objective systems. Previous research showed that metabolizable energy (ME) can be quantitatively defined in terms of nutrients appearing in the portal vein (Loncke et al., Reference Loncke, Ortigues-Marty, Vernet, Lapierre, Sauvant and Nozière2009) which describe the incremental ‘net’ supply of nutrients past gut metabolism. Adequately defining the relationships between net portal appearance and net hepatic flux of nutrients constitutes the next step towards the above objective since the liver is at the metabolic crossroad between nutrient supply and requirements (Ortigues-Marty et al., Reference Ortigues-Marty, Dardevet and Savary-Auzeloux2003). Mechanistic models of liver metabolism exist, but they were mainly developed for research purposes applied to lactating ruminants (review by Nozière et al., Reference Nozière, Ortigues-Marty, Loncke and Sauvant2010) and are difficult to link with rationing tools in their current version.
This work focuses on ketogenic nutrients, particularly on acetate, butyrate, and β-hydroxybutyrate. The objective of this paper was (1) to test predictors of the variations in the net hepatic fluxes of acetate, butyrate and β-hydroxybutyrate in ruminants, (2) to explore the response equations of the net splanchnic fluxes of these nutrients to dietary and animal descriptors and (3) to quantify the respective contributions of push and pull regulations in the response equations. To subsequently use results in feed evaluation systems, the conditions imposed on the predictors were their compatibility with known dietary characteristics and applicability to different ruminant species and productions. The empirical approach of meta-analysis on published data was applied to investigate the knowledge on ketogenic nutrient fluxes through the ruminant liver and derive prediction equations. It was focused on the within-study effects to evaluate the incremental responses of hepatic and splanchnic fluxes to changes in net portal appearance.
Material and methods
Selection of publications and description of the nutritional values of diets
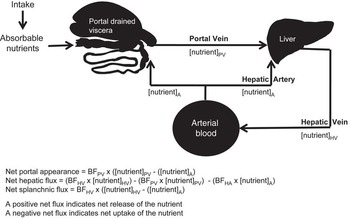
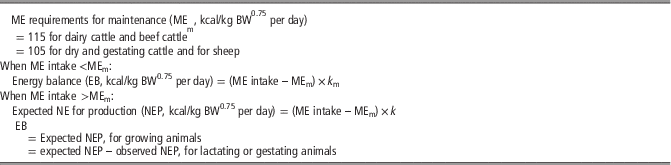
We used the FLuxes of nutrients across Organs and tissues in Ruminant Animals database (Vernet and Ortigues-Marty, Reference Vernet and Ortigues-Marty2006) which includes ~250 international publications. To be eligible, publications had to report the net hepatic fluxes and the net splanchnic release of acetate, butyrate and β-hydroxybutyrate (see Figure 1 for definitions) and no exogenous treatments or infusions had to be applied. For each nutrient, and in the same respective order, a total of 25, 22, 24 publications (corresponding to 61, 59, 58 dietary treatments) were eligible and selected for the present work (Supplementary Table S1 lists all the selected references). In all studies from this data set, different dietary compositions or amounts were tested with frequent meal distributions for the nutrient supply and animal metabolism to be at steady state. The selected publications did not systematically report the chemical composition and nutritional value of feeds and diets. Since data aggregation required consistent, homogenous and exhaustive ration descriptions, the feeds and diets from all relevant publications were described according to the INRA Feed Evaluation System (2007) as described and validated by Loncke et al. (Reference Loncke, Ortigues-Marty, Vernet, Lapierre, Sauvant and Nozière2009). The energy balance (EB) of the animal, expressed on a net energy basis, was considered a useful indicator of nutrient demand, and calculated as indicated in Table 1 according to INRA (1988).
Schematic representation of the afferent and efferent blood vessels of the portal drained viscera and the liver. Calculations of the net fluxes relied on blood flow (BF) in the portal vein (PV), hepatic vein (HV) or hepatic artery (HA) and nutrient concentrations in blood.

Calculation of energy balance of animals

ME=metabolizable energy; NEP=net energy production.
With k m=0.287×ME/GE +0.554; k=k l=0.249×ME/GE+0.463 for lactation and moderate growth or k=k g=0.13 for gestation; observed NEP for lactation=739 kcal/L milk per day, assuming a milk fat content at 4% (except in the five publications which reported milk fat content ranging from 3.6% to 4.5%), and NEP for gestation=4096 kcal/day for Holstein cows, 1600 kcal/day for Dorset sheep and 2560 kcal/day for Lacaune sheep. All values are based on INRA (2007).
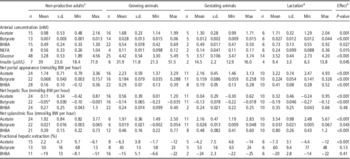
Attention was paid to the methods used to determine net hepatic fluxes to ensure that all results could be combined in the meta-analysis. In the eligible data set, nutrient concentrations (Table 2) were mainly determined on blood (94%, 94% and 89% of the acetate, butyrate and β-hydroxybutyrate data, respectively). Given that choice of matrix has no impact on β-hydroxybutyrate (Nozière et al., Reference Nozière, Rémond, Ferlay and Doreau1998) or butyrate net fluxes (Reynolds and Huntington, Reference Reynolds and Huntington1988) and presents only a small underestimation of net portal appearance of acetate when measured in plasma (by 7%, Nozière et al., Reference Nozière, Rémond, Ferlay and Doreau1998), no attempt was made to homogenize data and correct plasma into blood concentrations and fluxes. Moreover, the analytical methods for measuring β-hydroxybutyrate (β-hydroxybutyrate-dehydrogenase plus hydrazine) and volatile fatty acids (extraction by ion exchange resin in all but one publication) were similar between publications. Finally, splanchnic blood flows were measured using the para-aminohippuric acid down-stream dilution method. Eighty per cent of the publications did not correct for the incomplete recovery of para-aminohippuric acid across the liver, demonstrated in sheep by Katz and Bergman (Reference Katz and Bergman1969) and in cows by Rodriguez-Lopez et al. (Reference Rodriguez-Lopez, Cantalapiedra-Hijar, Durand, Isserty-Thomas and Ortigues-Marty2014). To evaluate the potential impact of this methodological error, it was specifically compared whether correction of net hepatic fluxes and net splanchnic release data for incomplete marker recovery modified the prediction equations. We recalculated net fluxes assuming that the hepatic arterial blood/plasma flow represented 10% of hepatic venous blood/plasma flow as measured when para-aminohippuric acid is de-acetylated before analysis (Rodriguez-Lopez et al., Reference Rodriguez-Lopez, Cantalapiedra-Hijar, Durand, Isserty-Thomas and Ortigues-Marty2014). This correction could only be applied when publications reported blood flow and nutrient concentration data in addition to net fluxes. It was the case in 61%, 59% and 76% of the publications used in the models of acetate, butyrate and β-hydroxybutyrate, respectively.
Description of the reported nutrient arterial concentrations, net hepatic and splanchnic fluxesFootnote 1 and fractional hepatic extractionFootnote 2 used for the meta-analyses according to physiological status

Min=minimum value; Max=maximum value; n=number of treatments; BHBA=β-hydroxybutyrate; NEFA=non-esterified fatty acids.
1 A positive value indicates a net release; a negative value indicates a net uptake.
2 A positive value indicates an extraction; a negative value indicates a release.
3 Fasting included.
4 The dairy cattle were between 11 and 240 days in milk.
5 Physiological state effect.
Potential predictors of variation in nutrient net hepatic flux and net splanchnic release
Potential predictors of the net hepatic fluxes of nutrients were identified from current knowledge on hepatic metabolism. The meta-analyses described below are testing the hypotheses that marginal changes in the identified potential predictors are inducing marginal changes in the net hepatic or splanchnic fluxes under study. Where net hepatic flux was negative (corresponding to a net hepatic uptake, Figure 1), potential predictors were the net portal appearance of the relevant nutrient or its dietary predictors (Loncke et al., Reference Loncke, Ortigues-Marty, Vernet, Lapierre, Sauvant and Nozière2009) and the net portal appearance of interacting nutrients. Where net hepatic flux was positive (corresponding to a net hepatic release, Figure 1), potential predictors were the net portal appearance of the known precursors of the relevant nutrient in addition to interacting nutrients. Interacting nutrients were identified from significant correlations between net hepatic fluxes of acetate, butyrate or β-hydroxybutyrate and fractional hepatic extraction or release rates or (arterial or portal) concentrations of other nutrients.
Acetate is not intensively metabolized by the liver. There is a small unidirectional uptake of acetate, but the liver appears to be a net acetate producer (Reynolds, Reference Reynolds1995). Acetate is produced from intra-mitochondrial acetyl-CoA mainly from the β-oxidation of long-chain fatty acids along with β-hydroxybutyrate but also from all substrates potentially metabolized into acetyl-CoA, such as butyrate (Annison et al., Reference Annison, Leng, Lindsay and White1963), other volatile fatty acids and ethanol from silages (Buckley and Williamson, Reference Buckley and Williamson1977), and amino acids (Pethick et al., Reference Pethick, Lindsay, Barker and Northrop1981). The present study tested relationships between net hepatic fluxes of acetate and the total net hepatic uptake of non-esterified fatty acids or EB. The later was considered as an indicator of non-esterified fatty acids supply based on the exponential relationship shown by Chilliard (Reference Chilliard1985) where arterial non-esterified fatty acid concentration (in mmol/L)=0.225×e−0.0151×EB (EB in kcal/kg BW0.75 per day). Given the limited quantitative importance of net hepatic fluxes of acetate, emphasis was placed on prediction of net splanchnic release of acetate from its net portal appearance and its predictors, that is ruminally fermented organic matter (RfOM) intake and RdNDF/RfOM (ratio between rumen digestible NDF (RdNDF) and RfOM, Loncke et al., Reference Loncke, Ortigues-Marty, Vernet, Lapierre, Sauvant and Nozière2009]. These predictors also reflect the incremental supply of nutrients from the rumen, after the net metabolism of acetate in gut tissues. Butyrate is highly taken up and metabolized by the liver; more than 80% of the absorbed butyrate is removed in a single pass (Bergman and Wolff, Reference Bergman and Wolff1971). Net portal appearance of butyrate was thus tested as the primary predictor of net hepatic flux of butyrate. Hepatic ketogenesis is driven by the known β-hydroxybutyrate precursors (butyrate, acetate and non-esterified fatty acids; Heitmann et al., Reference Heitmann, Dawes and Sensenig1987). Considering the scarcity of data on net hepatic non-esterified fatty acid uptake, less precise predictors of the net hepatic flux of β-hydroxybutyrate were considered, the EB (as an index of non-esterified fatty acid availability) and RfOM intake (as a precursor of both acetate and butyrate hepatic supply). There was as a dearth of data on aceto-acetate (n=seven treatments; data not shown) for consideration in the models. There was no data available on medium-chain fatty acids. Net splanchnic release of nutrients results from both nutrient net portal appearance and net hepatic metabolism. Therefore, net splanchnic release was predicted by successively applying the net portal appearance models from dietary characteristics (Loncke et al., Reference Loncke, Ortigues-Marty, Vernet, Lapierre, Sauvant and Nozière2009) followed by the net hepatic flux models obtained in the present work.
Meta-analyses
The meta-analyses focused on the responses of the different fluxes to variations in X variables intra-studies. Hence, they were carried out according to the heuristic method of Sauvant et al. (Reference Sauvant, Schmidely, Daudin and St-Pierre2008) which considers that the study effects on the results may be partly accounted for by differences in experimental conditions and methods. Hence the study effect was considered as fixed. Major predictors (X variables) were first selected as detailed above. Second, publications were coded to specifically explore intra-study variations due to the X predictors. No selection was made on the Y variables. Any other cause of heterogeneity between studies was explored as well as its impact on equation parameters. All the factors which altered the relationship between variations in the X variables and variations in the hepatic or splanchnic fluxes were considered and tested as interfering factors. This recognizes the non-random character of part of the variability present in the data. This method evaluates a ‘true’ within-study effect of X variables on the net hepatic flux or net splanchnic release of each nutrient.
Description of the meta-design
The meta-design was described by statistics (mean, standard deviation, range of values) generated for each parameter in the selected data sets. The matrix of correlations between dietary parameters, nutrient concentrations, net portal appearance, net hepatic flux and net splanchnic release was established. When relevant, principal component analyses were carried out to establish potential relationships over the full data set. Species and physiological state effects were tested by one-way ANOVA. Normal data distribution and homogeneity of variances were tested by Shapiro–Wilk and Levene tests. All of the data (nutrient intake, net portal appearance, and net hepatic and splanchnic fluxes) were initially expressed as a function of BW1.0 to ensure normal distribution of the variables across species (Loncke et al., Reference Loncke, Ortigues-Marty, Vernet, Lapierre, Sauvant and Nozière2009).
Selection and coding of studies
In order to select relevant studies for subsequent meta-analyses, the full set of selected publications was coded in several steps (Vernet et al., Reference Vernet, Lapierre, Nozière, Léger, Sauvant and Ortigues-Marty2005; Sauvant et al., Reference Sauvant, Schmidely, Daudin and St-Pierre2008), considering first the experiments, and second the groups of treatments that changed due to only one factor, defined as studies within a given experiment. Studies were coded for variations in the proportions of forage to concentrate, intake level, forage type, CP or starch content of the diet, physiological state, which are known to affect the selected predictors. Two reliability criteria were defined to identify eligible data. First, when the reported blood or plasma concentrations of nutrients were below the analytical limits of quantification (Ortigues-Marty et al., 2001) determined in our laboratory (0.692 mM for acetate, 0.22 mM for β-hydroxybutyrate and 0.049 mM for butyrate), the data were considered unreliable. Any of such data would have been removed from the data set if justified by post-optimization analyses, but this did not occur in any of the selected publications. Second, data were eligible only if the reported net portal appearance varied by more than 2% within-study, as also justified by post-optimization analyses. This conservative threshold eliminated studies with absolutely no variation in X variables, but retained studies with small variations. In this process 9.8% (acetate), 10.2% (butyrate) and 2.9% (β-hydroxybutyrate) of all treatments were eliminated. No eligibility criteria were set for the Y variables.
Determination of response equations
Relationships between Y (net hepatic flux or net splanchnic release of a nutrient) and the potential explanatory variables X were studied using a variance-covariance model:
 $$\eqalign{Y=\alpha {\plus}\beta X{\plus}{\rm animal\ profile}{\plus}\alpha i{\rm }\left( {{\rm animal\ profile}} \right) \cr {\plus}{\rm animal\ profile}{\times}X{\plus}{\rm error}$$
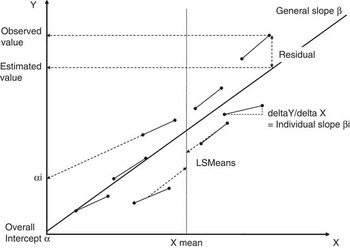
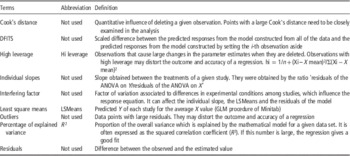
where α is the overall intercept and αi is the effect of study i on intercept α (Table 3 and Figure 2 for definitions). The study effect is nested within animal profile, that is animal species or physiological state. Parameter β is the slope of the overall relationship. Quadratic models were also tested. Because the experimental conditions were not randomly distributed and were specific to each study, study was considered as a fixed factor. The range of inference for this meta-analysis is, therefore, limited to the domain of the specific experiments in the data set (Sauvant et al., Reference Sauvant, Schmidely, Daudin and St-Pierre2008). All initial statistical analyses were carried out using GLM models (Minitab, Version 14 and SAS, Version 9.0). The normality of residuals was checked, and outliers were identified based on residuals, high leverage, Cook’s distance, and DFITS (Table 3) according to Sauvant et al. (Reference Sauvant, Schmidely, Daudin and St-Pierre2008). The contribution of each variable to the explained variance (total variance minus variance due to publication and error effects) was calculated.
Representation of meta-analysis terms used in this work and defined in Table 3.

Terms and definitions used in the meta-analysis and in Figure 1

DFITS=difference between fitted values.
Determination of factors influencing the response equations
To explore the influence of experimental conditions or of other nutrient fluxes on the within-study models, the influence of secondary variation factors was tested on the model parameters (residuals, individual within-study slopes and least squares means (LSMeans)) (Table 3 and Figure 2). These interfering factors may be qualitative or quantitative. The qualitative factors considered were: analytical methods, blood or plasma concentration, physiological state and animal species. Their impact was tested by one-way ANOVA. Quantitative factors were variables describing nutrient and hormonal status (concentrations, net portal appearance and net hepatic fluxes of acetate, propionate, butyrate, β-hydroxybutyrate, glucose, α-amino-nitrogen, lactate and non-esterified fatty acids, as well as insulin concentrations), intake level and dietary composition (see Loncke et al. (Reference Loncke, Ortigues-Marty, Vernet, Lapierre, Sauvant and Nozière2009) for details, plus intake of lipids and the N/energy ratio (expressed as g CP/MJ EM)). Regressions were established between model parameters and potential quantitative interfering factors. Only the significant interfering factors are reported.
Optimization of the response equations
Optimization analyses were carried out to evaluate the models, as described by Loncke et al. (Reference Loncke, Ortigues-Marty, Vernet, Lapierre, Sauvant and Nozière2009). Briefly, once models were generated, sensitivity analyses were carried out to test whether the models could be improved heuristically (Sauvant et al., Reference Sauvant, Schmidely, Daudin and St-Pierre2008). If an interfering factor was detected as significant, and if not correlated to the main explanatory variable X, it was tested whether it could be included in the model as significant covariate, and the benefits on the fit were evaluated. Thorough graphical examinations were carried out at each stage of the meta-analysis. Significance was defined at P<0.05, and trends at P<0.10. The model was considered stable when the post-optimization analyses showed neither significant interfering factors on slopes, residuals and LSMeans nor further significant improvement of fit, and no significant interactions between the slope or intercept and the species or physiological state. The residual mean square error (RMSE) was considered low when lower than 10% of the mean value of the predicted variable. This defined the good fit of the model.
External evaluation
A limited external evaluation was carried out in order to check the absence of systematic bias or slope rotation. In addition to publications selected to establish the within-study models, the other data initially excluded from the selected data set (see above) but reporting the net hepatic fluxes and net splanchnic release of acetate, butyrate and β-hydroxybutyrate were used. The prediction models obtained were evaluated by comparing the observed (Y) and the predicted net hepatic fluxes or net splanchnic release (X), using a GLM model including a study effect. The model was considered unbiased when the intercept was not different from 0 and when the slope was not significantly different from one.
Results
Critical evaluation of the estimated dietary and animal characteristics
To critically evaluate the estimated animal EB, we used the publications that reported EB data measured in respiratory chambers. Data were only available in growing and finishing steers and all reported positive EB. The expected EB (calculated as indicated in Table 1) was compared with the retained energy reported in the publications. Although only five studies (10 treatments) could be used, the estimated EB and reported EB of the animals were closely correlated, with a slope not significantly different from one (1.07±0.064, P=0.50) and an intercept not different from zero (0.48±0.57 kcal/BW per day, P=0.42). The coefficient of correlation was 0.983 and RMSE was 1.53 kcal/kg BW per day. Moreover, the within-study effect was not significant (P=0.75).
Description of the meta-design
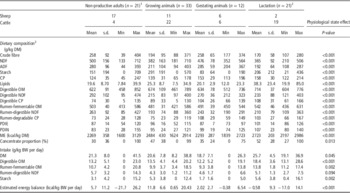
The data set (Table 4) was normally distributed with homogenous variances. Across species (data not shown), DM and RfOM intakes expressed per kg BW were similar but other dietary characteristics and intake differed. As compared with cattle, diets fed to sheep had significantly lower proportions of concentrate, lower digestibility, lower concentrations in CP, starch and ME content, and greater cell wall concentrations. Intakes of these components were therefore different between species. These differences were reflected in the nutrient concentrations and fluxes. However, the widest differences in diet intake and composition were recorded among physiological status rather than among species. Although physiological status was partly confounded with species and feeding conditions, it best discriminated the different animal profiles (Table 4). The majority of data was obtained on non-productive adults, followed by growing, lactating and gestating dry animals. All gestating animals were in late gestation (⩽2 months before calving). Concerning lactation, only dairy cattle were represented; they were between 11 and 240 days in milk (12 treatments for the first 80 days in milk and eight treatments for 120 to 240 days in milk). Lactating cows had the highest DM intake levels and received diets with the highest proportions of concentrate, the highest digestibility and the highest concentrations of starch and ME (Table 4).
Description of animals and diets used for the meta-analyses of net hepatic and splanchnic fluxes of acetate, butyrate and β-hydroxybutyrate according to physiological status

Min=minimum value; Max=maximum value; n=number of treatments; OM=organic matter; PDIE (PDIN)=protein digestible in the intestine when energy (degraded N) is a limiting factor; DM=dry matter.
1 Non-lactating, non-gestating, non-growing, non-finishing animals, fasting animals included.
2 Dairy cattle were between 11 and 240 days in milk.
3 Dietary composition and intake calculated by additivity according to INRA Feed Tables (INRA, 2007).
Based on descriptive statistics, the net hepatic fluxes of acetate, butyrate and β-hydroxybutyrate averaged 0.233±0.0572, −0.111±0.0749 and 6.48±4.70 mmol/kg BW per hour, respectively across the full data set. The net portal appearance and net splanchnic release of acetate were greater in lactating cows (Table 2). For β-hydroxybutyrate, arterial concentrations and net portal appearance were greater in lactating cows while net hepatic fluxes were similar across physiological states (Table 2). The net hepatic flux of β-hydroxybutyrate was positively correlated to RfOM intake (both variables contributed to the first axis of a principal component analyses which explained 68% of the variance, detailed results not shown) and to arterial non-esterified fatty acid concentrations (second axis which explained 22% of the variance).
Adjusted models of net hepatic and splanchnic fluxes of acetate
On average, the net hepatic flux of acetate represented 24% and 10% of its net portal appearance in growing and lactating animals, respectively. Its predictors were investigated. For growing/finishing animals (N=12 experiments; n=25 treatments), the net hepatic flux of acetate increased with dietary fatty acid supply inter-study (P=0.002) and within-study (P=0.017).The slope indicated an increase of 2.67±0.97 mmol/kg BW per hour for each increment of 1 g dietary fatty acids/kg BW per day, without net release in absence of fatty acid supply (intercept equal to 0.13±0.35 and non-different from zero; P=0.72). For the lactating cows, the net hepatic release of acetate was not significantly related to the hepatic uptake of non-esterified fatty acids (n=10 treatments), neither inter-study nor within-study, despite a significant increase with arterial concentrations of β-hydroxybutyrate, both inter-study (linear) and within-study (quadratic). Because the amount of carbon potentially taken up from absorbed dietary and mobilized non-esterified fatty acids was 58% greater than the net hepatic flux of acetate carbon, no model could be established to predict net hepatic flux of acetate from the available information.
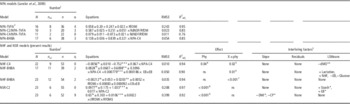
Predictors of the net splanchnic release of acetate were then investigated. A significant relation to the net portal appearance of acetate was obtained intra-study, with a good fit (Table 5). The linear slope suggested that an increment of 1 mmol/kg BW per hour in the net portal appearance of acetate induced an increase in the net splanchnic release of acetate of 1.03 mmol/kg BW per hour, which was not significantly different from one. The intercept was significantly affected by physiological state (gestation<growth). As RfOM intake and RdNDF/RfOM had been identified as the predictors of net portal appearance of acetate (Loncke et al., Reference Loncke, Ortigues-Marty, Vernet, Lapierre, Sauvant and Nozière2009), we tested their relevance as predictors of net splanchnic release of acetate. The net splanchnic release of acetate was unrelated to RdNDF/MOF (data not shown) but significantly related to RfOM intake in a quadratic model (Table 5) nested on physiological state. The slope decreased significantly when DM intake or dietary CP content increased. The intercept was not significantly different from 0, but increased significantly with physiological status (growth>lactation>gestation>non-productive adults). Based on the limited number of interfering factors and the RMSE, the net portal appearance of acetate was the best statistical predictor of variations in the net splanchnic release of acetate. In absence of net portal appearance data, RfOM intake is a satisfactory indirect predictor (Table 5). When correcting data for incomplete recovery of para-aminohippuric acid, performed where feasible (i.e. in 14 out of the 22 experiments), net hepatic fluxes of acetate tended to be reduced (0.187±0.052 v. 0.337±0.073 mmol/kg BW per hour; P<0.07) but the slope and the intercept of the splanchnic release equation were not significantly modified within the same data set (Table 6).
Parameters and equations of net portal appearance models (Loncke et al., Reference Loncke, Ortigues-Marty, Vernet, Lapierre, Sauvant and Nozière2009) and the models of responses of net hepatic and net splanchnic fluxes of acetate, butyrate and BHBA to variations in net portal appearance, RfOM intake or energy balance

BHBA=β-hydroxybutyrate; RfOM=ruminally fermented organic matter; NPA=net portal appearance; TVFA=total fatty acids; C2=acetate; C4=butyrate; RMSE=residual means square error; NHF=net hepatic flux; NSR=net splanchnic release; LSMeans=least squares means; Conc=concentrate.
Net fluxes are expressed in mmol/kg BW per hour, RfOMI in g/kg BW per day and EB in kcal/kg BW per day.
1 N=number of experimental groups in the model; n αi : number of experimental groups with αi significantly different from zero; n=number of treatments in the model; n r=number of treatments rejected from the model (outliers), PHY=physiological status.
2 For silage-fed animals, the volatile fatty acids (VFA) of fermentative products (unaccounted for in the NPA-TVFA model of Loncke et al., Reference Loncke, Ortigues-Marty, Vernet, Lapierre, Sauvant and Nozière2009) was added: the amount of fermentative products from silages was estimated according to INRA Feed Tables (INRA, 2007), and a fixed value of 11 mmol VFA absorbed/g fermentative products was assumed, based on a compilation of 100 silage data sets, by Baumont et al. (INRA, unpublished data) ns=not significant (P>0.10); *P<0.05; **P<0.01; ***P<0.001; nsintercept non different from zero (P>0.05).
3 The minus sign indicates a negative effect on net hepatic or splanchnic flux; the plus sign indicates a positive effect on net hepatic or splanchnic flux.
4 Physiological status effect on the intercept: Δ=−0.035 for growing animals, not significant for other statuses.
5 Physiological status effect on the slope: Δ=0.264 for growing animals, not significant for other statuses.
6 Physiological status effect on the EB² slope: Δ=−0.00071 for non-productive adults, and 0.00098 for lactation. Gestation was not determined.
7 Physiological status effect on the EB² slope: Δ=−0.00041 for non-productive adults, −0.00065 for growing animals, and 0.00106 for lactation. Gestation was not determined.
8 Physiological status effect on the intercept: Δ=0.294 for growing animals and −0.144 for gestation.
9 Physiological status effect on the intercept: Δ=−0.699 for non-productive adults, 0.555 for growing animals, −0.492 for gestation and 0.636 for lactation.
Response models of net hepatic and splanchnic fluxes (mmol/kg BW per hour) of acetate, butyrate and BHBA after correction of hepatic blood flows for incomplete para-aminohippuric recovery

Since corrections could not be applied to the full data set, uncorrected and corrected values are shown for the sub-data sets used.
N=number of experimental groups in the model; RMSE=residual means square error; R 2 adj=adjusted R 2; NSR=net splanchnic release; NHF=net hepatic flux; NPA=net portal appearance; C2= acetate; C4=butyrate; BHBA=β-hydroxybutyrate; EB=energy balance (kcal/kg BW per day).
aNo significant difference with the same parameter calculated from the whole data set.
bSignificant difference with the same parameter calculated from the whole data set.
cNo significant difference with the same parameter calculated from the PAH-uncorrected sub-data set (P>0.05).
dSignificant difference with the same parameter calculated from the PAH-uncorrected sub-data set (P<0.05).
Adjusted models of net hepatic and splanchnic fluxes of butyrate
The net hepatic flux of butyrate was significantly and linearly related to its net portal appearance within-study and net hepatic flux of butyrate could be predicted from net portal appearance with a good fit (Table 5). The linear slope indicated that net hepatic butyrate uptake increases by 0.752 mmol/kg BW per hour for each increment of net portal appearance of butyrate of 1 mmol/kg BW per hour. However, the slope and the intercept of this model were significantly influenced by physiological status. In growing animals, only 49% (data not shown) of the increment in net portal appearance of butyrate was taken up by the liver. When applying successively the net portal (Loncke et al., Reference Loncke, Ortigues-Marty, Vernet, Lapierre, Sauvant and Nozière2009) and hepatic (Table 5) models, the response of net splanchnic release of butyrate was predicted from changes in intake and dietary composition (RfOMi, RdNDF/RfOM). When correcting data for incomplete recovery of para-aminohippuric acid, performed where feasible (in 13 out of the 20 experiments, with a higher proportion of data from growing animals), net hepatic flux of butyrate (−0.105±0.012 and −0.107±0.012 mmol/kg BW per hour for uncorrected and corrected fluxes, respectively) was not significantly modified nor any parameter of the model, when compared within the same sub-data set (Table 6).
Adjusted models of net hepatic and splanchnic fluxes of β-hydroxybutyrate
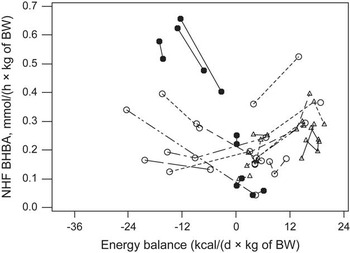
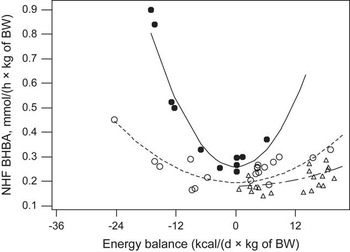
Since the data set was not complete, it was not possible to develop a model of net hepatic flux of β-hydroxybutyrate that accounted for all potential predictors (in particular non-esterified fatty acids). Instead, two types of predictors were considered, EB as an index of the total hepatic inflow of non-esterified fatty acids, and net portal appearance of butyrate (Heitman et al., Reference Heitmann, Dawes and Sensenig1987) or RfOM intake as an index of the major precursors of digestive origin. The net hepatic flux of β-hydroxybutyrate could then be predicted from variations in net portal appearance of butyrate, or RfOM intake, and EB with a good fit (Table 5, Figures 3 and 4) but with a significant physiological status effect on the quadratic variable (EB). When net portal appearance of butyrate was used in the model, its variation accounted for 46% to the explained variance while variation in physiological state and EB2 explained 26% and 17%, respectively, and the interaction 10%. At similar net portal appearance of butyrate (LSMeans effect), the net hepatic release of β-hydroxybutyrate was significantly higher in lactating cows. These animals also had a higher net hepatic flux of glucose and a lower EB. When RfOM intake was used as predictor, variation in EB contributed for 49.7% to the explained variance while RfOM intake for 13.9% and the interaction for 36.4%. Both models had similar RMSE, similar or compatible slopes associated to EB and net portal appearance of butyrate or RfOM intake. Hence, the response in net splanchnic release of β-hydroxybutyrate could be predicted either directly from changes in intake characteristics (RfOM intake and dietary composition (RdNDF/RfOM)) and EB, or by aggregation of the net portal (Loncke et al., Reference Loncke, Ortigues-Marty, Vernet, Lapierre, Sauvant and Nozière2009) and hepatic (Table 5) models. When correcting data for incomplete recovery of para-aminohippuric acid, performed where feasible (in 13 out of the 17 experiments), net hepatic fluxes of β-hydroxybutyrate were not significantly modified (0.285±0.031 and 0.26±0.033 mmol/kg BW per hour for uncorrected and corrected fluxes, respectively) nor any parameter of the model, when compared within the same data set (Table 6).
Within-experiment relationships between energy balance and net hepatic flux (NHF) of β-hydroxybutyrate (BHBA). Values within a same experiment are linked. Open squares represent non-productive adults, shaded squares represent dairy cattle, open triangles represent growing cattle and shaded triangles represent gestating animals.

Adjusted model of the net hepatic flux (NHF) of β-hydroxybutyrate (BHBA). The solid lines represent the predicted values for dairy cattle, the dotted lines represent growing animals and non-productive adults. Symbols represent the values corresponding to the sum of predicted values and residuals. Open squares represent non-productive adults, shaded squares represent dairy cattle, open triangles represent growing cattle and shaded triangles represent gestating animals.

Evaluation of the models by checking absence of systematic bias
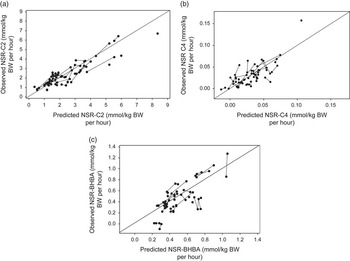
The models predicting the net splanchnic release of acetate were evaluated by comparing reported (Y) against predicted net splanchnic release of acetate (X). When net portal appearance of acetate was used as the predictor, the GLM equation was Y=−0.51+0.38+1.31±0.16 X (RMSE=0.28 mmol/kg BW per hour; R²adj=0.97). When RfOM intake was the predictor, the equation was Y=−0.0003±0.18+1.0002±0.07 X (RMSE=0.21 mmol/kg BW per hour; R²adj=0.95). The slope was significantly higher than one when the net portal appearance of acetate was the predictor, indicating a bias with this model. None of the intercepts were significantly different from 0. The model predicting net hepatic flux of butyrate from net portal appearance of butyrate was similarly evaluated. The equation was Y=−0.0041±0.014+1.011±0.13 X (RMSE=0.016 mmol/kg BW per hour; R²adj=0.95). The intercept was not different from 0 (P=0.77) and the slope not different from one (P=0.78). As for the models of the net hepatic flux of β-hydroxybutyrate, when RfOM intake and EB were used as predictors, the equation was Y=−0.0007±0.0027+1.0008±0.01 X (RMSE=0.039 mmol/kg BW per hour; R²adj=0.96). The intercept was not different from 0 (P=0.98) and the slope not different from one (P=0.67). When net portal appearance of butyrate and EB were the predictors, Y=0.165±0.049+0.366±0.179 X (RMSE=0.062 mmol/kg BW per hour; R²adj=0.83). This model was biased since the slope was different from one (P<0.05) and the intercept different from 0 (P=0.003). Based on these results (Figure 5), three models out of the five presented Table 5 were considered unbiased.
Evaluation of net splanchnic release models using an enlarged data set: within-study relationships between (a) the net splanchnic release of acetate reported (NSR-C2; N=29 experiments; n=70 treatments) and predicted from the rumen-fermented OM intake, (b) the net splanchnic release of butyrate reported (NSR-C4, N=27 experiments; n=63 treatments) and predicted from rumen-fermented OM intake and its concentration in rumen-digestible NDF, and (c) between the net splanchnic release of β-hydroxybutyrate reported (NSR-BHBA, N=26 experiments; n=61 treatments) and predicted from rumen-fermented OM intake and its concentration in rumen-digestible NDF.

Discussion
As indicated above, the prediction models which have been developed are testing the hypotheses that marginal changes in the X variables are inducing marginal changes in the Y variables of interest. Hypotheses on potential predictors were set from knowledge on hepatic metabolism and confirmed by correlation matrices and principal component analysis. Other primary drivers of Y responses may exist. However the available data were not sufficient to test the full range of other hypotheses by meta-analysis.
Domain of application of the models
Prediction models developed by GLM meta-analysis can be applied in a range of inference which corresponds to that of the meta-design. A common feed evaluation system (INRA, 2007) was chosen for all dietary descriptions and all models (Loncke et al., Reference Loncke, Ortigues-Marty, Vernet, Lapierre, Sauvant and Nozière2009). The empirical models presented here apply to a wide range of rations, with intakes up to 41 g DM intake/kg BW per day and concentrate proportions varying from 0 to 100 g/100 g DM. Nevertheless, the majority of the available data related to animals fed at intakes lower than 35 g DM intake/kg BW per day and 70 g concentrate/100 g DM. They do not apply to high-producing dairy females or to feeding strategies based on dry high-concentrate feeds. Models based on dietary characteristics clearly do not apply when feed additives (buffers, essential oils, ionophores, etc.) are added.
The data were balanced between cattle and sheep, and thus the models are applicable to both species (but not to goats). Species and physiological status significantly affected some results of the present work. More than a simple species effect, this is more likely the result of increased levels of fibre in the ovine diets when compared with the bovine. Consequently, there is some confounding between physiological status, species and diets, however classification by physiological status is the most discriminant. For example, part of the effect of physiological status on net hepatic flux of butyrate was likely due to increased percentage of fibre in the diets fed to non-productive adults. Similarly, an effect of physiological status was noted on the net hepatic flux model of β-hydroxybutyrate, comparable with the known flux increase in early lactation or with reduced intake (Heitmann et al., Reference Heitmann, Dawes and Sensenig1987). This effect had not been detected with the descriptive statistics probably because the defined animal classes (imposed by the available data) were insufficient to discriminate between early- and late-lactating cows, or fed and fasted non-productive animals, as reflected by the high standard deviation.
To evaluate the relevance of our GLM models for predictive purposes beyond this range of validity, we compared them with models established with the Mixed procedure of SAS considering random the study effect (Supplementary material S2). Models were not significantly different, except for the prediction of net hepatic fluxes of β-hydroxybutyrate which proved more reliable with the GLM procedure.
Prediction of the net hepatic fluxes of acetate
Present work addresses both the quantitative importance of the net hepatic flux and the response of this flux to changes in input. Descriptive statistics on available data indicate significant net hepatic acetate releases in growing and lactating ruminants. In sheep, endogenous acetate represents 26% of the total entry rate (Pethick et al., Reference Pethick, Lindsay, Barker and Northrop1981), however the significance and regulation of hepatic acetate release in ruminants has remained unclear (Drackley and Andersen, Reference Drackley and Andersen2006). In absence of blood flow correction, our results confirm dietary and endogenous fatty acids could potentially account (on a carbon basis) for net hepatic acetate release. In dairy cows, we calculated that if all absorbed dietary and endogenous fatty acids taken up by the liver were converted into acetate, they would potentially contribute by 32.1±5.04% (range: 12.3% to 61.2%) and 26.4% (range: 18% to 61.4%) respectively, on a carbon basis, to the net hepatic acetate release. This is consistent with the potential contribution of endogenous fatty acids (22% of the non-esterified fatty acids carbons taken up by the liver) in single or twin-pregnant sheep (Freetly and Ferrell, Reference Freetly and Ferrell2000). Hence, in situations of negative EB, non-esterified fatty acids could be the major precursors as suggested by Drackley et al. (Reference Drackley, Veenhuizen, Richard and Young1991). However, our model predicts no significant changes in net release of acetate by the liver when precursor uptake changes as already indicated by Pethick et al. (Reference Pethick, Lindsay, Barker and Northrop1981). It does not confirm the increase in acetate release with long-chain fatty acid supply to the liver predicted by mechanistic models of hepatic metabolism in lactating dairy cows (Hanigan et al., Reference Hanigan, Crompton, Reynolds, Wray-Cahen, Lomax and France2004). The picture is even less clear in growing cattle. A positive relationship was shown between net hepatic flux of acetate and dietary fatty acids, but the slope of the relationship (2.62±0.97) suggested that the amount of carbon supplied by absorbed dietary fatty acids is not sufficient to account for the net acetate release (29.6%±2.6% on average; excluding three treatments with a net hepatic flux of acetate close to zero). If endogenous fatty acids are also considered (with a potential contribution varying from 7.7% to 100% on a carbon basis), the total supply of fatty acid carbons would be sufficient to account for a net hepatic acetate release, except in finishing cattle (n=6 treatments). But in this case, net hepatic flux of acetate was not correlated to the sum of dietary plus endogenous fatty acid uptakes. Other metabolites may significantly contribute to endogenous acetate, but again a non-proportional relationship was suggested.
Conversely, a net uptake of acetate by the liver was noted in non- or low-producing (gestating) animals. The within-study slopes of the net hepatic uptake of acetate v. its net portal appearance significantly decreased when net portal appearance of propionate increased. This suggested that the known in vitro and in vivo inhibition of hepatic acetate uptake by propionate (Rémésy et al., Reference Rémésy, Demigné and Morand1992) has a significant quantitative impact at high levels of net portal appearance of acetate, but not at low levels. This is coherent with Demigné et al. (Reference Demigné, Morand, Levrat and Besson1995) who showed, in isolated rat hepatocytes, that propionate was an effective inhibitor of acetate utilization when its concentration increased.
Present results suggest that part of this debate might be due to methodological biases. When correcting for inaccuracy in blood flow measurement methods (Rodriguez-Lopez et al., Reference Rodriguez-Lopez, Cantalapiedra-Hijar, Durand, Isserty-Thomas and Ortigues-Marty2014) the net release of acetate measured in some experiments tends to decrease. Positive net hepatic flux of acetate may thus have little quantitative significance. Acetate is one of the metabolites most affected by this bias given the very low net hepatic flux of acetate (Rodriguez-Lopez et al., Reference Rodriguez-Lopez, Cantalapiedra-Hijar, Durand, Isserty-Thomas and Ortigues-Marty2014).
Prediction of the net hepatic fluxes of butyrate
The prediction of net hepatic flux of butyrate was relatively straightforward and correcting for incomplete para-aminohippuric acid recovery had no impact on hepatic butyrate extraction or on its prediction model, probably because the fractional hepatic extraction rate was high. Changes in net hepatic flux of butyrate could be significantly predicted from changes in its net portal appearance. The intercept (not different from zero) is consistent with the lack of hepatic uptake of butyrate in absence of net portal appearance and with the inability of the liver to synthesize butyrate. The general slope of the model suggested that 75% of the increment of butyrate appearing in the portal vein is taken up by the liver. This is slightly lower than the first-pass hepatic removal of butyrate (over 80%) measured by Bergman and Wolff (Reference Bergman and Wolff1971), probably because of the inclusion of growing animals in our study. For these animals, the slope indicated that only 49% of the increment in net portal appearance of butyrate is taken up by the liver. It is unlikely that the hepatic butyrate uptake capacity of growing animals was saturated since the net portal appearance of butyrate recorded in the eligible data set was below 200 mmol/h (Krehbiel et al., Reference Krehbiel, Harmon and Schnieder1992). Other regulations might be at play. Insulin is known to reduce hepatic ketogenesis (Brockman and Laarveld, Reference Brockman and Laarveld1985), possibly from butyrate (Brockman, Reference Brockman1990). In the present data set, arterial insulin and glucose concentrations were significantly greater in growing animals (Table 2), indicative of insulin resistance (Janes et al., Reference Janes, Weekes and Armstrong1985). Whether the higher insulinemia noted in growing animals could limit net hepatic butyrate uptake is a hypothesis which would need to be tested. More generally, however, it was difficult with the available data set to dissociate the strict influence of physiological status from that of other factors, among which the level of net portal appearance of butyrate. Additional analyses (not shown) indicated a tendency for a higher slope of butyrate uptake at higher net portal appearance of butyrate across all physiological states, in line with results by Kristensen and Harmon (Reference Kristensen and Harmon2004) following ruminal infusion of volatile fatty acids. But the within-study variability at high net portal appearance of butyrate levels was high and no significant curvilinear relationship was obtained.
Prediction of the net hepatic fluxes of β-hydroxybutyrate
Net hepatic flux of β-hydroxybutyrate was not correlated to its net portal appearance, as expected from the liver’s inability to metabolize β-hydroxybutyrate (Nielsen and Fleischer, Reference Nielsen and Fleischer1969). Furthermore, the net portal appearance of β-hydroxybutyrate levels reported in the available data set is too low to have inhibiting effects on hepatic ketogenesis (Heitmann et al., Reference Heitmann, Sensenig, Reynolds, Fernandez and Dawes1986). The proposed model is based on gross and pragmatic predictors reflecting dietary characteristics and endogenous precursor supply, using RfOM intake (which reflects in particular net portal appearance of butyrate) and EB as predictors. Although based on calculated RfOM and EB values which increase the final prediction error, this model is compatible with feed evaluation systems. EB reflects the balance between nutrient requirements and supply (mostly ‘pull’ type regulations) while RfOM intake reflects nutrient supply (push). This quadratic model has two distinct areas. The first area applies to animals in positive EB, that is growing/finishing animals, non-productive adults, and mid- or late- lactation cows. It indicates that net hepatic release of β-hydroxybutyrate is tightly regulated by the dietary supply of precursors to the liver. In this case, β-hydroxybutyrate is synthesized in the liver from butyrate and to a lesser extent from acetate (Heitman et al., Reference Heitmann, Dawes and Sensenig1987). Both net portal appearance of butyrate and acetate are predicted from RfOM intake, which expresses intake and dietary composition (Loncke et al., Reference Loncke, Ortigues-Marty, Vernet, Lapierre, Sauvant and Nozière2009). Rumen-fermentable OM intake is thus fully relevant as a predictor of net hepatic flux of β-hydroxybutyrate in animals presenting a positive EB. The second area applies to animals in negative EB, that is lactating cows in early lactation and fasting non-productive adults. It identifies body fat mobilization as the most important predictor of β-hydroxybutyrate. In these conditions, non-esterified fatty acids are the major precursors of hepatic β-hydroxybutyrate. The range of inference of the model corresponds to animals that are below the sub-clinical threshold for ketosis since arterial hydroxybutyrate concentrations were always (except for one treatment) below 1.2 mM (Enjalbert et al., Reference Enjalbert, Nicot, Bayourthe and Moncoulon2001). It is likely that in the present data set the supply of glucogenic precursors was not limiting as it did not affect any parameters of the model. The model obtained aligns perfectly with physiological knowledge, and was not affected by corrections for incomplete para-aminohippuric acid recovery.
An original feature of this model is the significant effect of physiological state on the quadratic variable EB. This suggested that in fat-mobilizing animals (either lactating cows or fasting animals), fatty acids are not used to the same extent for ketogenesis. For the same negative EB per unit of BW, dairy cattle produce more β-hydroxybutyrate than fasting animals. It cannot be excluded that this reflects differences in body fat mobilization at similar EB which were not correctly predicted from our calculations. It is difficult to evaluate whether differences in hormonal status between the two groups modified circulating non-esterified fatty acids levels at the same negative EB with the available data set. Insulin reduces hepatic ketogenesis (Brockman and Laarveld, Reference Brockman and Laarveld1985), but in the present data set lactating cows had similar insulinemia to fasting non-productive animals. No data were available on growth hormone, which increases lipolysis and thus fat mobilization (Bocquier et al., Reference Bocquier, Sala and Chilliard1992), and is found at reduced levels in fasting animals. Negative feedback mechanisms mediated by non-esterified fatty acids and ketone body concentrations may occur during fasting as they increase re-esterification of excess fatty acids (Casanova et al., Reference Casanova, Alonso and Moreno1990), but not in lactating animals due to the fact that non-esterified fatty acids are highly used by the mammary gland (Chilliard et al., Reference Chilliard, Audigier, Durand, Auboiron and Bauchart1994). Finally, it should be pointed out that gestation could not be integrated in the model due to insufficient data.
Prediction of the net splanchnic fluxes of ketogenic nutrients
Present results provide tools to predict the net splanchnic release of ketogenic nutrients. Acetate was the only ketogenic nutrient for which the net splanchnic flux could be predicted either from net portal appearance of acetate or directly from dietary intake (RfOM intake). The model established from RfOM intake, despite a lower precision (greater RMSE), has the advantage of being unbiased (Figure 5a). The condition of zero net splanchnic release of acetate in the absence of ruminal fermentations was respected (zero intercept). The lack of physiological status effect on the model was probably due to unbalanced data among states. The fact that RdNDF/RfOM (Loncke et al., Reference Loncke, Ortigues-Marty, Vernet, Lapierre, Sauvant and Nozière2009) was not a significant predictor was surprising. This may have resulted from a confounding effect between physiological status, intake level and nature of the diet (both intake levels and RdNDF are consistently greater in productive animals).
For butyrate and β-hydroxybutyrate, net splanchnic release was predicted by combining the net portal appearance models of Loncke et al. (Reference Loncke, Ortigues-Marty, Vernet, Lapierre, Sauvant and Nozière2009) with the present net hepatic fluxes models. For both nutrients, predictions clearly proved to be unbiased (Figures 5b and c). Prediction of net splanchnic flux of β-hydroxybutyrate fits with the mechanistic model developed by Guo et al. (Reference Guo, Peters and Kohn2008) to predict ketosis in dairy cattle. Indeed, ketone body concentrations are dependent on ketogenesis rate from non-esterified fatty acids and butyrate and on the rate of ketone body use. If our model is applicable to a majority of non-pathological situations, it presents the advantage that EB and RfOM intake are easier criteria to use in rationing practices than non-esterified fatty acids concentrations.
Conclusion and perspectives
The models developed here offer good-precision predictions of the net hepatic and splanchnic release of acetate, butyrate and β-hydroxybutyrate in different physiological but non-pathological conditions, including lactation, growth and, to a lesser extent, finishing animals. Predictors are easy to use in rationing tools. This work highlighted the importance of physiological status and EB in predicting splanchnic metabolism. These notions could be linked to hormonal regulations as well as dietary differences between physiological states. Finally, this work confirmed the difficulties encountered in previous models to estimate body fat mobilization and utilization (Guo et al., Reference Guo, Peters and Kohn2008) as explicitly addressed by McNamara and Baldwin (Reference McNamara and Badwin2000).
Acknowledgements
The authors thank INZO and LIMAGRAIN as well as the Association Nationale de la Recherche et de la Technologie for funding this project and Marwa Al-Jammas for her rigorous contribution to data treatment.
Supplementary material
To view supplementary material for this article, please visit http://dx.doi.org/10.1017/S1751731114002638