1. Introduction
Rotation plays an important role in many natural convection systems such as Earth's liquid outer core, convective envelopes of giant planets and rotating stars (Aurnou et al. Reference Aurnou, Calkins, Cheng, Julien, King, Nieves, Soderlund and Stellmach2015; Jones Reference Jones2015). Rotating Rayleigh–Bénard convection (RRBC) provides a canonical model for studying convective dynamics under the influence of rotation (Chandrasekhar Reference Chandrasekhar1961). The RRBC problem has been extensively studied for many decades using theoretical analysis, numerical simulations and laboratory experiments (e.g. see review articles Ecke & Shishkina Reference Ecke and Shishkina2023; Xia et al. Reference Xia, Huang, Xie and Zhang2023). While the RRBC model captures some aspects of the key dynamics of rotating convection in a local region, it is important to consider the effect of spherical geometry for the global dynamics of planetary and stellar interiors.
Theoretical works on spherical rotating convection concentrated on the onset of convection (Chandrasekhar Reference Chandrasekhar1961; Roberts Reference Roberts1968; Busse Reference Busse1970; Zhang Reference Zhang1994; Jones, Soward & Mussa Reference Jones, Soward and Mussa2000; Dormy et al. Reference Dormy, Soward, Jones, Jault and Cardin2004). A few experiments were conducted to model spherical rotating convection using centrifugal gravity (e.g. Busse & Carrigan Reference Busse and Carrigan1976; Cardin & Olson Reference Cardin and Olson1994; Aubert et al. Reference Aubert, Brito, Nataf, Cardin and Masson2001), but it is difficult to explore a wide range of parameter regimes due to practical considerations. The spherical rotating convection in the highly supercritical regime has been mainly studied using direct numerical simulations (e.g. Gilman Reference Gilman1977; Tilgner & Busse Reference Tilgner and Busse1997; Christensen Reference Christensen2002; Gillet & Jones Reference Gillet and Jones2006; Aurnou, Heimpel & Wicht Reference Aurnou, Heimpel and Wicht2007; Yadav et al. Reference Yadav, Gastine, Christensen, Duarte and Reiners2016; Guervilly, Cardin & Schaeffer Reference Guervilly, Cardin and Schaeffer2019). Several scaling laws of rotating convection have been proposed based on heuristic arguments (Stevenson Reference Stevenson1979; Aurnou, Horn & Julien Reference Aurnou, Horn and Julien2020) and tested using numerical models in spherical geometries (Gastine, Wicht & Aubert Reference Gastine, Wicht and Aubert2016; Long et al. Reference Long, Mound, Davies and Tobias2020; Lin & Jackson Reference Lin and Jackson2021). However, most previous simulations set  $Pr$ to unity, which may mask some scaling behaviours depending on
 $Pr$. It is important to consider the
 $Pr$ dependence when extrapolating scaling laws to planetary cores because thermal and compositional diffusivities are different in planetary core conditions (Li et al. Reference Li, Fruehan, Lucas and Belton2000; Labrosse Reference Labrosse2003; Zhang et al. Reference Zhang, Hou, Liu, Zhang, Prakapenka, Greenberg, Fei, Cohen and Lin2020b), corresponding to quite different
 $Pr$ for thermal convection (
 $Pr\sim 0.01$) and compositional convection (
 $Pr\sim 10$). In this study we perform a set of numerical simulations of rotating convection in a spherical shell over a wide range of
 $Pr$ (
 $10^{-2}\le Pr \le 10^2$).
There are two branches of rotating convection near the onset depending on  $Pr$, namely viscous convection and inertial convection (Zhang & Liao Reference Zhang and Liao2017). At large
 $Pr$ (
 $Pr\ge 1$), the onset of convection invokes the viscous force and is in the form of quasi-steady columnar rolls (Busse Reference Busse1970; Jones et al. Reference Jones, Soward and Mussa2000). The critical Rayleigh number for the viscous convection scales as
 $Ra_c \sim E^{-4/3}$, and the azimuthal wavenumber of the onset (ON) mode
 $m_c\sim E^{-1/3}$, where
 $E$ is the Ekman number. At low
 $Pr$ (
 $Pr \ll 1$), the onset of convection invokes the inertial term and is in the form of oscillatory inertial modes (Zhang Reference Zhang1994). The critical Rayleigh number for the inertial convection scales as
 $Ra_c \sim E^{-1/2}$ and the azimuthal wavenumber of the ON mode
 $m_c\sim O(1)$ (Zhang & Liao Reference Zhang and Liao2017). Of course, there always exists a transition from viscous convection to inertial convection depending on
 $E$ and
 $Pr$, where the onset is characterised by spiralling columnar convection (Zhang Reference Zhang1992). More recently, it has been found that the subcritical convection can occur at low
 $Pr$ (Guervilly & Cardin Reference Guervilly and Cardin2016; Kaplan et al. Reference Kaplan, Schaeffer, Vidal and Cardin2017). These findings highlighted the significant role of
 $Pr$ in rotating convection near the onset.
In the highly supercritical regime, the rigorous theoretical analysis is not tractable. Nevertheless, some scaling laws regarding the heat transfer efficiency, the typical convective flow speed and length scale have been proposed relying on heuristic arguments and force balances (Stevenson Reference Stevenson1979; Aubert et al. Reference Aubert, Brito, Nataf, Cardin and Masson2001; Gillet & Jones Reference Gillet and Jones2006; Barker, Dempsey & Lithwick Reference Barker, Dempsey and Lithwick2014; Aurnou et al. Reference Aurnou, Horn and Julien2020). For rotating turbulent convection, which is the most relevant regime to the planetary core dynamics, the so-called diffusion-free scalings or inertial scalings have been widely used to compare experimental and numerical results (Cheng et al. Reference Cheng, Aurnou, Julien and Kunnen2018; Hawkins et al. Reference Hawkins, Cheng, Abbate, Pilegard, Stellmach, Julien and Aurnou2023). The diffusion-free scalings were derived using various approaches in the literature, but these scalings are essentially based on the Coriolis-inertial-Archimedean (CIA) force balance and incorporated with the mixing length theory, leading to scalings independent of the fluid viscosity and thermal diffusivity (Stevenson Reference Stevenson1979; Julien et al. Reference Julien, Knobloch, Rubio and Vasil2012; Jones Reference Jones2015). The diffusion-free scalings predict the heat transfer efficiency measured by the Nusselt number  $Nu\sim Ra^{3/2}E^2 Pr^{-1/2}$, and the convective flow speed measured by the non-zonal Reynolds number
 $Re_{non} \sim (Ra_{Q}Pr^{-2}E^{1/2})^{2/5}$, where
 $Ra_Q$ is the flux-based Rayleigh number
 $Ra_{Q}=(Nu-1)Ra$. These scalings exhibit
 $Pr$ dependence, but most previous numerical studies mainly considered the dependence on
 $Ra$ and
 $E$. These scalings were tested using direct numerical simulations over a wide range of
 $Ra$ and
 $E$ in rotating spherical shells with the fixed temperature (Gastine et al. Reference Gastine, Wicht and Aubert2016) and fixed-flux (Long et al. Reference Long, Mound, Davies and Tobias2020) boundary conditions, and in a uniformly heated full sphere (Lin & Jackson Reference Lin and Jackson2021). More recently, Wang et al. (Reference Wang, Santelli, Lohse, Verzicco and Stevens2021), Gastine & Aurnou (Reference Gastine and Aurnou2023) examined the latitudinal dependence of the heat transfer in rotating spherical shells. Gastine & Aurnou (Reference Gastine and Aurnou2023) found that the heat transfer scaling in the polar region is steeper than the diffusion-free scaling, whereas the scaling in the equatorial region is less steep than the diffusion-free scaling. Wang et al. (Reference Wang, Santelli, Lohse, Verzicco and Stevens2021) showed that the diffusion-free scalings may be valid in the mid-latitude flow region. Note that some recent studies in cylindrical domains also reveal that the heat transfer scaling has a radius dependence due to the difference between bulk convective flow and sidewall dynamics (de Wit et al. Reference de Wit, Aguirre Guzmán, Madonia, Cheng, Clercx and Kunnen2020; Zhang et al. Reference Zhang, Van Gils, Horn, Wedi, Zwirner, Ahlers, Ecke, Weiss, Bodenschatz and Shishkina2020a; Zhang, Ecke & Shishkina Reference Zhang, Ecke and Shishkina2021). Most of these numerical simulations adopt
 $Pr=1$, which corresponds to a special parameter space as we shall show in this study.
Previous studies on the  $Pr$ effects in Rayleigh–Bénard convection have shown different scaling behaviours depending on
 $Pr$. Verzicco & Camussi (Reference Verzicco and Camussi1999) investigated
 $Nu$ as a function of
 $Pr$ within the interval of
 $[0.0022, 15]$ using direct numerical simulations and found that
 $Nu \sim Pr^{0.14}$ for
 $Pr \le 0.35$, whereas
 $Nu$ is almost independent of
 $Pr$ for
 $Pr>0.35$. Other studies in different
 $Pr$ intervals have shown similar behaviours (e.g. Kerr & Herring Reference Kerr and Herring2000; Silano, Sreenivasan & Verzicco Reference Silano, Sreenivasan and Verzicco2010; Li et al. Reference Li, He, Tian, Hao and Huang2021). In RRBC, Zhong et al. (Reference Zhong, Stevens, Clercx, Verzicco, Lohse and Ahlers2009) found the heat transfer behaviour for small
 $Pr\le 0.7$ differs from moderate
 $Pr$. King & Aurnou (Reference King and Aurnou2013) also found that the transition from rotating to non-rotating convection of liquid metal substantially differs from that of water. More recently, Abbate & Aurnou (Reference Abbate and Aurnou2023) carried out a suite of RRBC experiments in moderate to high
 $Pr$ fluids, which showed that the bulk interior flows can be described by the CIA force balance, but the heat transfer is controlled by the boundary layers, similar behaviours were also found in plane layers (Oliver et al. Reference Oliver, Jacobi, Julien and Calkins2023). The effects of
 $Pr$ in spherical rotating convection have been considered experimentally (Aubert et al. Reference Aubert, Brito, Nataf, Cardin and Masson2001) and numerically (Tilgner & Busse Reference Tilgner and Busse1997; Christensen Reference Christensen2002; Gillet & Jones Reference Gillet and Jones2006). They found that small
 $Pr<1$ tends to reduce the heat transfer and promote zonal flows. In particular, Gillet & Jones (Reference Gillet and Jones2006) noticed that the diffusion-free scaling does not represent the
 $Pr$ dependence. These studies pointed out that the value of
 $Pr$ plays an important role in spherical rotating convection not only in the ON regime but also in the highly supercritical regime.
In this study we build more than 200 numerical models over a wide range of  $Pr$ (
 $10^{-2}\le Pr \le 10^2$) to investigate the influence of
 $Pr$ on the rotating convection in a spherical shell. We show that the diffusion-free scaling for the heat transfer roughly fits the numerical results with
 $Pr\le 1$ but has problems to reconcile numerical models with
 $Pr > 1$ in the geostrophic turbulence (GT) regime. On the other hand, the convective flow speeds with different
 $Pr$ in the GT regime roughly follow a unified scaling. We also show that the transition behaviours from rotating to non-rotating convection depend on
 $Pr$ (King & Aurnou Reference King and Aurnou2013). We find that the transition criteria based on heat transfer and flow morphology are different for cases with
 $Pr>1$, in which the heat transfer starts to deviate from the rotating scaling as increasing
 $Ra$, but the flow structures remain geostrophic. These findings are in line with recent laboratory experiments at moderate to high
 $Pr$, which suggested that the interior flows are controlled by the force balance in the bulk but the heat transfer is controlled by the boundary layers (Abbate & Aurnou Reference Abbate and Aurnou2023). On the other hand, our numerical models at low
 $Pr$ suggest that both heat transfer and convective flow speeds are controlled by the dynamics in the bulk.
2. Numerical models
2.1. Governing equations
We consider Boussinesq convection of homogeneous fluid in a spherical shell of inner radius  $r_i$ and outer radius
 $r_o$ that uniformly rotates at
 $\boldsymbol \varOmega =\varOmega \boldsymbol {\hat z}$. Convection is driven by a fixed temperature difference
 $\Delta T=T_{i}-T_{o}$ between the inner and outer boundaries, under the gravity
 $\boldsymbol {g}=-g_o \boldsymbol {r}/r_o$. Using the shell thickness
 $D = r_{o} - r_{i}$ as the length scale,
 $\varOmega ^{-1}$ as the time scale,
 $\Delta T$ as the temperature scale and gravity at the outer boundary
 $g_o$ as the reference value, the dimensionless governing equations can be expressed as
 $$\begin{gather} \frac{\partial \boldsymbol{u}}{\partial t}+ \boldsymbol{u} \boldsymbol{\cdot} \boldsymbol{\nabla} \boldsymbol{u}+2 \widehat{\boldsymbol{z}} \times \boldsymbol{u} =-\boldsymbol{\nabla} P+E \boldsymbol{\nabla}^{2} \boldsymbol{u}+ \frac {RaE^2}{Pr} T \boldsymbol{r}, \end{gather}$$
 $$\begin{gather}\frac{\partial T}{\partial t}+\boldsymbol{u} \boldsymbol{\cdot} \boldsymbol{\nabla} T =\frac{E}{Pr} \boldsymbol{\nabla} ^{2} T, \end{gather}$$
 $$\begin{gather}\boldsymbol{\nabla} \boldsymbol{\cdot} \boldsymbol u=0, \end{gather}$$
where  $\boldsymbol {u}$ is the velocity,
 $P$ is the reduced pressure and
 $T$ is the temperature. The system is defined by three dimensionless control parameters, the Ekman number
 $E$, the Rayleigh number
 $Ra$ and the Prandtl number
 $Pr$:
 \begin{equation} E=\frac{\nu}{\varOmega D^2},\quad Ra=\frac{\alpha g_{0}\Delta T D^3}{\nu \kappa}, \quad Pr=\frac{\nu}{\kappa}. \end{equation}
Here  $\nu$ is the kinematic viscosity,
 $\kappa$ is the thermal diffusivity and
 $\alpha$ is the thermal expansion coefficient. The rotational modified Rayleigh number
 $Ra^*$ is often used in the rotating convection and
 $Ra^*$ is also the squared convective Rossby number, which is used in many rotating convection studies (e.g. Gilman Reference Gilman1977; Gastine et al. Reference Gastine, Yadav, Morin, Reiners and Wicht2013). We have
 \begin{equation} Ra^*=\frac{\alpha_{T} g_{0}\Delta T}{\varOmega^2 D}=\frac{RaE^2}{Pr}={Ro_c}^2, \end{equation}
which provides a clear relationship between thermal buoyancy and the Coriolis force in rotating convection.
In this study we fix the radius ratio of the shell  $\eta =r_i/r_o=0.35$. Both boundaries are impermeable, no-slip and held at constant temperatures.
2.2. Numerical technique
We use the open-source code XSHELLS (https://www.bitbucket.org/nschaeff/xshells/) to solve the governing equations (2.1)–(2.3) subjected to the boundary conditions. The fluid is assumed to be incompressible, and the velocity  $\boldsymbol u$ can be decomposed into toroidal and poloidal components:
 \begin{equation} \boldsymbol u=\boldsymbol{\nabla} \times(\mathcal{T} \boldsymbol r)+\boldsymbol{\nabla} \times \boldsymbol{\nabla} \times(\mathcal{P} \boldsymbol r). \end{equation}
The toroidal  $\mathcal {T}$ and poloidal
 $\mathcal {P}$ scalar fields and the temperature field
 $T$ are expanded in terms of spherical harmonic expansion on spherical surfaces. The code XSHELLS uses a second-order finite differences method in the radial direction and pseudo-spectral spherical harmonic expansion. The spectral expansion is truncated up to spherical harmonics of degree
 $L_{max}$ and
 $Nr$ denotes the number of radial gird points. The time-stepping scheme is second order, and treats the diffusive terms implicitly, while the nonlinear and Coriolis terms are handled explicitly. This code also uses the SHTns library to speed up the spherical harmonic transformations (Schaeffer Reference Schaeffer2013).
2.3. Diagnostics
We analyse several diagnostics properties to quantify the influence of different control parameters on heat and momentum transports. We adopt several notations regarding averaging procedures. Overbars  ${\overline {\cdots }}$ correspond to temporal averaging, angular brackets
 $\langle \cdots \rangle$ to spatial averaging over the entire spherical shell volume and
 $\langle \cdots \rangle _s$ to an average over a spherical surface:
 \begin{align} \bar{f}=\frac{1}{\tau} \int_{t_{0}}^{t_{0}+\tau}f\, \mathrm{d}t, \quad \langle \,f\rangle=\frac{1}{V} \int_{V} f(r, \theta, \phi) \,\mathrm{d} V, \quad \langle \,f\rangle_s=\frac{1}{4 {\rm \pi}} \int_{0}^{2 {\rm \pi}} \int_{0}^{\rm \pi} f(r, \theta, \phi) \sin \theta\, \mathrm{d} \theta \,\mathrm{d} \phi, \end{align}
where  $\tau$ is the time averaging interval,
 $V$ is the volume of the spherical shell,
 $r$ is the radius,
 $\theta$ is the colatitude and
 $\phi$ is the longitude.
The Nusselt number  $Nu$ denotes heat transport, the ratio of the total heat flux to the conduction heat flux. In spherical shells the conductive temperature profile
 $T_{c}$ is the solution of
 \begin{equation} \frac{\mathrm{d} T_{c}}{\mathrm{d} r} =-\frac{r_{i}r_{o}}{r^2}, \quad T_{c}(r_{i}) = 1, \quad T_{c}(r_{o}) = 0. \end{equation}
Following Gastine, Wicht & Aurnou (Reference Gastine, Wicht and Aurnou2015) yields
 \begin{equation} T_{c}(r)=\frac{\eta}{(1-\eta)^2}\frac{1}{r}-\frac{\eta}{1-\eta},\end{equation}
where  $\eta =r_{i}/r_{o}$ is the radius ratio. The notation
 $\vartheta$ is introduced to define the time and horizontally averaged radial dimensionless temperature profile
 \begin{equation} \vartheta(r)=\overline{\langle T\rangle_s}.\end{equation}
Then the Nusselt number is
 \begin{equation} Nu=-\eta\frac{\mathrm{d}\vartheta}{\mathrm{d}r}(r=r_{i}) =-\frac{1}{\eta}\frac{\mathrm{d}\vartheta}{\mathrm{d}r}(r=r_{o}).\end{equation}
Here we only consider the global averaged  $Nu$, but the efficiency of convective heat transfer slightly varies as latitude in rotating convection (Wang et al. Reference Wang, Santelli, Lohse, Verzicco and Stevens2021; Gastine & Aurnou Reference Gastine and Aurnou2023). The total kinetic energy is given by
 \begin{equation} E_{k}=\frac{1}{2} \int_{v} u^2 \,\mathrm{d}V=\sum_{l = 1}^{l_{max}} \sum_{m = 0}^{l} \mathcal{E}_{l}^{m}(t), \end{equation}
where  $\mathcal {E}_{l}^{m}$ is the dimensionless kinetic energy at a spherical harmonic degree
 $l$ and order
 $m$. The total kinetic energy can be decomposed into zonal and non-zonal parts:
 \begin{equation} E_{zon}=\frac{1}{2} \int_{v}{(u_{\phi}^{0})}^2 \mathrm{d}V, \quad E_{non}=E_{k}-E_{zon}.\end{equation}
We define the Rossby number as
 \begin{equation} Ro=\frac{U_{rms}}{\varOmega D},\end{equation}
where  $U_{rms}$ is the dimensional root-mean-square velocity. Based on the non-dimensionalisation we used, the Rossby number can be determined through kinetic energy as
 \begin{equation} Ro=\sqrt{\frac{2E_{k}}{V}}.\end{equation}
Accordingly, we have the non-zonal Rossby number
 \begin{equation} Ro_{non}=\sqrt{\frac{2E_{non}}{V}},\end{equation}
and the zonal Rossby number is
 \begin{equation} Ro_{zon}=\sqrt{\frac{2E_{zon}}{V}}.\end{equation}
We also define the local Rossby number  $Ro_{\ell }$ as
 \begin{equation} Ro_{\ell}=\frac{U_{rms}}{\varOmega \ell}=Ro\frac{D}{\ell},\end{equation}
where  $\ell$ is the typical flow length scale and is determined from the time-averaged kinetic energy spectrum following Christensen & Aubert (Reference Christensen and Aubert2006),
 \begin{equation} \ell^{-1} = \overline{\left(\frac{\displaystyle D \sum_{l = 1}^{l_{max }} \sum_{m = 0}^{l} l \mathcal{E}_{l}^{m}(t)}{\displaystyle {\rm \pi}\sum_{l = 1}^{l_{max }} \sum_{m = 0}^{l} \mathcal{E}_{l}^{m}(t)}\right)}. \end{equation}
In rotating spherical shell convection the zonal flow component does not contribute to the heat transport from the inner to the outer shell, so we focus on the non-zonal component and it can be determined through the non-zonal Rossby number as
 \begin{equation} Re_{non}=\frac{Ro_{non}}{E},\end{equation}
and the zonal Reynolds number is
 \begin{equation} Re_{zon}=\frac{Ro_{zon}}{E}.\end{equation}
3. Numerical results
3.1. Overview
We have simulated a total of 211 cases in the parameter space of  $1.79\times 10^{5} \le Ra \le 5\times 10^{9}$,
 $1\times 10^{-6} \le E \le 1\times 10^{-4}$ and
 $0.01 \le Pr \le 100$. Details of input and diagnostic parameters for all models are listed in table 1 in Appendix A. Figure 1 shows
 $Nu-1$ as a function of
 $Ra$ for all the numerical models. We use different colours and shapes to distinguish different values of
 $Pr$ and
 $E$, respectively. Broadly speaking, the (
 $Nu-1, Ra$) diagram shows that
 $Nu$ is insensitive to
 $Pr$ when
 $Pr \ge 1$ (black, blue and green symbols) but highly dependent on
 $Pr$ when
 $Pr < 1$ (orange and red symbols). This is in line with previous studies on the
 $Pr$ effects in Rayleigh–Bénard convection (Verzicco & Camussi Reference Verzicco and Camussi1999), and suggests that we need to consider different scaling behaviours for small
 $Pr$ and large
 $Pr$.
Regime diagram of all numerical models in the parameter space  $(Nu-1, Ra)$. Different colours and shapes correspond to different
 $Pr$ and
 $E$. Open symbols denote the onset (ON) regime; half-filled symbols denote the multiple modes (MM) regime; filled symbols denote the geostrophic turbulence (GT) regime; central dot symbols denote the weakly rotating (WR) regime. The dashed line corresponds to the non-rotating scaling
 $(Nu-1)\propto Ra^{1/3}$.

We also see from figure 1 that slopes of  $Nu-1$ change as
 $Ra$ increases because of different convective regimes. Our numerical models can be separated into four different regimes depending on the flow morphology and heat transport efficiency. When the Rayleigh number is slightly above the critical value
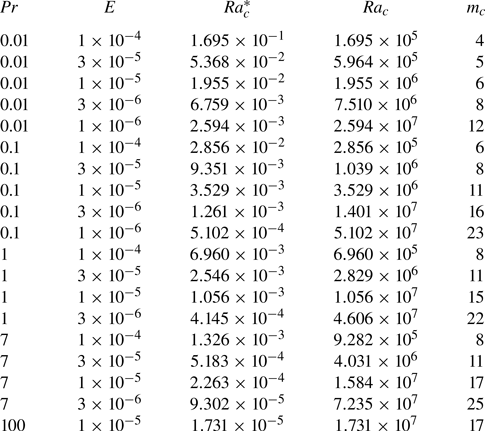
 $Ra_c$, convection is characterised by a single ON mode, which is referred to as the ON regime (open symbols in figure 1). The critical
 $Ra_c$ and the structure of the ON mode depend on
 $E$ and
 $Pr$ (see table 2 in Appendix B). In the ON regime, weak convection has little contribution to the heat transfer, so we can see that
 $(Nu-1)\ll 1$ but increases steeply as a function of
 $Ra$. As we increase
 $Ra$, the convective flow remains laminar, but several convective modes can coexist, which is referred to as the multiple modes (MM) regime (half-filled symbols in figure 1). In the MM regime the Nusselt number remains small, i.e.
 $(Nu-1)<1$, meaning that heat is mainly transferred by conduction. Further increasing
 $Ra$, convection becomes more complex and even turbulent but exhibits columnar structures along the rotation axis, which is referred to as the GT regime (filled symbols in figure 1). As the transition from laminar to turbulent flow is not always well defined, it is not straightforward to define the boundary between the MM and GT regimes. There exists sudden jumps of
 $Nu-1$ as increasing
 $Ra$ for
 $Pr<1$ cases (see red and orange symbols in figure 1), so we define such jumps as the boundary between the MM and GT regimes when
 $Pr<1$. However,
 $Nu-1$ smoothly increases as
 $Ra$ increases when
 $Pr\ge 1$, so we simply define
 $Nu>2$ as the criterion to enter the GT regime for
 $Pr\ge 1$ cases following Gastine et al. (Reference Gastine, Wicht and Aubert2016). This criterion amounts to saying that the heat transported by convection overtakes the conductive heat transfer. When
 $Ra$ is sufficiently large for fixed
 $E$ and
 $Pr$, convection becomes less geostrophic by breaking the rotational constraint and eventually approaches non-rotating convection. Again it is not straightforward to define the transition from rotating to non-rotating turbulence. Some scalings and criteria have been proposed to characterise the transition from rotating to non-rotating convection (Julien et al. Reference Julien, Knobloch, Rubio and Vasil2012; Gastine et al. Reference Gastine, Wicht and Aubert2016; Long et al. Reference Long, Mound, Davies and Tobias2020), but it is difficult to reconcile numerical simulations with different
 $Pr$ as we shall show. Here we simply use the local Rossby number
 $Ro_\ell >0.1$ as the criterion for the weakly rotating (WR) regime (central dot symbols in figure 1). The local Rossby number is the ratio of advection to Coriolis force and
 $Ro_\ell \lesssim 0.1$ is often seen as an indicator of rotating flows (e.g. Davidson Reference Davidson2014). This criterion is a bit subjective but we do see that the columnar structures tend to break when
 $Ro_\ell > 0.1$. We define different flow regimes to facilitate our following discussions, but determining the regime boundaries is not the focus of this study.
Figures 2 and 3 show typical flow structures of four different regimes for cases with  $Pr=7$ and
 $Pr=0.01$, respectively. We have mentioned that the heat transfer exhibits different behaviours between models with
 $Pr\ge 1$ and
 $Pr< 1$. Such differences are also reflected in the flow structures in all regimes. In the ON regime the convective mode at
 $Pr=7$ takes the form of columnar rolls in the vicinity of the tangent cylinder (Dormy et al. Reference Dormy, Soward, Jones, Jault and Cardin2004; Barik et al. Reference Barik, Triana, Calkins, Stanley and Aurnou2023), while the convection at
 $Pr=0.01$ shows spiralling columnar structures that occur in the whole domain outside the tangent cylinder (Zhang Reference Zhang1992). The spiralling structure corresponds to the transitional onset between the viscous convection and inertial convection (Zhang & Liao Reference Zhang and Liao2017). In the MM regime the convective flows are similar to the ON modes but apparently show other unstable modes coexisting. We will show in § 3.3 that the interaction of MM may take place in triadic resonances (Lin Reference Lin2021). In the GT regime, convection flows are chaotic in the equatorial plane but are organized along the rotation axis. The horizontal length scale is dramatically different between cases with
 $Pr=7$ and
 $Pr=0.01$ in the same
 $E$. In the case of
 $E=1\times 10^{-5}$ and
 $Pr=7$, the range of
 $\ell$ is
 $0.064\unicode{x2013}0.089$. However, when
 $Pr=0.01$, the range of
 $\ell$ is
 $0.488\unicode{x2013}0.529$. In the WR regime, columnar convective structures are broken as the rotational constraint becomes less important. Figures 2 and 3 provide an overview of the flow morphology in different regimes. In the following we focus on the scaling behaviours of the heat transfer and typical convective flow speeds in terms of control parameters
 $Ra$,
 $E$ and
 $Pr$.
Contours of velocity magnitude in units of the Rossby number at meridional and equatorial planes, and spherical surfaces showing typical flow structures of four different regimes with  $Pr=7$. The inner (outer) surface corresponds to a spherical surface of radius
 $r_i+0.1D$ (
 $r_o-0.1D$). The colour bar represents Rossby number
 $Ro$. (a) The ON regime; (b) MM regime; (c) GT regime; (d) WR regime.

Same as figure 2 but for cases with  $Pr=0.01$. (a) The ON regime; (b) MM regime; (c) GT regime; (d) WR regime.

3.2. Onset regime
We have shown the flow structures of convection ON modes are different depending on  $Pr$. In this subsection we show scaling behaviours of the heat transfer and convective flow speed near the onset, with particular attention to
 $Pr$ dependence. The critical Rayleigh number
 $Ra_{c}$ and azimuthal wavenumber
 $m_{c}$ of the ON mode are given in table 2 for different
 $E$ and
 $Pr$. It has been show that the convective heat transport increases linearly with
 $Ra/Ra_c$ near the onset (Busse & Or Reference Busse and Or1986; Gillet & Jones Reference Gillet and Jones2006),
 \begin{equation} (Nu-1) \propto \left(\frac{Ra}{Ra_{c}}-1\right).\end{equation}
Figure 4(a) shows  $Nu-1$ as a function of
 $Ra/Ra_{c}-1$ for the cases in the ON regime. We see that
 $Nu-1$ is linearly proportional to
 $Ra/Ra_c-1$ as predicted, but the prefactor of the scaling (3.1) depends on
 $Pr$, which reflects the
 $Pr$ dependence of the convection onset. For numerical models with
 $Pr \ge 1$, the prefactor is similar for different
 $Pr$ but weakly depends on
 $E$, corresponding to the viscous convection mode. At low
 $Pr<1$, the ON modes become spiralling columnar structures that fill the whole domain outside the tangent cylinder (figure 3a), corresponding to the transitional mode between viscous convection and inertial convection (Zhang Reference Zhang1992). As the ON mode and critical
 $Ra_c$ depends on
 $Pr$ in the transitional convection, the prefactor in the scaling (3.1) also highly depends on
 $Pr$ when
 $Pr<1$. Our numerical models do not reach sufficiently low
 $Pr$ to show the purely inertial convection in which the onset of convection is in the form of inertial modes (Zhang Reference Zhang1994).
(a) Nusselt number  $Nu-1$ as a function of
 $Ra/Ra_{c}-1$ in the ON regime; (b)
 $Re_{non}$ as a function of
 $Ra_{Q}Pr^{-2}E^{2/3}$ in the ON regime. Different colours and shapes represent different values of
 $Pr$ and
 $E$.

For the convective flow speed  $Re_{non}$ near the onset, a scaling based on the visco-Archimedean–Coriolis (VAC) force balance has been proposed (Aubert et al. Reference Aubert, Brito, Nataf, Cardin and Masson2001; King & Buffett Reference King and Buffett2013; King, Stellmach & Buffett Reference King, Stellmach and Buffett2013):
 \begin{equation} Re_{non}\sim Ra_{Q}^{1/2}Pr^{-1}E^{1/3}.\end{equation}
Here  $Ra_Q=(Nu-1)Ra$ is the flux-based Rayleigh number. The above VAC scaling can also be derived from the balance between the viscous dissipation rate and work done by the buoyancy force (Gastine et al. Reference Gastine, Wicht and Aubert2016). Figure 4(b) shows
 $Re_{non}$ vs
 $Ra_{Q}Pr^{-2}E^{2/3}$ for all cases near the onset. We can see that numerical results with different
 $Pr$ fit well a unified VAC scaling (3.2). We note that the VAC scaling is given in terms of
 $Ra_Q$ that implicitly carries the
 $Pr$ dependence of
 $Nu$. The VAC scaling has been confirmed by previous numerical simulations at
 $Pr$ around unity (Gastine et al. Reference Gastine, Wicht and Aubert2016; Long et al. Reference Long, Mound, Davies and Tobias2020). At low
 $Pr$ in our numerical model, convection near the onset presumably should be the transitional convection (Zhang Reference Zhang1992), in which the effect of inertial force is gradually becoming apparent. However, the VAC scaling tends to be still valid for our numerical models at low
 $Pr$. This means that the
 $Pr$ we calculated is still not small enough to reach the inertial ON regime where the inertial force plays a dominant role.
In summary for the ON regime, both the heat transfer and typical convective flow speed can be explained by previous theoretical predictions. The prefactor of the heat transfer scaling depends on  $Pr$, which reflects the
 $Pr$ dependence of the convection ON mode.
3.3. Multiple modes regime
As we increase  $Ra$, the convective flow remains laminar but exhibits several mode interactions (figures 2b and 3b). We refer to such flow patterns as the MM regime, which corresponds to a transition from simple convection ON modes to more complex convection modes. As this regime exists only in a narrow parameter range (see figure 1), we do not analyse systematic scaling behaviours but focus on the characteristics of MM interaction in the MM regime.
Previous numerical simulations (Horn & Schmid Reference Horn and Schmid2017; Lam, Kong & Zhang Reference Lam, Kong and Zhang2018) and laboratory experiments (Aurnou et al. Reference Aurnou, Bertin, Grannan, Horn and Vogt2018) using liquid gallium ( $Pr \approx 0.025$) observed multiple mode interactions in rotating convection. More recently, Lin (Reference Lin2021) revealed that the MM interaction take place in the form of triadic resonances in spherical rotating convection at low
 $Pr\le 0.01$. Triadic resonance is a generic instability mechanism in rotating fluids (Kerswell Reference Kerswell2002; Le Bars, Cébron & Le Gal Reference Le Bars, Cébron and Le Gal2015), in which a primary inertial mode with azimuthal wavenumber
 $m_0$ and frequency
 $\omega _0$ can excite a pair of unstable inertial modes with wavenumbers
 $m_1, m_2$ and frequencies
 $\omega _1$,
 $\omega _2$ matching the resonance conditions:
 \begin{equation} \omega_0=\omega_1 \pm \omega_2, \quad m_0=m_1 \pm m_2.\end{equation}
In this study we find that triadic resonances can take place at both small and moderate  $Pr$. Figure 5 shows time-averaged energy spectra (a,c) and time evolution of the kinetic energy contained in the four dominant components (b,d) for two cases with
 $Pr=0.1$ (a,b) and
 $Pr=7$ (c,d). For the case with
 $Pr=0.1$, the four highest peaks in the
 $m$ spectrum correspond to
 $m=11, 0, 9, 2$, respectively. The
 $m=11$ component represents the primary convective mode, while the
 $m=0$ component can be attributed to the mean flow generated by the nonlinear interaction of the primary mode (Zhang & Liao Reference Zhang and Liao2017). As the energy in the primary mode saturated, two other components with
 $m=2$ and
 $m=9$ that satisfy the triadic resonance condition start to exponentially grow and then saturate. This is a typical behaviour of the triadic resonance (Lin Reference Lin2021) and suggests that two secondary modes are excited through the triadic resonance with the primary mode. The case with
 $Pr=7$ in the bottom panel exhibits similar behaviours but with the primary mode of
 $m=12$ and two secondary modes of
 $m=4$ and
 $m=8$. We should note that triadic resonances at moderate
 $Pr$ should be due to nonlinear interactions of three thermal Rossby waves rather than purely inertial waves at very low
 $Pr$ rotating convection (Lin Reference Lin2021) or in the mechanical driven rotating flows (Le Bars et al. Reference Le Bars, Cébron and Le Gal2015).
Energy spectra of two cases in the MM regime with possible triadic resonances. (a,b) The case with  $E=1\times 10^{-5}$,
 $Pr=0.1$ and
 $Ra=5.1\times 10^{6}$; (c,d) the case with
 $E=3\times 10^{-5}$,
 $Pr=7$ and
 $Ra=4.67\times 10^{6}$. (a,c) Time-averaged kinetic energy spectrum as a function of the azimuthal wavenumber
 $m$. (b,d) Time evolution of the kinetic energy contained in different
 $m$ components indicated by circles in the left panel.

Our numerical results, in line with the early work of Lin (Reference Lin2021), suggest that the triadic resonance may provide a generic mechanism of the transition from the single ON mode to MM coexisting in rotating convection with both small and moderate  $Pr$. Further increasing
 $Ra$ would excite more and more unstable modes and eventually lead to turbulent convection that will be discussed in the following subsection.
3.4. Geostrophic turbulence regime
Geostrophic turbulence is thought to be the most relevant regime to convection in rapidly rotating stars and planets. Both the flow morphology and scaling behaviours of heat transfer and momentum transport have been extensively discussed in previous studies (e.g. Aurnou et al. Reference Aurnou, Calkins, Cheng, Julien, King, Nieves, Soderlund and Stellmach2015). In this section we focus on the scaling behaviours of heat transfer  $Nu$ and the convective flow speed
 $Re_{non}$ at different
 $Pr$.
In the GT regime the well-known diffusion-free scalings have been widely discussed and compared with numerical simulations and laboratory experiments (Cheng et al. Reference Cheng, Aurnou, Julien and Kunnen2018; Hawkins et al. Reference Hawkins, Cheng, Abbate, Pilegard, Stellmach, Julien and Aurnou2023). The diffusion-free scalings (also called inertial scalings or CIA scalings) were derived using different approaches and arguments in the literature (e.g. Stevenson Reference Stevenson1979; Aubert et al. Reference Aubert, Brito, Nataf, Cardin and Masson2001; Gillet & Jones Reference Gillet and Jones2006; Julien et al. Reference Julien, Knobloch, Rubio and Vasil2012; Barker et al. Reference Barker, Dempsey and Lithwick2014; Aurnou et al. Reference Aurnou, Horn and Julien2020), which are essentially based on the CIA force balance and the mixing length theory, leading to scalings independent of the fluid viscosity and thermal diffusivity. These scalings predict that the efficiency of convective heat transfer follows
 \begin{equation} (Nu-1)\sim Ra^{3/2}E^{2}Pr^{-1/2},\end{equation}
and the convective flow speeds follow
 \begin{equation} Re_{non}\sim (Ra_{Q}Pr^{-2}E^{1/2})^{2/5},\end{equation}
where  $Ra_Q=(Nu-1)Ra$ is the flux-based Rayleigh number. Previous studies found that the scalings ((3.4) and (3.5)) can fit numerical and experimental data in a certain parameter regime, but most numerical simulations set
 $Pr$ around unity and laboratory experiments usually use water (
 $Pr\approx 7$) as the working fluid (but see other rotating convection experiments with different
 $Pr$, e.g. Aurnou et al. Reference Aurnou, Bertin, Grannan, Horn and Vogt2018; Abbate & Aurnou Reference Abbate and Aurnou2023). Systematic tests of the diffusion-free scalings over a wide range of
 $Pr$ seem to still be lacking. Here we compare the diffusion-free scalings with our numerical models over a wide range of
 $Pr$ (
 $10^{-2}\le Pr \le 10^2$).
Figure 6 shows  $Nu-1$ as a function of the control parameters
 $Ra$,
 $E$ and
 $Pr$ in the GT regime. As already noted from figure 1, a single scaling is not able to reconcile numerical results with different
 $Pr$ because
 $Nu-1$ highly depends on
 $Pr$ when
 $Pr \le 1$ and becomes nearly independent of
 $Pr$ when
 $Pr \ge 1$. Therefore, in figure 6 we plot
 $Nu-1$ separately for cases with
 $Pr \le 1$ and
 $Pr \ge 1$. We can see from figure 6(a) that the diffusion-free scaling (3.4) matches numerical data reasonably well with
 $Pr \le 1$ and
 $(Nu-1)\ge 1$, except for some data points in the left-bottom corner that correspond to cases with
 $(Nu-1)<1$. In these cases, the convective flow becomes chaotic but
 $Nu$ remains small because of efficient thermal conduction at small
 $Pr$. The diffusion-free scaling is expected to be valid in the asymptotic regime of
 $Nu\gg 1$. However, it is a huge numerical challenge to achieve large
 $Nu$ but remain in the GT regime with small
 $Pr$, as this would require reducing
 $E$ and increasing
 $Ra$ meanwhile. So we find that the diffusion-free scaling (3.4) for the convective heat transfer tends to be valid when
 $Pr \le 1$ and
 $(Nu-1)\ge 1$ based on our numerically accessible models.
Nusselt number versus control parameters in the GT regime: (a)  $Nu-1$ as a function of
 $Ra^{3/2} E^2Pr^{-1/2}$ for cases with
 $Pr\le 1$, (b)
 $Nu-1$ as a function of
 $Ra^{3/2} E^2$ for cases with
 $Pr\ge 1$. Different shapes and colours represent different
 $E$ and
 $Pr$ as in figure 1.

As  $Nu$ becomes nearly independent of
 $Pr$ when
 $Pr\ge 1$ (in figure 1), figure 6(b) plots
 $Nu-1$ as a function of
 $Ra^{3/2}E^2$ without
 $Pr$ dependence for cases with
 $Pr\ge 1$ in the GT regime. Here we basically drop the
 $Pr$ dependency and keep the same power law for
 $Ra$ and
 $E$ as in the diffusion-free scaling (3.4) for reference. We can see that
 $Nu-1$ does not show obvious dependence on
 $Pr$ for fixed
 $Ra$ and
 $E$. The almost independence of
 $Nu$ on
 $Pr$ at moderate and large
 $Pr$ is in line with previous studies on non-rotating convection (Verzicco & Camussi Reference Verzicco and Camussi1999; Li et al. Reference Li, He, Tian, Hao and Huang2021). The scattering of data points from the solid line in figure 6(b) is mainly due to different Ekman numbers (different shapes in the plot), suggesting that the power law
 $E^2$ is also not suitable for the
 $E$ dependence. For fixed
 $E$ and
 $Pr$, we see that
 $Nu-1$ is proportional to
 $Ra^{3/2}$ mostly but tends to deviate from the power law
 $Ra^{3/2}$ and approaches the non-rotating power law
 $Ra^{1/3}$ at large
 $Ra$, although the convection remains rotationally dominated based on the criterion of
 $Ro_{\ell } <0.1$. We discuss the transition from rotating turbulent convection to non-rotating convection in § 3.5. In short, figure 6(b) shows that the widely used diffusion-free scaling (3.4) for the convective heat transfer does not fit our numerical models with
 $Pr \ge 1$ in the GT regime, which is also shown by recent laboratory experiments with moderate to high
 $Pr$ (Abbate & Aurnou Reference Abbate and Aurnou2023).
We now turn to examine the scaling behaviour of the convective flow speed measured by the non-zonal Reynolds number  $Re_{non}$. Figures 7(a) and 7(b) show comparisons of
 $Re_{non}$ from numerical models in the GT regime with the VAC scaling and the CIA scaling, respectively. By comparing the results of least-squares fitting, we find that our numerical results more closely collapse on the VAC scaling. However, we note that the flow speed tends to approach the CIA scaling at low
 $Pr$ and large
 $Re_{non}$ (
 $\gtrsim 10^3$). This implies that the viscosity plays a non-negligible role in most of our numerical models. It is interesting that convective velocities roughly follow a unified scaling, despite the very different scaling behaviours for the heat transfer. However, we should mention that both the VAC and CIA scalings are given in terms of the flux-based Rayleigh number
 $Ra_Q=(Nu-1)Ra$, which already takes into account different scaling behaviours of
 $Nu-1$. The scaling behaviour of the convective velocities in our numerical simulations is also in agreement with recent RRBC laboratory experiments at different
 $Pr$ (Abbate & Aurnou Reference Abbate and Aurnou2023).
Non-zonal Reynolds number  $Re_{non}$ versus control parameters in the GT regime: (a)
 $Re_{non}$ as a function of
 $Ra_{Q}Pr^{-2}E^{2/3}$, where the solid black line corresponds to the VAC scaling (3.2); (b)
 $Re_{non}$ as a function of
 $Ra_{Q}Pr^{-2}E^{1/2}$, where the solid black line corresponds to the CIA scaling (3.5). The dashed lines corresponds to the least-square fit to the data.

In summary for the GT regime, both heat transfer and convective velocities asymptotically approach the diffusion-free scalings at low  $Pr\le 1$, suggesting that both the global heat transfer and convective flows are controlled by inviscid dynamics in the bulk. At large
 $Pr>1$, the efficiency of heat transfer becomes nearly independent of
 $Pr$ and approaches the non-rotating scaling at large
 $Ra$, while the convective velocities closely follow the scaling based on the VAC force balance. The scaling behaviours at large
 $Pr$, in line with experimental results of Abbate & Aurnou (Reference Abbate and Aurnou2023), suggest that the heat transfer is controlled by the boundary layers, whereas the typical flow speeds are controlled by the interior force balance in currently accessible numerical models.
3.5. Weakly rotating regime
Further increasing  $Ra$, the convective flows become less geostrophic due to the weakening rotational constraint (figures 2d and 3d). At sufficiently large
 $Ra$, a strong buoyancy force would break rotational constraints and lead to non-rotating convection. However, the transition from rotating to non-rotating convection does not mean an abrupt regime change. It is not straightforward to quantitatively define when the convection is rotationally dominated. The regime changes from rotating to non-rotating convection have been extensively discussed and several transition criteria were proposed and tested (e.g. King et al. Reference King, Stellmach, Noir, Hansen and Aurnou2009; Julien et al. Reference Julien, Knobloch, Rubio and Vasil2012; Gastine et al. Reference Gastine, Wicht and Aubert2016; Long et al. Reference Long, Mound, Davies and Tobias2020), yet no consensus has been reached. As introduced in § 3.1, we use the local Rossby number
 $Ro_{\ell } \le 0.1$ as a tentative criterion for the rotation-dominated convection and, thus, set cases with
 $Ro_{\ell } > 0.1$ as the WR regime. In this section we examine changes of the Nusselt number and local Rossby number as increasing
 $Ra$ from GT to WR regimes. As we shall show the transitional behaviours are rather complicated and it is impractical to define a single transition criteria that can reconcile both the heat transfer and flow morphology with different
 $Pr$.
In order to monitor the behaviour changes of the heat transfer, we define a rescaled Nusselt number  $\widetilde {Nu}$, i.e.
 \begin{equation} \widetilde{Nu} =\left\{ \begin{array}{@{}ll} \dfrac{Nu-1}{Ra^{3/2}E^{2}} & \mathrm{when}\ Pr \ge 1, \\ \dfrac{Nu-1}{Ra^{3/2}E^{2}Pr^{-1/2}} & \mathrm{when}\ Pr \le 1, \end{array} \right. \end{equation}
which takes into account different scalings of  $Nu-1$ at different
 $Pr$ in the GT regime as shown in figure 6. The rescaled
 $\widetilde {Nu}$ should be flat in the rotation-dominated convection and would start to drop as
 $Ra$ increases to the WR regime. The turning point is usually seen as a sign for the transition from rotation to non-rotating convection (Long et al. Reference Long, Mound, Davies and Tobias2020).
Figures 8(a) and 8(b) show the rescaled Nusselt number  $\widetilde {Nu}$ and the local Rossby number
 $Ro_\ell$ as a function of
 $RaE^{8/5}$, which was proposed to be a key control parameter for the transition (Julien et al. Reference Julien, Knobloch, Rubio and Vasil2012). We can see that the heat transfer behaviours indeed change at around
 $RaE^{8/5}\approx 5$ for data points with
 $Pr\ge 1$, but this criteria does not reconcile data points with low
 $Pr$. It is interesting that
 $RaE^{8/5}\approx 5$ also corresponds to
 $Ro_{\ell }\approx 0.1$ at
 $Pr=1$. However, the
 $Ro_{\ell }$ at high
 $Pr$ (blue and black symbols in figure 8b) is still much smaller than 0.1 even when
 $RaE^{8/5}>5$. This means that the convective flow remains quite geostrophic in the bulk but the heat transfer already approaches the non-rotating scaling at high
 $Pr$. Therefore, the transitional criterion based on the heat transfer and based on the flow morphology would be quite different. This again points to the scenario that the heat transfer is controlled by the boundary layers but the convective flows are controlled by the force balance in the bulk.
Rescaled Nusselt number  $\widetilde {Nu}$ and local Rossby number
 $Ro_\ell$ in the GT and WR regimes: (a)
 $\widetilde {Nu}$ and (b)
 $Ro_\ell$ as a function of
 $RaE^{8/5}$; (c)
 $\widetilde {Nu}$ and (d)
 $Ro_\ell$ as a function of
 $RaE^{8/5}Pr^{-4/5}$. Data points with
 $Nu<2$ are excluded in (a) and (c). Symbols have the same definitions as those in figure 1.

Figure 8(b) clearly shows that the  $Ro_{\ell }$ depends on
 $Pr$. By an empirical fitting of data, we find that the
 $Pr$ dependence can be approximated by a power exponent of around 4/5. Therefore, we define a control parameter
 \begin{equation} Ra_G=RaE^{8/5}Pr^{-4/5}, \end{equation}
and plot  $Nu$ and
 $Ro_{\ell }$ as a function of
 $Ra_G$ in figure 8(c,d). Gastine et al. (Reference Gastine, Wicht and Aubert2016) derived a similar control parameter of
 $RaE^{8/5}Pr^{-3/5}$ based on the convective Rossby number
 $Ro_c$ in the boundary layers. Here we find that
 $Ra_G=RaE^{8/5}Pr^{-4/5}$ can better fit our numerical data of the
 $Ro_{\ell }$. Figure 8(d) shows that
 $Ra_G\approx 5$ corresponds to
 $Ro_{\ell }=0.1$ for all different
 $Pr$. We also see from figure 8(c) that
 $Ra_G\approx 5$ corresponds to the turning point of the rescaled Nusselt number
 $\widetilde {Nu}$ for data points with
 $Pr\le 1$. This implies that the transition criteria can be unified for the heat transfer and flow morphology at low
 $Pr$. The control parameter
 $Ra_G$ is not suitable to describe the transition of the heat transfer for the model with
 $Pr>1$ as expected.
Combining the scaling behaviours shown in § 3.4 and the transitional behaviours in this section, we suggest that the heat transfer is controlled by the boundary layers at large  $Pr$ and by the interior dynamics at small
 $Pr$. We should mention that
 $Pr=1$ corresponds to a quite special parameter regime because data points can fit both
 $Pr$-dependent and
 $Pr$-independent scalings. The convective flow velocities and flow morphology are mainly controlled by the force balance in the interior. If we characterise the transition from GT to WR based on the
 $Ro_{\ell }$ in the bulk, we find that
 $Ra_G=RaE^{8/5}Pr^{-4/5}$ provides a unified control parameter for the transition with all different
 $Pr$ based on our numerical data.
3.6. Mean zonal flows
The above analysis has focused on the scaling behaviour of non-zonal flows, which are related to the heat transfer. Mean zonal flows are spontaneously generated in rotating convection systems due to the nonlinear effects (e.g. Christensen Reference Christensen2002; Miyagoshi, Kageyama & Sato Reference Miyagoshi, Kageyama and Sato2010). In this section we show the magnitude of zonal flows and scaling behaviours with different  $Pr$ in the GT regime where the zonal flow may be significant. Previous studies have shown that zonal flows are more readily developed at low Prandtl numbers
 $Pr<1$ (Zhang Reference Zhang1992; Aubert et al. Reference Aubert, Brito, Nataf, Cardin and Masson2001). The zonal flow amplitude is measured by the zonal Reynolds number
 $Re_{zon}$ as defined in § 2.3. Figure 9(a) shows the ratio of
 $Re_{zon}/Re_{non}$ as a function of
 $Ra$ with different
 $E$ and
 $Pr$ in the GT regime. We can see that the ratio is around or larger than unity for most cases at
 $Pr<1$, suggesting strong zonal flows are generated at low Prandtl numbers. In contrast, most of the cases show the ratio
 $Re_{zon}/Re_{non} <1$ when
 $Pr >1$. These results are in line with previous numerical and experimental studies on zonal flows driven by rotating convection (Aubert et al. Reference Aubert, Brito, Nataf, Cardin and Masson2001; Christensen Reference Christensen2002). It is also found that as
 $Ra$ increases,
 $Re_{zon}/Re_{non}$ in both
 $Pr=1$ and
 $Pr = 7$ cases shows a significant increase, especially at relatively low Ekman number
 $E=3 \times 10^{-6}$. This demonstrates that at sufficiently small
 $E$ and large
 $Ra$, the zonal flows can become dominant over the non-zonal flows even at high
 $Pr$. However, within the parameter interval we calculated, dominant zonal flows are more likely to be generated at low
 $Pr$.
(a) Reynolds number ratio  $Re_{zon}/Re_{non}$ as a function of
 $Ra$ in the GT regime; (b)
 $Re_{zon}$ as a function of
 $Ra^{1.29}E^{1.15}Pr^{-1.42}$ in the GT regime. Symbols have the same definitions as those in figure 1.

It is of great interest to see if there is any systematic dependence of the zonal flows on the control parameters. As there is no existing theoretical prediction on scaling of zonal flows in rotating turbulent convection, we made a least-square fitting of  $Re_{zon}$ in the form of the power law in control parameters from numerical data with
 $Re_{zon} \ge 100$. As shown in figure 9(b), the power law scaling
 $Re_{zon} \sim Ra^{1.29}E^{1.1}Pr^{-1.42}$ (solid black line) can well describe the data. It is found that the zonal flow strength is stronger for
 $Pr \le 1$ and, for
 $Pr \ge 1$, the
 $Re_{zon}$ hardly exceeds 100 in our simulation interval. The scaling of
 $Pr^{-1.42}$ demonstrates that the strong zonal flow is more likely to be generated at
 $Pr \le 1$ with fixed
 $Ra$ and
 $E$. For
 $Pr \ge 1$, the strong zonal flow can also be generated by increasing
 $Ra$ with fixed
 $E$.
4. Conclusions and outlooks
In this study we have constructed more than 200 numerical models of rotating convection in a spherical shell over a wide range of  $Pr$ from
 $10^{-2}$ to
 $10^{2}$, which provide a valuable dataset to investigate the scaling behaviours of rotating convection. Our numerical models are separated into four different flow regimes, namely near the onset, MM interactions, GT and WR regimes. We investigated the scaling behaviours of the heat transfer and convective flow velocities in different flow regimes, with particular attention to the dependence on the
 $Pr$.
Near the ON regime, the convective heat transfer is proportional to the supercriticality as predicted but the prefactor depends on the  $Pr$ due to different ON modes. The convective velocities can be well described by the VAC scaling. Multiple mode interactions can be seen as a transitional regime from laminar to turbulent convection. In this regime, we show possible evidences of triadic resonances at both low and high
 $Pr$, suggesting that the triadic resonance is a generic mechanism for the transition to turbulence in rotating convection.
In the GT regime we find that a single scaling cannot reconcile the heat transfer behaviours of numerical models with different  $Pr$. The heat transfer at low
 $Pr$ tends to approach the diffusion-free scaling whereas the Nusselt numbers at high
 $Pr$ become nearly independent of
 $Pr$. However, the convective velocities at different
 $Pr$ roughly follow a unified scaling that is in the VAC force balances, though the scaling tends to approach the CIA force balance at low
 $Pr$ and large
 $Re_{non}$. For the mean zonal flow, we obtain the power law scaling
 $Re_{zon} \sim Ra^{1.29}E^{1.1}Pr^{-1.42}$ by fitting numerical data in the GT regime.
We also find that the transition behaviours from GT to WR regimes are different depending on  $Pr$, as noted in previous experimental studies (King & Aurnou Reference King and Aurnou2013). At high
 $Pr$, the heat transfer already approaches the non-rotating scaling while the convective flows remain rotation-dominated based on the local Rossby number in the bulk. At low
 $Pr$, transitions of the heat transfer and flow morphology take place simultaneously, both of which can be roughly determined by the control parameter
 $Ra_G=RaE^{8/5}Pr^{-4/5}$ according to the empirical fitting of numerical data. In fact, we show that
 $Ra_G\approx 5$ provides a unified transition criterion for all different
 $Pr$ if we characterise the transition merely based on the local Rossby number in the bulk.
Both scaling behaviours and transition behaviours suggest that the heat transfer is controlled by the boundary layers whereas the convective flows are controlled by the force balance in the bulk at high  $Pr$ (Abbate & Aurnou Reference Abbate and Aurnou2023; Hawkins et al. Reference Hawkins, Cheng, Abbate, Pilegard, Stellmach, Julien and Aurnou2023). Both numerical and experimental results show the convective velocities are close to the VAC scaling, suggesting that the viscosity still plays a non-negligible role in currently accessible numerical simulations and laboratory experiments. At low
 $Pr$, it is very difficult to achieve large
 $Nu$ while maintaining GT to fully test the diffusion-free scalings. In fact, simulations at both low and high
 $Pr$ pose a huge numerical challenge because of large contrasts of diffusivities. Nevertheless, our numerical models at low
 $Pr$ show the trend to approach the diffusion-free scalings for both the heat transfer and convective velocities, though it requires further confirmation in more extreme parameter regimes.
Finally, it is of great interest to investigate the effect of  $Pr$ on rotating convection in the presence of magnetic fields for planetary core dynamics. Meanwhile, spherical shell rotating convection is latitudinally dependent, as reported by Wang et al. (Reference Wang, Santelli, Lohse, Verzicco and Stevens2021), Gastine & Aurnou (Reference Gastine and Aurnou2023). In this study we considered only the global averaged scalings that represent the overall dynamics in the system. It would be interesting to explore the scaling of different latitudes under different
 $Pr$ to complement our study.
Acknowledgements
Numerical simulations made use of the open-source code XSHELLS, which is freely available at https://nschaeff.bitbucket.io/xshells. We thank Nathanaël Schaeffer for his assistance in setting up and running the numerical code. The critical Rayleigh numbers and wavenumbers for the onset of convection were calculated using the open-source code MagIC (https://magic-sph.github.io). We are very grateful to anonymous reviewers for their constructive comments, which have helped improve the paper.
Funding
This study was supported by the National Key R&D Program of China (grant no. 2022YFF0503200), the National Natural Science Foundation of China (12250012, 42142034, 42350002), the B-type Strategic Priority Program of the CAS (XDB41000000) and the Pearl River Program (2019QN01X189). Numerical calculations were performed on the Taiyi cluster supported by the Center for Computational Science and Engineering of Southern University of Science and Technology.
Declaration of interests
The authors report no conflict of interest.
Appendix A. List of numerical simulations
Table 1 lists all of numerical models presented in this study with detailed control parameters, diagnostic parameters and numerical resolutions. We also created an Excel spreadsheet with more comprehensive data, which is made available on Zenodo (https://zenodo.org/records/12696528).
Summary of the control parameters and diagnostic quantities of all numerical models in this study. The columns from left to right indicate the following: the Ekman number  $E$, the modified Rayleigh number
 $Ra^{*}$, the Nusselt number
 $Nu-1$, the non-zonal Reynolds number
 $Re_{non}$, the zonal Reynolds number
 $Re_{zon}$, length scale
 $\ell$, the regime corresponding to the flow state, the grid resolution and spherical harmonics of degree
 $l_{max}$. Zonal Reynolds number and length scale are only given for the cases in GT and WR regimes.

Appendix B. Critical Rayleigh numbers and wavenumbers
Table 2 lists the critical Rayleigh numbers and wavenumbers of the onset of convection used in this study. Critical values are calculated using the linear onset package of the open-source code MagIC (Wicht Reference Wicht2002), which is freely available at https://magic-sph.github.io. We have verified our calculations with previous work. For example, Barik et al. (Reference Barik, Triana, Calkins, Stanley and Aurnou2023) obtained the values  $Ra_c=1.05567 \times 10^7$ and
 $m_c=15$ for
 $E=1 \times 10^{-5}$ and
 $Pr =1$, which is in excellent agreement with our results under the same
 $E$ and
 $Pr$.
Critical modified Rayleigh numbers  $Ra_{c}^{*}$, critical Rayleigh numbers
 $Ra_c$ and critical azimuthal wavenumbers
 $m_{c}$ for different Ekman
 $E$ and Prandtl numbers
 $Pr$ employed here.