Introduction
Human population increase, conversion of natural landscapes, and climate change are resulting in rapid declines of global biodiversity and extensive reshuffling of distribution patterns of species and taxonomic groups in response to shifting niches (Parmesan Reference Parmesan2006). It is increasingly apparent that to improve our understanding of the response of wildlife to global change and to provide innovative and timely mitigation strategies to its challenges, studies must look beyond ‘traditional’ measurements of biodiversity persistence such as individual species, or measures of its richness. Critical insights into managing the persistence of functioning ecosystems and the taxa that drive them are better found in measuring the responses of functional diversity (e.g., Mouchet et al. Reference Mouchet, Villeger, Mason and Mouillot2010; Seymour et al. Reference Seymour, Simmons, Joseph and Slingsby2015; Si et al. Reference Si, Baselga, Leprieur, Song and Ding2016), and phylogenetic diversity (e.g., Frishkoff et al. Reference Frishkoff2014; Monnet et al. Reference Monnet, Jiguet, Meynard, Mouillot, Mouquet, Thuiller and Devictor2014; Sol et al. Reference Sol, Bartomeus, González-Lagos and Pavione2017).
Measurements of phylogenetic diversity describe ancestral relationships of species within a community and the diversity, or divergence from the shared ancestry. Phylogenetic diversity encapsulates resource, structural, habitat, climatic and biogeographic forces responsible for driving the speciation process (Vellend et al. Reference Vellend, Cornwell, Magnuson-Ford, Mooers, Magurran and McGill2011; Tucker et al. Reference Tucker2017; Sol et al. Reference Sol, Bartomeus, González-Lagos and Pavione2017). Documenting phylogenetic diversity for conservation practice allows elucidation of ecosystem functioning and processes by highlighting the commonality and divergence of species’ functional traits within their evolutionary context (Morelli et al. Reference Morelli2016; Sol et al. Reference Sol, Bartomeus, González-Lagos and Pavione2017). Conservation management practises based on narrow sets of functional traits may result in a loss of phylogenetic diversity (Hughes et al. Reference Hughes, Edwards, Sayer, Martin and Thomas2020). Conservation targets informed by phylogenetic diversity may encapsulate a wider range of functional traits by linking evolutionary history to the conservation of feature diversity (i.e., the different evolutionary features of species; Faith Reference Faith1992; Owen et al. Reference Owen, Gumbs, Gray and Faith2019). Conserving distinct evolutionary histories has intrinsic value (Winter et al. Reference Winter, Devictor and Schweiger2013), and conservation of phylogenetically diverse communities is more likely to preserve distinct or relic evolutionary lineages (Jetz et al. Reference Jetz, Thomas, Joy, Redding, Hartmann and Mooers2014). While the value of phylogenetic diversity for biodiversity conservation has been posited (Vane-Wright et al. Reference Vane-Wright1991), the evidence for it having so far benefited practical conservation applications has been questioned (Winter et al. Reference Winter, Devictor and Schweiger2013).
Anthropogenic disturbance, degradation, homogenisation and fragmentation of natural habitats significantly alters the patterning, distribution, abundance and persistence of biodiversity, and particularly, specific functional groups (Díaz and Cabido Reference Díaz and Cabido2001) and phylogenetic clades (He et al. Reference He, Luo, Brown and Lin2018; La Sorte et al. Reference La Sorte2018; McEntee et al. Reference McEntee, Tobias, Sheard and Burleigh2018). For example, increasing urbanisation gradients act as selective filters as they reduce phylogenetic diversity of birds, the evolutionary distinctness of avian communities, and effectively shorten the evolutionary history of the global avian class with urbanised environments by ~450 million years (Sol et al. Reference Sol, Bartomeus, González-Lagos and Pavione2017; La Sorte et al. Reference La Sorte2018). Anthropogenic fragmentation of contiguous habitat patches – the reduction in habitat patch size, structural complexity and connectivity – results in a decline in phylogenetic diversity, as avian communities in smaller and more isolated habitat islands with reduced habitat structural diversity tend to exhibit greater phylogenetic clustering with fewer distinct lineages than those in larger habitat islands with greater connectivity (Si et al. Reference Si, Cadotte, Zeng, Baselga, Zhao, Li, Wu, Wang and Ding2017). Anthropogenically-driven environmental filtering is likely to exert pressure on phylogenetic diversity to the detriment of evolutionary history and phylogenetically distinct taxa (Sol et al. Reference Sol, Bartomeus, González-Lagos and Pavione2017; He et al. Reference He, Luo, Brown and Lin2018).
Close phylogenetic relatedness often results in non-independence of functional trait values among closely related species (i.e., related species resemble each other more than expected from a random sample; Blomberg and Garland Reference Blomberg and Garland2002). Closely related species may share ecological similarities and perform similar ecological functions (i.e. phylogenetic niche conservatism), suggesting that community assembly processes may be understood by analysing community phylogenetic structure and the degree of phylogenetic conservatism of functional traits (Webb et al. Reference Webb, Ackerly, McPeek and Donoghue2002).
Previously, we showed that anthropogenic fragmentation of the critically endangered Indian Ocean Coastal Belt Forest (IOCBF) on the east coast of southern Africa reduces the taxonomic and functional richness of the avian forest community, with the exception of migratory species (Ehlers Smith et al. Reference Ehlers Smith, Si, Ehlers Smith, Kalle, Ramesh and Downs2018a, b). Given the need for more critical analyses of the contribution of phylogenetic diversity to biodiversity conservation, we explored the potential for anthropogenic forest fragmentation to act as a selective filter of avian phylogenetic diversity within the community of forest-dependent birds of the IOCBF. We asked if the addition of phylogenetic diversity metrics to a well-studied system would further elucidate the effects of anthropogenic disturbance to the avian community and therefore benefit its conservation. Our overall hypothesis was that anthropogenic fragmentation would filter evolutionarily conserved traits and select for phylogenetic niche conservatism, i.e., a selective filtration pressure would structure communities of species that shared recent common ancestors in fragmented patches. We predicted that 1) decreasing forest patch size would act as a selective filter and reduce avian phylogenetic diversity; 2) isolation would not act as a selective filter of avian phylogenetic diversity given the high proportion of forest-specialised migrants present in the community; 3) a decrease in forest habitat-structural complexity would provision fewer niches and thus reduce phylogenetic diversity, and therefore 4) phylogenetic structuring of the avian community would vary across the fragmented forest landscape, as decreasing forest patch size and habitat structural complexity would act as a stronger phylogenetic filter than increasing isolation distance.
Methods
Study area
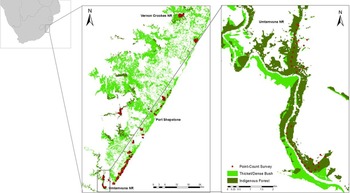
We conducted our research in the central portion of the IOCBF within South Africa, on the south coast of KwaZulu-Natal Province between the Umtamvuna River in the south (31°04046.69″ S, 30°11039.87″ E) and the Mpambanyoni River in the north (30°16017.49″ S, 30°36034.25″ E; Figure 1). The IOCBF exists in a naturally fragmented forest-grassland mosaic with Indigenous Coastal Forest on the lowland plains and Scarp Forest running perpendicular to the coast along river gorges (Low and Rebelo Reference Low and Rebelo1997). However, anthropogenic forest fragmentation and removal have resulted in ~83% reduction of original IOCBF cover (Olivier et al. Reference Olivier, van Aarde and Lombard2013). A third forest subclass exists, currently termed Coastal Thicket/Dense Bush, which likely represents regenerating Coastal Forest (Ehlers Smith et al. Reference Ehlers Smith, Ehlers Smith and Downs2017). The research study area has been extensively described elsewhere (Ehlers Smith et al. Reference Ehlers Smith, Si, Ehlers Smith, Kalle, Ramesh and Downs2018a, b).
Survey region of the Indian Ocean Coastal Belt Forest in KwaZulu-Natal, South Africa, between Umtamvuna River (31°04046.69″ S, 30°11039.87″ E) and Mpambanyoni River (30°16017.49″ S, 30°36034.25″ E).

Survey design, site selection and forest fragmentation metrics
We identified all forest patches in our survey region using the latest landcover map (GeoTerra Image Reference Image2014) in the Geographic Information System (GIS) ArcGIS v10.2 (Environmental Systems Research Institute; ESRI© USA 2011). We remotely assigned stratified survey points weighted to the size of each patch that was accessible either geographically or by permission. We placed a 200 m x 200 m grid over each forest patch and assigned a survey point at the crossing of each grid-axis, which was then projected to a Global Positioning System (GPS, Garmin GPSmap 62; Garmin© USA) to assist in ensuring stratified survey representation in the field. The resultant survey area constituted 119 forest patches, which encompassed the maximum variability in patch-size range (N = 119 patches; patch-size area mean (± SD) 29.1 ± 68.4 ha, range 0.06 – 386.9 ha; explanatory covariate = patch-size effect) and Euclidean isolation distance from the largest “mainland” patch (N = 119 patches; isolation from mainland distance mean (± SD) 2833 ± 2674.7 m, range 0 – 8650 m; explanatory covariate = isolation effect) and across a range of Indigenous Coastal Forest, Coastal Thicket/Dense Bush and Scarp Forest patches (Figure 1). Previously, we showed that decreasing forest habitat structural complexity is driven by the effect of decreasing forest habitat patch size (Ehlers Smith et al. Reference Ehlers Smith, Si, Ehlers Smith, Kalle, Ramesh and Downs2018a). Therefore, we used a metric of forest habitat structural complexity based on a Shannon-Weiner Diversity Index (explanatory covariate = forest-structural complexity effect). This metric was created thus: we recorded the vegetation structure and foliage profile in a 20-m radius of each survey location. Habitat covariates were recorded thus: percentage coverage of bare ground, leaf litter, grass cover, herbaceous cover, saplings and scrub/woody vegetation <2 m, and percentage of scrub/woody vegetation and trees of 2–5, 6–10, 11–15 and 16–20 m heights. We recorded the mean height of all vegetation classes using a telescopic pole equipped with a rule. We recorded the stem density of trees per each height class and stem density of all horizontal and vertical dead trees (Bibby et al. Reference Bibby, Burgess and Hill2000; cf. Ehlers Smith et al. Reference Ehlers Smith, Ehlers Smith, Seymour, Thébault and van Veen2015). We converted mean height scores of each vegetation class into a foliage height diversity index using the Shannon–Weiner diversity index (SWDI) formula thus:
 $$ H\hskip1.5pt =-\sum_{i-1}^s{p}_i\hskip1.5pt \mathrm{ln}({p}_i) $$
where p i is the proportion of the total foliage which lies in the ith layer of the chosen horizontal layers (Bibby et al. Reference Bibby, Burgess and Hill2000). The mean SWDI scores for each survey location were then calculated to provide an average SWDI score per forest habitat patch to provide a measure of forest habitat structural complexity.
Avian point-count surveys
We conducted 100 m fixed-radius point-count surveys of all avian species visible and audible for a duration of 10 min. in the first 3 h after sunrise (Bibby et al. Reference Bibby, Burgess and Hill2000). Surveys were consistently conducted jointly by DES and YES, on dry, wind-still days only, as rain and wind negatively impact avian detectability within forests (Bibby et al. Reference Bibby, Burgess and Hill2000). We counted the number of individuals of a species to provide an abundance estimate, and pooled the total of all species, plus their individual abundances of species per patch. We conducted surveys in the austral breeding season (October 2015 – January 2016). We completed 260 surveys within 119 distinct forest patches (Further information can be found here https://onlinelibrary.wiley.com/action/downloadSupplement?doi=10.1111%2Fjbi.13245&file=jbi13245-sup-0002-AppendixTableS1.docx). No survey points were repeated. Any identification uncertainties were unrecorded and nocturnal birds were not assessed given the timing of the surveys. Species accumulation curves are presented in Supporting Information Appendix S1.
Avian community phylogeny
Upon the first inspection of the avian community phylogeny, Jetz’s phylogeny (Reference Jetz, Thomas, Joy, Hartmann and Mooers2012) provided phylogenetic data for only 64 of the 103 avian species recorded, which we deemed insufficient to provide meaningful insights into the assembly of these communities. We thus constructed a maximum likelihood phylogeny for taxa recorded in the breeding season using data available from the database resource GenBank. We constructed data matrices using two mitochondrial genes (cytochrome oxidase I, COI, and NADH dehydrogenase 2, ND2) and three nuclear markers (beta-fibrinogen, Bfib myoglobin (Mb) and transforming growth factor beta, TGFB). In some cases, sequences were sampled from different species belonging to the same genus or family to obtain a complete sequence for all genes included in the study and to minimise missing data in the DNA supermatrix. Genbank accession numbers for sequences used in the present study are presented in Supporting Information Appendix S2.
The breeding season phylogeny included 99 of the 103 avian taxa recorded; no sequence data for Ceuthmochares aereus, Chrysococcyx caprius, Chrysococcyx cupreus and Turtur tympanistra were available. Sequences from each gene were aligned separately with ClustalW 2.1 (Larkin et al. Reference Larkin, Blackshields, Brown, Chenna, McGettigan, McWilliam, Valentin, Wallace, Wilm, Lopez, Thompson, Gibson and Higgins2007) and were optimised manually to ensure homology using Mesquite 3.6 (Maddison and Maddison Reference Maddison and Maddison2018). We then concatenated individual gene alignments into a final supermatrix 3664 base pairs (bp) in length (COI = 694 bp; Bfib = 636 bp; ND2 = 1022 bp; Mb = 667 bp; TGFB = 645 bp). Branch lengths were calculated using maximum likelihood in Garli 0.951 (Zwickl Reference Zwickl2006). To infer the tree, we conducted a partitioned maximum likelihood analysis, with the optimal substitution model for each gene region estimated using the Akaike information criterion (AIC) in jModelTest 2.1.7 (Darriba et al. Reference Darriba, Taboada, Doallo and Posada2012). We then converted the maximum likelihood tree into an ultrametric rooted phylogeny using the penalised likelihood method in the package ‘ape’ (Paradis and Schliep Reference Paradis and Schliep2019) in the statistical software package R v3.6.1 (R Core Team 2019).
Avian phylogenetic diversity measures
We calculated six measurements of abundance-weighted phylogenetic diversity using the ‘picante’ package (Kembel et al. Reference Kembel, Cowan, Helmus, Cornwell, Morlon, Ackerly, Blomberg and Webb2010) in the statistical programme R v3.6.1 (R Core Team 2019):
-
1) Faith’s Phylogenetic Diversity (PD; Faith Reference Faith1992): the sum of the evolutionary history of the community, denoted in million years;
-
2) the Standardised Effect Size of PD (ses.PD): observed PD was compared to the PD of null communities equalling observed species richness drawn randomly from the gamma species community, as PD and species richness may be positively correlated (Swenson, Reference Swenson2014);
-
3) Mean Pairwise Distance (MPD): the mean pairwise phylogenetic distance separating all combination of species pairs in the gamma species community, including conspecifics, as calculated in a distance matrix;
-
4) the Standardised Effect Size of MPD (ses.MPD): MPD corrected for species richness (using the same method as above), as the two measures may be positively correlated, ranging from low values (recent divergence of species from common ancestors, phylogenetically clustered) to high values (ancient divergence of species from common ancestors, phylogenetically even) (Webb et al. Reference Webb, Ackerly, McPeek and Donoghue2002);
-
5) Mean Nearest Taxon Distance (MNTD): the mean pairwise distance between pairs of the most closely-related non-conspecific individuals;
-
6) the Standardised Effect Size of MNTD (ses.MNTD): MNTD corrected for species richness (as above) as the two measures may be positively correlated, ranging from positive values (closely related individuals in the gamma species community occur less than expected, phylogenetically even) to negative values (closely related individuals in the gamma pool occur more than expected, phylogenetically clustered).
We calculated Standardised Effect Size for the three phylogenetic diversity measures by an independent swap algorithm of 999 null communities, each with 1000 iterations, which constrains species richness per patch and species occurrence across patches, and randomly draws from the gamma species community to compare observed versus expected. The independent swap algorithm was performed in the ‘picante’ package (Kembel et al. Reference Kembel, Cowan, Helmus, Cornwell, Morlon, Ackerly, Blomberg and Webb2010) in R v3.6.1 (R Core Team 2019).
Statistical analyses
We created an abundance/absence matrix based on the pooled number of individuals of each bird species encountered per patch, and a presence/absence matrix based on the pooled presence or absence of each species per patch. The abundance matrix was used to calculate the six phylogenetic diversity metrics (PD, ses.PD, MPD, ses.MPD, MNTD, ses.MNTD). To calculate the influence of our habitat fragmentation metrics, we created a series of linear mixed-effects models (lme), in which the six measures of phylogenetic diversity were separate response covariates upon which the effects of our three retained explanatory covariates (patch-size effect, isolation effect, forest-structural complexity effect) were explored. We included habitat type (Indigenous Coastal Forest, Scarp Forest, Coastal Thicket/Dense Bush) as a random effect. Continuous explanatory variables and response variables that were not Standardised Effect Size-corrected were logged (non-normal distribution: Kolmogorov–Smirnov test, P < 0.001) and a Gaussian error structure was selected. All phylogenetic diversity measures were significantly spatially autocorrelated when tested using Global Moran’s Index in ArcGIS v10.2 (ESRI 2011). We included various spatial correlation structures (i.e., Gaussian, exponential, spherical and ratio) with and without a nugget into the ‘lme’ models that updated the null model, which were then compared with the null model using AIC. The model with the lowest AIC was chosen. Analyses were conducted using package ‘lme4’ (Bates et al. Reference Bates, Machler, Bolker and Walker2015) in R v3.6.1 (R Core Team 2019).
Results
Phylogenetic diversity
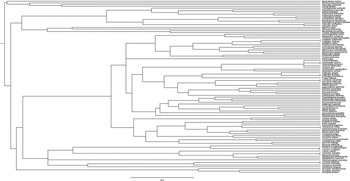
We recorded a total of 103 avian species; 99 were included in the phylogenetic analysis as genetic data were lacking for four species (Figure 2). Species richness per patch ranged from 6 – 59 species. Species richness and PD had a strongly significant positive correlation (Spearman’s rank correlation, r = 0.97, P < 0.000; see Supporting Information Appendix S3). Faith’s phylogenetic diversity ranged from 4.41 – 27.88; sesPD ranged from −2.11 – 2.10. Mean pairwise distance metric ranged from 1.08 – 1.61; sesMPD ranged from −1.53 – 1.81. Mean nearest taxon distance ranged from 0.48 – 1.28; sesMNTD ranged from −1.86 – 1.89.
Maximum likelihood ultrametric phylogenetic tree of the avian community of the Indian Ocean Coastal Belt Forest recorded during the austral breeding season 2015 – 2016. (The ordination was performed in package ‘ape’ [Paradis and Schliep Reference Paradis and Schliep2019]).

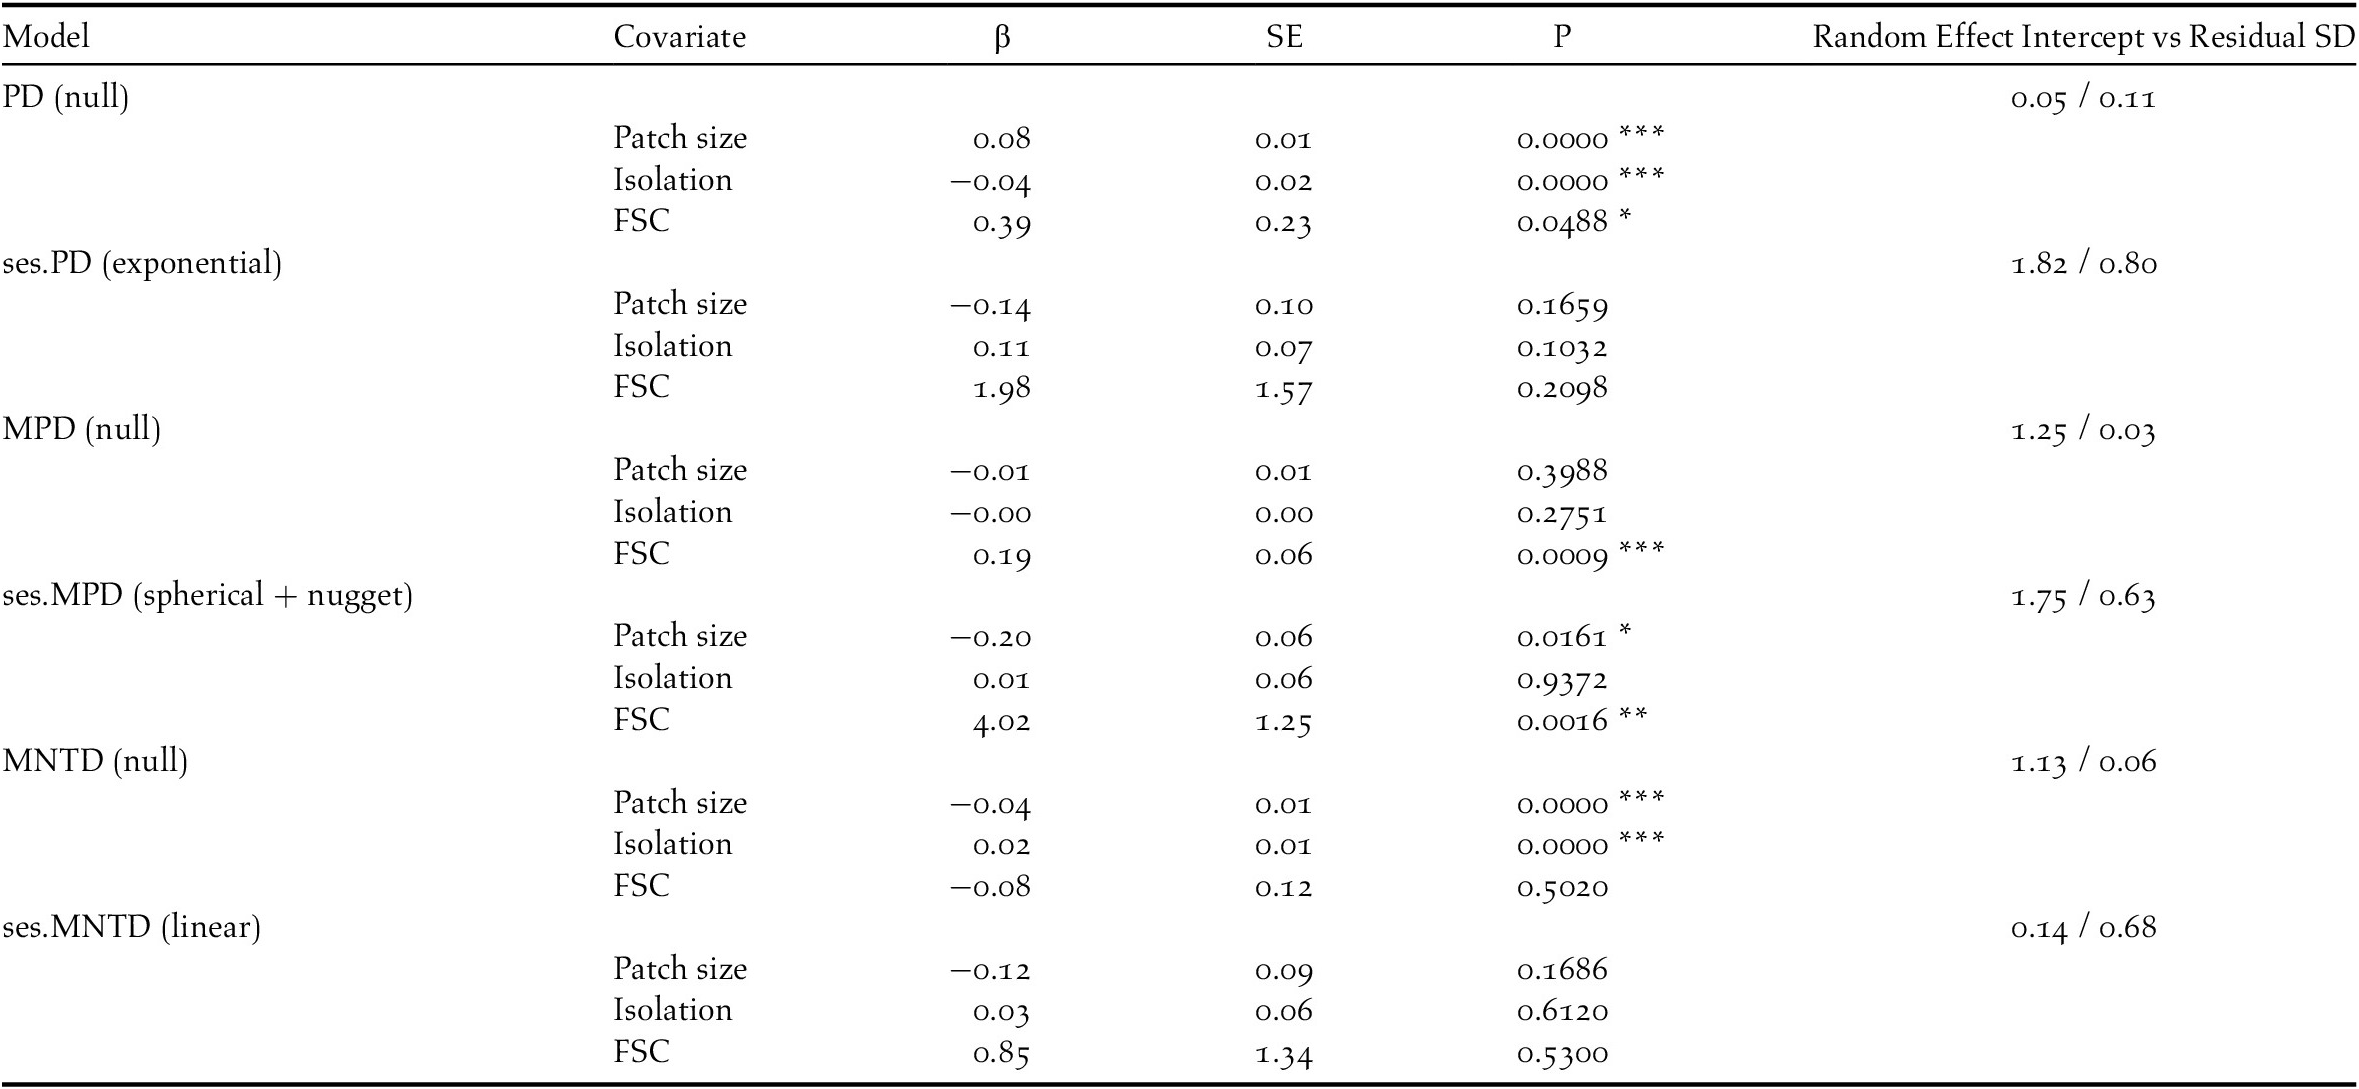
Incorporating spatial error structures made no improvement to the null ‘lme’ models for all models not corrected for species richness (i.e., not ses.models), based on AIC values (see Supporting Information Appendix S4; Table 1). Spatially corrected error structures improved on the null model for all models corrected for species richness (i.e. ses.models), based on AIC values (see Supporting Information Appendix S4; Table 1). Spatially corrected candidate models were < ΔAIC 7, therefore each being of equal explanatory power (c.f. Burnham et al. Reference Burnham, Anderson and Huyvaert2011). However, no candidate model < ΔAIC 7 indicated a difference in the significance of covariates driving measures of phylogenetic diversity; thus, we present the results of the top model (smallest AIC; see Supporting Information Appendix S4; Table 1).
The effect of forest fragmentation metrics (decreasing patch size, increasing isolation distance and decreasing forest-structural complexity [FSC]) on the phylogenetic diversity of the avian community in the Indian Ocean Coastal Belt Forest of South Africa. Habitat type (Coastal Forest, Scarp Forest or Coastal Dense Bush) was applied as a random effect. The three measures of phylogenetic diversity are Faith’s phylogenetic diversity – PD; mean pairwise phylogenetic distance separating all combinations of species pairs – MPD; mean pairwise distance between pairs of the most closely related non-conspecific individuals – MNTD and the Standardised Effect Size of each measure (ses.PD, ses.MPD and ses.MNTD) when correcting for species richness. Models were fitted with various spatial error structures to correct for spatial autocorrelation and compared to the null model. The chosen error structure is provided in the first column.

* P < 0.05; **P < 0.01; ***P < 0.001
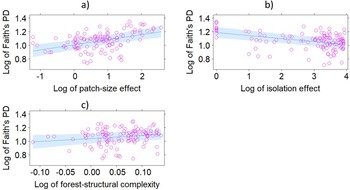
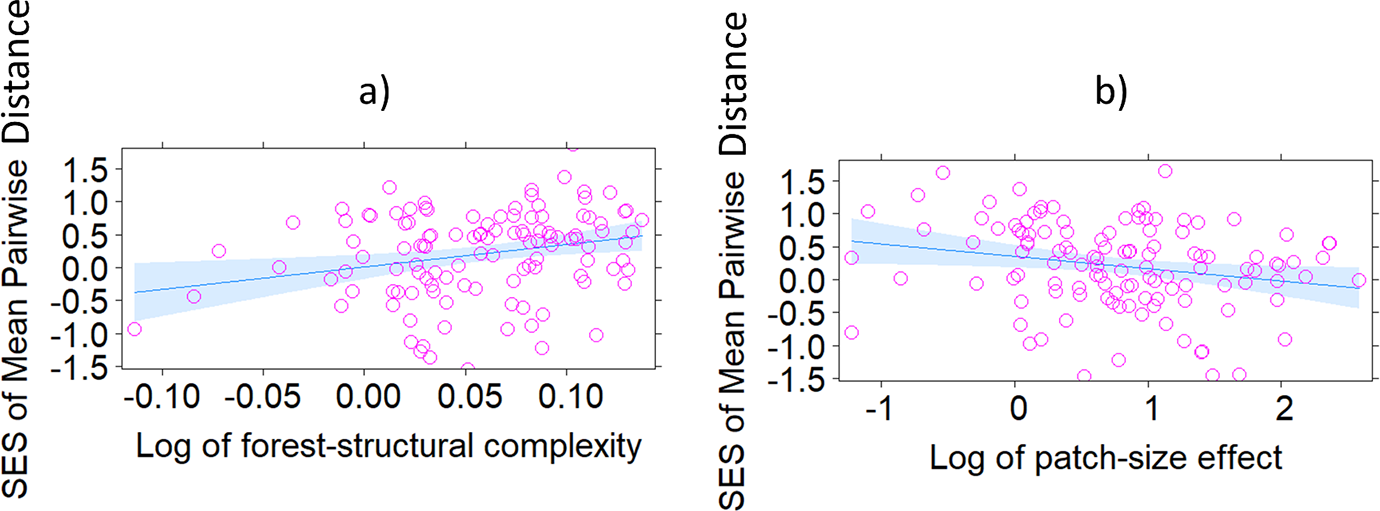
The increasing isolation effect had a strongly significant negative influence, and the increasing patch-size effect had a strongly significant positive influence on PD, indicating that phylogenetic diversity increased in larger, less isolated patches under the action of species richness (Table 1; Figure 3). Forest-structural complexity had a significant positive effect on PD (Table 1). There were no significant effects of forest fragmentation metrics on PD when species richness was controlled for (Table 1). Mean pairwise distance significantly increased as forest-structural complexity increased, indicating that members of the community diverged from each other long ago in more complex forests (Table 1). Patch size and isolation did not affect MPD (Table 1). Forest structural complexity had a significantly positive effect when species richness was controlled for (Figure 4), indicating the same trend in communities with complex forest structures (Table 1). Patch size had a significantly negative effect on ses.MPD, indicating species diverged from each other more recently in larger patches when species richness was controlled for (Table 1; Figure 4). Isolation did not affect ses.MPD (Table 1). Patch size had a strong negative effect, while isolation had a strong positive effect on MNTD, indicating a larger evolutionary distance among species within communities in smaller and more isolated patches under the influence of species richness (Table 1). Forest-structural complexity did not affect MNTD (Table 1). The Standard Effect Size of MNTD was not significantly influenced by any fragmentation metric (P > 0.05). The random effect of habitat type influenced the lme models of ses.PD, MPD, ses.MPD and MNTD (Table 1; see Supporting Information Appendix S5).
The influence of (a) increasing patch size, (b) increasing isolation distance and (c) increasing forest structural complexity of Indian Ocean Coastal Belt Forest patches on Faith’s Phylogenetic Diversity (Faith Reference Faith1992) of the avian forest community recorded therein during austral breeding season surveys, showing the plotted residuals, standard error and regression slope.

The influence of a) increasing forest structural habitat complexity and b) increasing size of patches of Indian Ocean Coastal Belt Forest on the Standard Effect Size of mean pairwise phylogenetic distance separating all combination of species pairs, including conspecifics, of the avian community recorded therein during austral breeding season surveys, showing the plotted residuals, standard error and regression slope.

Discussion
Understanding how anthropogenic forest fragmentation affects the phylogenetic diversity of important forest-dependent taxonomic groups provides critical insights into the fundamental restructuring of evolutionary lineages, as certain lineages are filtered or selected for over others (Frishkoff et al. Reference Frishkoff2014). In the present study, our results indicated that avian communities in the IOCBF were variously affected by anthropogenic forest fragmentation, with the different metrics of phylogenetic diversity responding with no definitive overall pattern (Table 1). Therefore, we are unable to accept our overall hypothesis that anthropogenic forest fragmentation of the IOCBF would select for phylogenetic niche conservatism. Although Faith’s PD decreased as forest patches became smaller and more isolated (Figure 3), when species richness was controlled for, this trend was not significant in larger patches, and reversed in more isolated patches (Table 1). This suggests that the avian community in IOCBF is relatively species-rich. The community also tended to be more phylogenetically clumped in larger patches, with the phylogenetic distance between pairs reducing once species richness was controlled for (Table 1). There was a greater evolutionary distance among species within communities in smaller and more isolated patches (Table 1), although this result was not affected by species richness. Therefore, we reject our prediction that decreasing patch size would decrease phylogenetic diversity but accept our prediction that isolation distance would not influence phylogenetic diversity, and that phylogenetic structuring of the avian community would vary across the fragmented forest landscape.
A reduction in forest habitat structural complexity significantly increased phylogenetic clustering (Table 1, Figure 4), suggesting a filtration effect on avian phylogenetic diversity as patches became more homogenised and disturbed (Frishkoff et al. Reference Frishkoff2014). Thus, we accept our prediction that decreasing forest structural complexity would negatively affect phylogenetic diversity. We consider forest structural complexity a key metric of habitat fragmentation, in addition to traditional metrics of patch size, isolation distance or ‘habitat amount’ (c.f. Fahrig Reference Fahrig2013). It has been critical in elucidating the structuring of avian species assemblages and richness, functional (Ehlers Smith et al. Reference Ehlers Smith, Si, Ehlers Smith, Kalle, Ramesh and Downs2018a) and phylogenetic diversity (Table 1, Figure 4). It can be considered a type of edge effect, whereby complex interior forest structures become homogenised (Murcia Reference Murcia1995), reducing niches and driving phylogenetic clustering.
The IOCBF has evolved into naturally fragmented patches through biogeographic forces and climatic conditions (Mucina and Rutherford Reference Mucina and Rutherford2011), which has been exacerbated by anthropogenic fragmentation (Olivier et al. Reference Olivier, van Aarde and Lombard2013). The avian community’s evolutionary history likely evolved resilience to this natural fragmentation, which is reflected in the phylogeny. It is critical to note the distinction in the response of avian phylogenetic diversity versus species richness and functional diversity to anthropogenic fragmentation of the IOCBF. It has been suggested that phylogenetic diversity can be a proxy for functional diversity (Winter et al. Reference Winter, Devictor and Schweiger2013), as intuitively, the loss of evolutionarily distinct species constitutes a loss of the functions performed by those species (Bracken and Low Reference Bracken and Low2012). While avian species richness and functional diversity are reduced by anthropogenic fragmentation of the IOCBF (Ehlers Smith et al. Reference Ehlers Smith, Si, Ehlers Smith, Kalle, Ramesh and Downs2018a, b), phylogenetic diversity does not precisely follow this same trend. The present study highlighted the importance of testing this proxy’s validity and considering the study system’s evolutionary history. It is also worth noting that no results are presented for the non-breeding season. While the breeding season incorporates a wider range of species because of the community inflation from intra-African and Palearctic migrants, the abundance of the community of the non-breeding season tends to be more inflated because of local altitudinal migrants over-wintering in coastal forests (Brown Reference Brown2006; Ehlers Smith et al. Reference Ehlers Smith, Si, Ehlers Smith and Downs2018b). The fluctuation in individual abundance during the non-breeding season may therefore cause a slight variation in abundance-weighted PD metrics.
Winter et al. (Reference Winter, Devictor and Schweiger2013) argued that there was potential for phylogenetic diversity to inform nature conservation successfully, but there was little evidence to date that it has done so. They highlight the effectiveness of preserving phylogenetic diversity to protect rare, phylogenetically distinct and unique lineages and apply phylogenetic distinctness to guide conservation actions in species for whom threat statuses are missing (Winter et al. Reference Winter, Devictor and Schweiger2013). In response, Harris and Rato (Reference Harris and Rato2013) caution against ‘taxonomic inflation’ and a flood of new species being classified as endangered but support the addition of phylogenetic distinctness to IUCN threat categories. In our study system, just one species is classified as Endangered (the Spotted Ground Thrush, Geokichla gutta; BirdLife International 2012); all species are familiar, and none are Data Deficient. Therefore, this study’s strength for informing conservation actions does not hinge on single species, but rather an interpretation of the phylogeny within the evolutionary history of the study system. While certain measures of phylogenetic diversity in the avian community of the IOCBF displayed a degree of resilience to anthropogenic fragmentation because of its evolution, others were influenced by fragmentation effects, highlighting the importance of considering the multiple metrics of phylogenetic diversity available for interrogation. Moreover, the reduction in functional diversity along the fragmentation gradient (Ehlers Smith et al. Reference Ehlers Smith, Si, Ehlers Smith, Kalle, Ramesh and Downs2018a, b) suggests pressure on traits is nonetheless influencing the persistence of species, reflected in the response of these metrics. Conservation practises based on a narrow set of easily observable functional traits may result in a loss of phylogenetic diversity if not considered (Hughes et al. Reference Hughes, Edwards, Sayer, Martin and Thomas2020). Therefore, we recommend that studies, especially those aiming to guide conservation management, incorporate both phylogenetic and functional diversity measures to sufficiently interrogate communities’ resilience to the threats under investigation.
Supplementary Materials
To view supplementary material for this article, please visit http://doi.org/10.1017/S0959270921000459.
Acknowledgements
The authors wish to thank Ezemvelo KZN Wildlife for granting permission to conduct research within their protected area network. We thank all private landowners for allowing us access. The Claude Leon Foundation (ZA), the National Research Foundation (NRF, ZA, Grants 98404 and 109676) and the University of KwaZulu-Natal (ZA) provided financial support for the associated research costs. The Claude Leon Foundation, the NRF and the University of KwaZulu-Natal, provided financial support for DA Ehlers Smith’s post-doctoral fellowship, and the NRF and the University of KwaZulu-Natal, provided financial support for the post-doctoral fellowship of YC Ehlers Smith. We are grateful to the Ford Wildlife Foundation (ZA) for vehicle support. We are most grateful to the reviewers and Editor for their constructive comments that improved the manuscript.
Conflict of interest
The authors have no conflict of interest to declare.
Data availability
Data belong to the University of KwaZulu-Natal but are available upon reasonable request from the authors.