





1. Introduction
Transitional vertical natural convection boundary layers (NCBLs) are observed in many natural and industrial flows, and through the years, many experimental and numerical investigations have been devoted to understanding them (Fan et al. Reference Fan, Zhao, Torres, Xu, Lei, Li and Carmeliet2021).
An initially laminar vertical NCBL bifurcates into a periodic state due to a supercritical Hopf bifurcation caused by a two-dimensional streamwise wave (Nachtsheim & Swigert Reference Nachtsheim and Swigert1965; Knowles & Gebhart Reference Knowles and Gebhart1968; Ke et al. Reference Ke, Williamson, Armfield, McBain and Norris2019). During the initial stages of transition, the vertical NCBL strongly filters the imposed disturbances while allowing the rapid amplification of a preferred frequency (Jaluria & Gebhart Reference Jaluria and Gebhart1973; Zhao, Lei & Patterson Reference Zhao, Lei and Patterson2016; Ke et al. Reference Ke, Williamson, Armfield, McBain and Norris2019). A shear-driven or buoyancy-driven instability bifurcates the flow depending on the streamwise wavenumber of the instability. For low streamwise wavenumbers, a buoyancy-driven instability bifurcates the steady flow, while for high streamwise wavenumbers, a shear-driven instability is responsible for the bifurcation of the flow (Nachtsheim & Swigert Reference Nachtsheim and Swigert1965).
Following the linear growth regime, disturbances in the NCBL interact with the base flow to form higher-order two-dimensional and three-dimensional modes. Classical K-type and H-type transitions featuring aligned and staggered  $\varLambda$-structures, commonly observed in flat-plate boundary layers (Klebanoff, Tidstrom & Sargent Reference Klebanoff, Tidstrom and Sargent1962; Kachanov & Levchenko Reference Kachanov and Levchenko1984; Rist & Fasel Reference Rist and Fasel1995; Sayadi, Hamman & Moin Reference Sayadi, Hamman and Moin2013), have also been seen in vertical NCBLs despite the velocity profiles being drastically different (Zhao, Lei & Patterson Reference Zhao, Lei and Patterson2017). Secondary longitudinal mean-flow systems were observed during the transition, which promote mixing by transferring fluid between regions close to the wall and the outer regions of the boundary layer (Jaluria & Gebhart Reference Jaluria and Gebhart1973; Zhao et al. Reference Zhao, Lei and Patterson2016, Reference Zhao, Lei and Patterson2017). K-type and H-type transitions of mixed convection boundary layer flow in a heated vertical channel were investigated by Chen & Chung (Reference Chen and Chung2002) where
 $\varLambda$-structures similar to flat-plate boundary layer flows were observed. For
 $Pr = 7$ during the transition, most of the turbulence kinetic energy was generated by buoyancy instead of shear for the NCBL and mixed convection boundary layers.
The presence of a stably stratified ambient medium complicates the onset of instability and the nonlinear evolution of the disturbances as it can either stabilise or destabilise the flow. With the help of two-dimensional linear stability analysis, it was demonstrated that a convective or an absolute instability could bifurcate the flow for a spatially developing vertical natural convection boundary layer on an isothermal wall immersed in a stably stratified medium (Krizhevsky, Cohen & Tanny Reference Krizhevsky, Cohen and Tanny1996; Tao, Le Quéré & Xin Reference Tao, Le Quéré and Xin2004b). Initially, for low Grashof numbers, a convective instability bifurcates the steady laminar flow. However, an increase in the Grashof number also causes a two-dimensional absolute instability, provided that the background stratification is strong enough. At higher Grashof numbers, a regime where this absolute instability transforms into a convective instability was also discovered (Tao, Le Quéré & Xin Reference Tao, Le Quéré and Xin2004a). For the convective instability in weakly stratified, spatially developing NCBLs on constant heat flux walls, it was experimentally determined that the background stratification initially dampens the perturbation at the onset of instability but in the later stages, aids in the development of the disturbance (Jaluria & Gebhart Reference Jaluria and Gebhart1974). Investigations into the nonlinear evolution of two-dimensional disturbances in strongly stratified NCBLs revealed that an absolute nonlinear global mode could bifurcate the steady boundary layer for specific values of ambient stratification (Tao Reference Tao2006).
When a heated vertical surface is placed in a thermally stratified ambient medium, an equilibrium NCBL can also develop on the vertical surface if the temperature difference between the heated surface and the stratified ambient medium is a constant value. This one-dimensional flow was formulated by Prandtl (Reference Prandtl1952) as the buoyancy layer. The vertical buoyancy layer can be used as a simplified representation of NCBL flow over a linearly heated vertical wall in a stably stratified medium. It can also be used to investigate the stability and transition of a semi-infinite isothermal vertical wall in a stably stratified medium by assuming that the spatial scales of development of the boundary layer are much larger than the scales at which the transition occurs, i.e. using a locally parallel approximation.
The linear stability of the vertical buoyancy flow when perturbed with two-dimensional disturbances was initially investigated by Gill & Davey (Reference Gill and Davey1969) and McBain, Armfield & Desrayaud (Reference McBain, Armfield and Desrayaud2007). Two different instabilities were identified, and, depending on the Prandtl number of the fluid, either a shear-driven instability or a buoyancy-driven instability bifurcates the steady flow. The influence of thermal boundary conditions on the heated vertical surface on the linear stability of two-dimensional disturbances was investigated by McBain et al. (Reference McBain, Armfield and Desrayaud2007), and it was found that the buoyancy layer is less stable when a constant heat flux is prescribed on the vertical heated surface instead of a linearly varying temperature boundary condition. Iyer & Kelly (Reference Iyer and Kelly1978) demonstrated that only a supercritical bifurcation could occur and transition the steady flow into a periodic regime when a steady vertical buoyancy layer is perturbed with a two-dimensional streamwise disturbance. The longitudinal roll instability/streak instability is always linearly stable for the vertical buoyancy layer (Xiong & Tao Reference Xiong and Tao2017). The critical Grashof number of the energy stability of the vertical buoyancy layer is not the same as the critical Grashof number of the linear stability of the vertical buoyancy layer (Dudis & Davis Reference Dudis and Davis1971). This leads to the possibility of transient growth at subcritical Grashof numbers, and the bounds for transient growth were calculated by Xiong & Tao (Reference Xiong and Tao2017).
Since Squire's theorem (Squire Reference Squire1933), which states that the most amplified instability in a parallel shear flow is always two-dimensional, is not valid in the presence of stratification (Deloncle, Chomaz & Billant Reference Deloncle, Chomaz and Billant2007), it is plausible that a three-dimensional oblique wave disturbance can have comparable growth rates to two-dimensional streamwise waves in the linearly unstable regime, leading to scenarios where small-amplitude oblique waves can attain finite-amplitude states and transition the flow to turbulence, leading to the O-type transition (Goldstein & Choi Reference Goldstein and Choi1989). To date, no studies have been conducted into the O-type transition or the oblique-mode breakdown of vertical NCBLs with or without ambient stable stratification. Therefore, the oblique-mode breakdown of a vertical NCBL immersed in a stably stratified medium, modelled using the buoyancy layer, is investigated in this study.
Although not previously reported in NCBLs, the O-type transition has been observed in several other isothermal canonical flows. Therefore, the O-type transition in such flows is discussed in § 1.1. The contributions of the present study are outlined in § 1.2.
1.1. Transition caused by a pair of oblique waves
The transition in parallel canonical flows not involving buoyancy has been investigated through the years using experiments and numerical simulations (Klebanoff et al. Reference Klebanoff, Tidstrom and Sargent1962; Kachanov & Levchenko Reference Kachanov and Levchenko1984; Rist & Fasel Reference Rist and Fasel1995; Sayadi et al. Reference Sayadi, Hamman and Moin2013; Lee & Jiang Reference Lee and Jiang2019). One possible transition route is the development of unstable Tollmien–Schlichting or two-dimensional streamwise waves and their interaction with three-dimensional waves. It was demonstrated that two types of transition were possible, depending on the wavenumber of the three-dimensional oblique waves with respect to the wavenumber of the two-dimensional streamwise waves (Klebanoff et al. Reference Klebanoff, Tidstrom and Sargent1962; Kachanov & Levchenko Reference Kachanov and Levchenko1984; Rist & Fasel Reference Rist and Fasel1995).
However, a transition is also possible without the presence of two-dimensional waves and with only three-dimensional oblique waves present. The transition caused by a pair of three-dimensional oblique waves in the Blasius boundary layer flow, asymptotic suction boundary layer flow, compressible boundary layer flow and plane–Poiseuille flow has been investigated using numerical simulations and experiments (Kosinov, Maslov & Shevelkov Reference Kosinov, Maslov and Shevelkov1990; Thumm, Wolz & Fasel Reference Thumm, Wolz and Fasel1990; Schmid & Henningson Reference Schmid and Henningson1992; Berlin, Lundbladh & Henningson Reference Berlin, Lundbladh and Henningson1994; Chang & Malik Reference Chang and Malik1994; Reddy et al. Reference Reddy, Schmid, Baggett and Henningson1998; Berlin, Wiegel & Henningson Reference Berlin, Wiegel and Henningson1999; Levin, Davidsson & Henningson Reference Levin, Davidsson and Henningson2005; Mayer, Wernz & Fasel Reference Mayer, Wernz and Fasel2007; Mayer, von Terzi & Fasel Reference Mayer, von Terzi and Fasel2008; Mayer, Von Terzi & Fasel Reference Mayer, Von Terzi and Fasel2011; Zhong & Wang Reference Zhong and Wang2012; Ryu, Marxen & Iaccarino Reference Ryu, Marxen and Iaccarino2015; Laible & Fasel Reference Laible and Fasel2016; Lee & Chen Reference Lee and Chen2019). In these flows, the transition can occur supercritically or subcritically depending on the Reynolds number and the type of the flow. The O-type transition shares many quantitative and qualitative similarities with all the above flows, irrespective of whether the transition is supercritical or subcritical.
After a pair of oblique waves are introduced into the flow, they can grow either due to modal mechanisms, non-modal mechanisms or both (Schmid & Henningson Reference Schmid and Henningson2001). During the initial stages of the O-type transition, a pair of oblique waves nonlinearly interact to form streaks, two-dimensional waves and harmonic oblique waves. In the canonical flows mentioned above, due to non-modal mechanisms, the growth rates of the streak modes are considerably greater than the growth rates of the two-dimensional streamwise waves and, thus, dominate the flow field (Schmid & Henningson Reference Schmid and Henningson1992; Berlin et al. Reference Berlin, Wiegel and Henningson1999; Laible & Fasel Reference Laible and Fasel2016). If the flow is perturbed with a pair of finite-amplitude oblique waves, it was shown that despite the streak modes being created due to nonlinear interactions, the main driving force was non-modal linear growth (Schmid & Henningson Reference Schmid and Henningson1992). After reaching sufficient amplitude, the streak modes break down due to a secondary instability and are responsible for the transition. The transition caused by a pair of oblique waves after the formation of streak modes is similar to the subcritical streak-mode breakdown, where the transition occurs due to a secondary instability occurring in the streaks (Reddy et al. Reference Reddy, Schmid, Baggett and Henningson1998; Levin et al. Reference Levin, Davidsson and Henningson2005). In Blasius boundary layers, the late transition structures of the O-type transition are qualitatively similar to K-type and H-type transition (Klebanoff et al. Reference Klebanoff, Tidstrom and Sargent1962; Kachanov & Levchenko Reference Kachanov and Levchenko1984; Sayadi et al. Reference Sayadi, Hamman and Moin2013), with there being characteristic  $\varLambda$-structures, which was attributed to all three transition scenarios exhibiting similar nonlinear wave–wave interactions (Berlin et al. Reference Berlin, Wiegel and Henningson1999).
The transition thresholds for a pair of oblique waves were calculated by Reddy et al. (Reference Reddy, Schmid, Baggett and Henningson1998) and Levin et al. (Reference Levin, Davidsson and Henningson2005) for the plane–Poiseuille flow and asymptotic suction boundary layer flow, respectively. It was demonstrated that the transition thresholds for pair of oblique waves were considerably lower than two-dimensional streamwise waves during the subcritical transition, implying that a rapid transition could be achieved by perturbing the flow with a pair of oblique waves.
In compressible boundary layers, the oblique waves grow linearly and, at times, have higher growth rates than two-dimensional streamwise waves, and it is believed that the oblique waves are the main driving force during the transition process (Kosinov et al. Reference Kosinov, Maslov and Shevelkov1990; Thumm et al. Reference Thumm, Wolz and Fasel1990; Chang & Malik Reference Chang and Malik1994; Mayer et al. Reference Mayer, Wernz and Fasel2007, Reference Mayer, von Terzi and Fasel2008, Reference Mayer, Von Terzi and Fasel2011; Zhong & Wang Reference Zhong and Wang2012; Lee & Chen Reference Lee and Chen2019). The initial nonlinear interactions observed in compressible supersonic boundary layer flows closely followed the nonlinear interactions observed in incompressible canonical flows (Schmid & Henningson Reference Schmid and Henningson1992; Hanifi, Schmid & Henningson Reference Hanifi, Schmid and Henningson1996). Similar to incompressible flows discussed above, in compressible supersonic boundary layers, the flow field is dominated by streaks (Chang & Malik Reference Chang and Malik1994; Mayer et al. Reference Mayer, Wernz and Fasel2007, Reference Mayer, von Terzi and Fasel2008, Reference Mayer, Von Terzi and Fasel2011; Laible & Fasel Reference Laible and Fasel2016). As similar streak modes were observed in incompressible and compressible flows, it was suggested that the non-modal growth and the prevalence of streak modes during the oblique transition were common features of O-type transition in several flow situations (Schmid & Henningson Reference Schmid and Henningson1992; Hanifi et al. Reference Hanifi, Schmid and Henningson1996).
1.2. Contributions of the present study
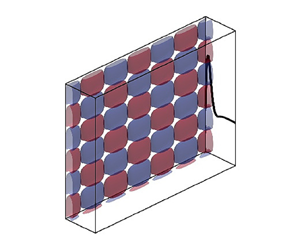
From the literature, it is clear that a pair of oblique waves can transition the flow into a chaotic state in canonical flows where buoyancy is absent. However, there is no prior research on O-type transition in NCBLs. The study focuses on the transition initiated by a pair of oblique waves in boundary layers where buoyancy and stratification are present and where the boundary layer flow is significantly different to the flow discussed in § 1.1. Figure 1 shows the geometric representation of the transition investigated in the current study.
Illustration of the problem investigated in the current study. The red and blue isosurfaces represent a pair of symmetric oblique wave perturbations. The thick black curve represents the streamwise velocity profile of the laminar base flow. Here,  $x_1, x_2$ and
 $x_3$ are the wall-normal, streamwise and spanwise axes, respectively. The fluid flows upwards, and the acceleration due to gravity
 $g$ is acting downwards.

In § 2, Prandtl's one-dimensional buoyancy boundary layer is defined. The governing equations of the flow, methodology and numerical tools employed are outlined.
Section 3 discusses the results from linear stability analysis, where it is demonstrated that, for certain wavenumber combinations, the oblique waves have comparable growth rates to two-dimensional streamwise waves.
Section 4 discusses the oblique-mode breakdown observed from numerical simulations. It is demonstrated that there is no universal transition pathway, with the transition depending on the streamwise and spanwise wavenumbers of the initial oblique waves. The presence of secondary mean flows during the transition is explained.
Turbulence statistics are quantified in § 5, and the effect of the initial amplitude of oblique waves on transition is highlighted in § 6.
2. Governing equations and methodology
2.1. Problem definition
Consider a heated vertical surface immersed in a stratified medium such that the temperature difference between the surface and the ambient medium remains constant along the entire length of the vertical surface. The temperature difference between the vertical surface and the ambient surroundings causes the fluid to rise upwards and form a NCBL on the surface. However, due to the stable ambient stratification, the NCBL does not grow with increasing height but attains a constant boundary layer thickness and has temporally and spatially invariant velocity and buoyancy profiles. The flow schematic is shown in figure 2. From the figure, it is clear that the buoyancy layer features zones of flow reversal and temperature deficit in the outer layer, making it drastically different from unstratified vertical NCBLs where no such flow reversal or temperature deficit is observed (cf. figure 1 in Ke et al. Reference Ke, Williamson, Armfield, McBain and Norris2019). Throughout this paper, the region between the linearly heated wall at  $x_1 = 0$ and the velocity maximum at
 $x_1 = 0.785$ is termed the inner layer, and the region between the velocity maximum at
 $x_1 = 0.785$ and
 $x_1 = \infty$ is termed the outer layer. The location of velocity maximum is represented using a vertical dashed red line in figure 2.
Schematic representation of the laminar vertical buoyancy layer showing the coordinate system and the boundary conditions. The region between the linearly heated wall ( $x_1 = 0$), and the vertical dashed red line is the inner layer and the region between the vertical dashed red line and
 $x_1 = \infty$ is the outer layer.

The non-dimensional governing equations, with the Oberbeck–Boussinesq approximation for buoyancy, of the flow are shown in (2.1a)–(2.1c) (Gill & Davey Reference Gill and Davey1969; McBain et al. Reference McBain, Armfield and Desrayaud2007)
 \begin{gather} \frac{\partial u_i}{\partial x_i} = 0, \end{gather}
 \begin{gather} \frac{\partial u_i}{\partial t} + u_j \frac{\partial u_i}{\partial x_j} ={-} \frac{\partial p}{\partial x_i} + \frac{1}{Re} \frac{\partial^2 u_i}{\partial x^2_j} + \frac{2}{Re} \vartheta, \end{gather}
 \begin{gather} \frac{\partial \vartheta}{\partial t} + u_j \frac{\partial \vartheta}{\partial x_j} = \frac{1}{Re\,Pr} \frac{\partial^2 \vartheta}{\partial x^2_j} - \frac{2}{Re\,Pr}u_2, \end{gather}
where  $\vartheta$ is the temperature or the buoyancy field, which is the non-dimensional temperature difference between the heated vertical surface and the ambient surroundings with respect to the vertical temperature gradient,
 $u_i$ is the velocity field and
 $p$ is the pressure field. The length and velocity scales are (Gill & Davey Reference Gill and Davey1969)
 \begin{gather} \delta_l = \left( \frac{4 \nu \kappa}{g \varrho \varGamma_s} \right)^{{1}/{4}}. \end{gather}
 \begin{gather} U_{\Delta T} = \Delta T \left( \frac{g \varrho \kappa}{\nu \varGamma_s} \right)^{{1}/{2}}, \end{gather}
where  $\delta _l$ is the thickness of the boundary layer,
 $\nu, \kappa, g, \varrho, \varGamma _s$ are the kinematic viscosity, thermal diffusivity, acceleration due to gravity, coefficient of thermal expansion and stable vertical temperature gradient, respectively. Also,
 $\Delta T$ is the temperature difference between the vertical surface and the ambient surroundings.
Prandtl (Reference Prandtl1952) derived the analytic solution for the laminar flow where the velocity and buoyancy fields can be written as
 \begin{gather} u_2 = {\rm e}^{{-}x_1}\sin(x_1), \end{gather}
 \begin{gather} \vartheta = {\rm e}^{{-}x_1}\cos(x_1). \end{gather}
It should be noted that the above non-dimensional analytic laminar solution is independent of the Prandtl number and the Reynolds number. The  $u_2$ and
 $\vartheta$ fields shown in figure 2 correspond to the analytic solution. For the current non-dimensionalisation, the Grashof number, based on the boundary layer thickness, can be defined as
 $Gr = 2Re$ as
 $Re = U_{\Delta T} \delta _l / \nu = (g \varrho \Delta T \delta _l^3)/2\nu ^2$ (Gill & Davey Reference Gill and Davey1969).
2.2. Linear stability analysis
The stability of a steady laminar flow to infinitesimal disturbances can be investigated by linearising the Navier–Stokes equations and assuming that the nonlinear terms do not play a significant role in the bifurcation of the flow (Drazin & Reid Reference Drazin and Reid2004). For linear stability analysis, the velocity, buoyancy and pressure fields can be written as a combination of their base laminar state and a perturbation
 \begin{gather} u_i = \overline{u_i} + \widehat{u_i}, \end{gather}
 \begin{gather} p = \bar{p} + \hat{p}, \end{gather}
 \begin{gather} \vartheta = \bar{\vartheta} + \hat{\vartheta}, \end{gather}
where  $\overline {u_i}$,
 $\bar {p}$ and
 $\bar {\vartheta }$ represent the base state while
 $\widehat {u_i}$,
 $\hat {p}$ and
 $\hat {\vartheta }$ represent the perturbation fields.
The linearised Navier–Stokes equations are as follows:
 \begin{gather} \frac{\partial \widehat{u_i}}{\partial x_i} = 0, \end{gather}
 \begin{gather} \frac{\partial \widehat{u_i}}{\partial t} + \widehat{u_j} \frac{\partial \overline{u_i}}{\partial x_j} + \overline{u_j} \frac{\partial \widehat{u_i}}{\partial x_j} ={-} \frac{\partial \hat{p}}{\partial x_i} + \frac{1}{Re} \frac{\partial^2 \widehat{u_i}}{\partial x^2_j} + \frac{2}{Re}\hat{\vartheta}, \end{gather}
 \begin{gather} \frac{\partial \hat{\vartheta}}{\partial t} + \widehat{u_j} \frac{\partial \bar{\vartheta}}{\partial x_j} + \overline{u_j} \frac{\partial \hat{\vartheta}}{\partial x_j} = \frac{1}{Re\,Pr}\frac{\partial^2 \hat{\vartheta}}{\partial x^2_j} - \frac{2}{Re\,Pr}\widehat{u_2}, \end{gather}
where  $\overline {u_2} = {\rm e}^{-x_1}\sin (x_1)$,
 $\bar {\vartheta } = {\rm e}^{-x_1}\cos (x_1)$ and
 $\overline {u_1}$ and
 $\overline {u_3} = 0$ from the definition of the base flow.
Pressure can be eliminated from (2.5a)–(2.5c) and can be written using wall-normal velocity and normal vorticity formulation (Tao & Busse Reference Tao and Busse2009), which reduces the problem to three variables instead of five, leading to significant savings in computational cost. In the wall-normal velocity and normal vorticity formulation, the general infinitesimal disturbances are represented by the ansatz (Tao & Busse Reference Tao and Busse2009)
 \begin{equation} \begin{Bmatrix}
\widehat{u_1} \\ \widehat{u_2} \\ \widehat{u_3} \\
\hat{\vartheta} \end{Bmatrix} = \begin{Bmatrix}
\tilde{v}(x_1) \\ \dfrac{{\rm i}\alpha}{k^2}\tilde{v}'(x_1)
+ \eta(x_1) \\ \dfrac{{\rm i}\beta}{k^2}\tilde{v}'(x_1) -
\dfrac{\alpha}{\beta}\eta(x_1) \\ \varTheta(x_1)
\end{Bmatrix} \exp({{\rm i}(\alpha x_2 + \beta x_3 - \omega
t)}), \end{equation}
where  $\alpha$ is the streamwise wavenumber of the wave-like disturbance,
 $\beta$ is the spanwise wavenumber of the wave-like disturbance,
 $\omega$ is the frequency of the disturbance,
 $\tilde {v}$ is the wall-normal velocity and
 $\eta$ is the normal vorticity.
As the steady laminar flow is a parallel one-dimensional flow, a temporal stability analysis is performed where  $\alpha$ and
 $\beta$ are real, making
 $\omega$ a complex value (Drazin & Reid Reference Drazin and Reid2004). The real part of
 $\omega$ corresponds to the wave's frequency, while the imaginary part of
 $\omega$ corresponds to the growth rate
 $\phi$. Equations (2.7a)–(2.7c) govern the stability of the base flow, which are the same as (2.5a)–(2.5c) but written in wall-normal velocity (
 $\tilde {v}$) and normal vorticity (
 $\eta$) form
 \begin{gather} -\tilde{v}'''' + 2k^2\tilde{v}'' - k^4\tilde{v} + ({\rm i}\alpha Re \bar{U} - {\rm i} \omega Re)(\tilde{v}'' - k^2\tilde{v}) - {\rm i}\alpha Re \bar{U}'' \tilde{v} + 2{\rm i}\alpha \varTheta' = 0, \end{gather}
 \begin{gather} -\eta'' + k^2 \eta + \eta ({\rm i}\alpha Re \bar{U} - {\rm i} \omega Re ) + \frac{\beta^2}{k^2}(Re\bar{U}'\tilde{v} - 2\varTheta) = 0 ,\end{gather}
 \begin{gather} \varTheta'' - k^2\varTheta + {\rm i}Re\,Pr\varTheta(\omega -\alpha \bar{U} \varTheta) - 2 \left(\eta + \frac{{\rm i}\alpha}{k^2} \tilde{v}'\right) - Re\,Pr\bar{\vartheta}'\tilde{v} = 0, \end{gather}
where prime  $'$ indicates
 $\partial /\partial {x_1}$ and
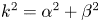 $k^2 = \alpha ^2 + \beta ^2$, where
 $k$ is the magnitude of the wave vector formed by
 $\alpha$ and
 $\beta$ (Squire Reference Squire1933; Drazin & Reid Reference Drazin and Reid2004; Deloncle et al. Reference Deloncle, Chomaz and Billant2007).
Equations (2.7a)–(2.7c) are subject to the following boundary conditions:
At  $x_1 = 0$
 \begin{equation} \eta = \tilde{v}' = \tilde{v} = \varTheta = 0. \end{equation}
At  $x_1 = \infty$
 \begin{equation} \eta = \tilde{v}' = \tilde{v} = \varTheta = 0. \end{equation}
The three-dimensional stability of linearised Navier–Stokes equations is determined by computing the eigenvalues of the linearised Navier–Stokes equations shown in (2.7a)–(2.7c) using a Chebyshev collocation scheme (Weideman & Reddy Reference Weideman and Reddy2000). The following algebraic linear mapping is used to transform the Chebyshev collocation points from their natural domain  $[-1,1]$ to
 $[0,30]$ (Yalcin, Turkac & Oberlack Reference Yalcin, Turkac and Oberlack2021):
 \begin{equation} x = \frac{L}{2}(\bar{x} + 1), \end{equation}
where  $\bar {x}$ is the coordinate in the natural domain, and
 $x$ is the mapped wall-normal coordinate. Here,
 $L$ is the length of the domain.
The flow was discretised with 201 Chebyshev collocation points. Additional computations were run using a bigger domain size and a higher number of Chebyshev collocation points. It was found that the eigenvalue spectrum close to the imaginary axis varied by less than  $0.1\,\%$, demonstrating that the chosen domain and number of collocation points accurately resolved the flow.
2.3. Direct numerical simulation
The linear stability analysis discussed in § 2.2 can be used to understand the onset of supercritical instability and the early evolution of the instability where nonlinear interactions are small enough such that they can be ignored. However, once the instability grows to a finite-amplitude state, nonlinearities become unavoidable, and the full nonlinear Navier–Stokes equations need to be solved in three dimensions to understand the transition.
Direct numerical simulations (DNS) were performed using an in-house non-staggered finite volume code (Norris Reference Norris2000; Armfield et al. Reference Armfield, Morgan, Norris and Street2003) which has been previously used to simulate natural convection flows (Armfield et al. Reference Armfield, Morgan, Norris and Street2003; Maryada & Norris Reference Maryada and Norris2021). The spatial terms were discretised using a second-order centre difference scheme. Temporally, the advection terms were discretised using a second-order Adams–Bashforth scheme, while the diffusion terms were discretised using a second-order Crank–Nicolson scheme. A non-iterative fractional step scheme (Armfield & Street Reference Armfield and Street2002) was used to solve for continuity.
The width of the spanwise domain  $x_3$ was
 $6 {\rm \pi}/ \beta$ while the height of the streamwise domain
 $x_2$ was
 $6 {\rm \pi}/ \alpha$, where
 $\alpha$ and
 $\beta$ are streamwise and spanwise wavenumbers, respectively. It should be noted that the domain size varies in the streamwise and the spanwise directions depending on the values of
 $\alpha$ and
 $\beta$. In the wall-normal direction
 $x_1$, the domain extends up to
 $4.8 \delta _{lf}$ where
 $\delta _{lf}$ is the thickness of the laminar boundary layer and the flow reversal. The domain size used in the wall-normal direction is greater than the domain size often employed while investigating transitional and turbulent one-dimensional parallel flows using DNS (Bobke, Örlü & Schlatter Reference Bobke, Örlü and Schlatter2016; Khapko et al. Reference Khapko, Schlatter, Duguet and Henningson2016). An additional simulation was performed where the wall-normal domain size was doubled, and the spanwise and streamwise domain sizes were increased to
 $10 {\rm \pi}/ \beta$ and
 $10 {\rm \pi}/ \alpha$. It was found that the increase in domain size had a minimal influence on the transition process. Hence, the
 $4.8 \delta _{lf} \times 6 {\rm \pi}/ \alpha \times 6 {\rm \pi}/ \beta$ domain was chosen for the current study. A comparison between the growth rates of different modes observed during the initial stages of the O-type transition for two different wall-normal domain sizes is made in Appendix A.
A semi-logarithmic mesh was used in the wall-normal direction such that  $\Delta x_1$ at the wall was
 $0.42\delta _\nu$ and
 $\Delta x_1$ at the edge of the domain was
 $4.52\delta _\nu$. A uniform mesh was used in the streamwise and spanwise directions. In the streamwise direction,
 $\Delta x_2$ was always less than
 $5.4\delta _\nu$, and in the spanwise direction,
 $\Delta x_3$ was always less than
 $5\delta _\nu$. Here,
 $\delta _\nu = 0.0707$ is the viscous length scale based on the laminar analytic solution. It should be noted that
 $\delta _\nu$ is not constant during the transition; however, it is always greater than the
 $\delta _\nu$ of the laminar analytic solution (demonstrated in § 4.1). The dimensions of the mesh and the domain size used for the current study are shown in table 1. In the table, variables with superscript
 $+$ are non-dimensionalised by dividing by
 $\delta _\nu$. The stretching factor of the semi-logarithmic mesh in the wall-normal direction is represented using
 $\gamma _s$. The number of cells in the wall-normal, streamwise and spanwise directions are represented using
 $N_{x1}$,
 $N_{x2}$ and
 $N_{x3}$, respectively.
Simulation settings for DNS of oblique transition scenarios reported in the paper.

Periodic boundary conditions were imposed on the streamwise and spanwise boundaries. An open type boundary was used at the far boundary normal to the wall, where the flow was allowed to enter and exit the domain (Zhao et al. Reference Zhao, Lei and Patterson2017). At the heated wall,  $\vartheta = 1$ and
 $u_i = 0$ boundary conditions were applied. An appropriate time step was chosen to ensure that the Courant number was always less than
 $0.2$.
The use of periodic boundary conditions in the streamwise direction results in a temporal problem, where the transition occurs in time and not in space (Wray & Hussaini Reference Wray and Hussaini1984; Herbert Reference Herbert1991; Kleiser & Zang Reference Kleiser and Zang1991). Through the years, such a simulation for boundary layer transition has been used as an alternative to the standard spatial problem, where the transition evolves in space and not in time, due to the reduced computational costs (Wray & Hussaini Reference Wray and Hussaini1984; Spalart & Yang Reference Spalart and Yang1987; Kim & Moser Reference Kim and Moser1989; Singer, Reed & Ferziger Reference Singer, Reed and Ferziger1989; Reddy et al. Reference Reddy, Schmid, Baggett and Henningson1998; Levin et al. Reference Levin, Davidsson and Henningson2005). It has been demonstrated in several studies that the transition events observed in the temporal problem closely match the transition events observed in experiments and the spatial problem, leading to the conclusion that similar physical processes are responsible for transition in both the temporal and the spatial problems (Wray & Hussaini Reference Wray and Hussaini1984; Kleiser & Zang Reference Kleiser and Zang1991; Kucala & Biringen Reference Kucala and Biringen2014). Motivated by the observations of Wray & Hussaini (Reference Wray and Hussaini1984) and Spalart & Yang (Reference Spalart and Yang1987) for boundary layer flow, and Kucala & Biringen (Reference Kucala and Biringen2014) for the parallel plane–Poiseuille flow, a temporal direct numerical simulation was used to investigate the buoyancy layer in the current study.
2.3.1. Perturbation quantities for oblique waves
To simulate the initial perturbation of the boundary layer, the buoyancy field is perturbed with a pair of oblique waves at the start of the simulation
 \begin{equation} \xi = {\rm e}^{{-}x_1} A[\sin(\alpha x_2 + \beta x_3) + \sin(\alpha x_2 - \beta x_3)], \end{equation}
where  $A$ is the amplitude of the waves and is set to
 $10^{-3}$, and
 ${\rm e}^{-x_1}$ is the shape function of the boundary layer, which ensures that the initial perturbation is concentrated within the boundary layer.
The perturbation in (2.11) is independent of time as it is only applied at the start of the simulation as an initial condition. This is because the DNS used in the current study is a temporal DNS with streamwise periodic boundary conditions, where the transition evolves in time instead of space (Herbert Reference Herbert1991; Kleiser & Zang Reference Kleiser and Zang1991). Including the perturbation as an initial condition follows the methodology adopted in several prior temporal DNS investigations of stability and transition (Wray & Hussaini Reference Wray and Hussaini1984; Spalart & Yang Reference Spalart and Yang1987; Kim & Moser Reference Kim and Moser1989; Singer et al. Reference Singer, Reed and Ferziger1989; Herbert Reference Herbert1991; Kleiser & Zang Reference Kleiser and Zang1991; Reddy et al. Reference Reddy, Schmid, Baggett and Henningson1998; Levin et al. Reference Levin, Davidsson and Henningson2005; Ke et al. Reference Ke, Williamson, Armfield, McBain and Norris2019).
As the temperature and momentum equations are coupled in the present case, it is only necessary to perturb the temperature field to ensure a perturbation of the velocity field. Perturbing the temperature field would allow us to introduce a perturbation in the boundary layer while ensuring that the velocity field is divergence free. A similar strategy was used in several numerical studies investigating NCBLs (Janssen & Armfield Reference Janssen and Armfield1996; Zhao et al. Reference Zhao, Lei and Patterson2016, Reference Zhao, Lei and Patterson2017; Ke et al. Reference Ke, Williamson, Armfield, McBain and Norris2019, Reference Ke, Williamson, Armfield, Norris and Komiya2020). It should be noted that the major conclusions of the study do not change if the velocity field is perturbed instead of the buoyancy field (Zhao et al. Reference Zhao, Lei and Patterson2017).
3. Linear stability at  ${Re=200}$

This section presents the results of the three-dimensional linear stability of the vertical buoyancy layer at  $Re = 200$. The primary objective of the linear stability analysis is to determine whether oblique waves can experience linear growth in the vertical buoyancy layer. The results from the linear stability analysis will then be used to determine
 $\alpha$ and
 $\beta$ in (2.11) while performing the DNS. Using
 $\alpha$ and
 $\beta$ of the linearly unstable oblique waves ensures that perturbations can grow due to linear mechanisms to cause a supercritical bifurcation. The second objective is to investigate whether the linearly unstable oblique waves (if present) have comparable growth rates to the two-dimensional streamwise waves.
The vertical buoyancy layer having  $Pr = 0.71$ bifurcates from a steady laminar state to a periodic state due to a linear supercritical bifurcation at
 $Re = 102.17$. At this critical Reynolds number, a two-dimensional streamwise wave having
 $\alpha = 0.291$ and
 $\omega = 8.111 \times 10^{-2}$ bifurcates the flow. The reader is referred to Gill & Davey (Reference Gill and Davey1969) and McBain et al. (Reference McBain, Armfield and Desrayaud2007) for the two-dimensional neutral stability curves of the vertical buoyancy layer for different Prandtl number fluids.
Despite the steady laminar vertical buoyancy layer undergoing a supercritical Hopf bifurcation at  $Re = 102.17$, the linear stability and transition were investigated at
 $Re = 200$ as this Reynolds number was found to be high enough for the flow to transition to a chaotic state. At lower Reynolds numbers, the buoyancy layer does not transition into a chaotic state after introducing an initial perturbation into the flow in DNS. However, it undergoes nonlinear saturation and transitions into a periodic or a quasiperiodic regime (not shown here for brevity). The reader is referred to McBain et al. (Reference McBain, Armfield and Desrayaud2007) for periodic flow observed in the vertical buoyancy layer at Reynolds numbers marginally greater than the critical Reynolds number.
Figure 3(a) shows the constant amplification curves of the modal instability along with the marginal stability curve at  $Re = 200$. The marginal stability curve is represented using a thick black curve. Instabilities having streamwise and spanwise wavenumbers enclosed within the marginal stability curve are linearly unstable, while those that lie outside the marginal stability curve are linearly stable.
Marginal stability curves for the vertical buoyancy layer at  $Re = 200$. (a) Contours of constant growth rate
 $\phi$; (b) contours of constant phase speed
 $c$; (c) contours of constant frequency
 $\omega$. The thick black curves represent the marginal stability curve.

The growth rate/amplification  $\phi$ corresponds to the magnitude of the imaginary part of
 $\omega$. The highest growth rates are observed for two-dimensional disturbances, i.e. disturbances where
 $\beta = 0$, despite Squire's theorem (Squire Reference Squire1933) not being valid in the presence of stratification and buoyancy (Deloncle et al. Reference Deloncle, Chomaz and Billant2007). A two-dimensional disturbance with
 $\beta = 0$ has the highest growth rate at the Reynolds number of 200, having a streamwise wavenumber
 $\alpha = 0.505$ and frequency
 $\omega = 9.584 \times 10^{-2}$.
For a constant streamwise wavenumber, an increase in the spanwise wavenumber of the disturbance reduces the growth rate, demonstrating that, at  $Re = 200$, the oblique waves (instability waves having non-zero values for both
 $\alpha$ and
 $\beta$) always have lower growth rates than two-dimensional waves having the same streamwise wavenumber. However, the effect of
 $\beta$ on the growth rate is not straightforward. For a constant streamwise wavenumber
 $\alpha$, large values of
 $\beta$ have significantly smaller values of
 $\phi$. For
 $\alpha = 0.4$ and
 $\alpha = 0.5$, the growth rates of the three-dimensional oblique waves are of the same order of magnitude as the growth rate of the two-dimensional streamwise waves until
 $\beta < 0.3$, and for smaller values of
 $\beta$, the linear growth rates of the oblique wave disturbance are very similar to the linear growth rates of the two-dimensional disturbance, suggesting a selective frequency filtering mechanism for the vertical buoyancy layer. For a constant
 $\alpha$, the vertical buoyancy layer strongly filters instabilities with large
 $\beta$. From the figure, it is also clear that the vertical buoyancy layer is stable to streamwise-independent disturbances, i.e. disturbances with
 $\alpha = 0$ and
 $\beta \neq 0$ at
 $Re = 200$. It should be noted that this is not a special case for
 $Re = 200$ and the vertical buoyancy layer is always stable to streamwise-independent disturbances (Xiong & Tao Reference Xiong and Tao2017).
Table 2 shows the growth rates predicted by linear stability analysis and the growth rates observed in DNS at  $Re = 200$. From the table, it is clear that the growth rates predicted by linear stability analysis closely match the growth rates observed in DNS, demonstrating that the modes investigated grow due to linear mechanisms during the early stages of transition.
Growth rates predicted by linear stability analysis and growth rates observed in DNS during the early stages of transition for different combinations of  $\alpha$ and
 $\beta$ at
 $Re = 200$.

The contours of constant phase speed are shown in figure 3(b). For a constant spanwise wavenumber  $\beta$, an increase in streamwise wavenumber
 $\alpha$ decreases the phase speed of the instability. The phase speed of an oblique wave with streamwise wavenumber
 $\alpha$ is always less than that of a two-dimensional wave with the same streamwise wavenumber
 $\alpha$. It is observed that the phase speed of the instability is greater than the maximum flow velocity for low streamwise wavenumbers. For example, the constant phase speed contour line of
 $0.33$ in figure 3(b) for
 $\alpha < 0.1$ and
 $\beta < 0.1$ encloses instabilities having phase speeds greater than the maximum flow velocity, which is
 $0.322$ for the current non-dimensionalisation. This behaviour is similar to the phase speeds of marginally unstable two-dimensional buoyancy-driven instabilities at low streamwise disturbances, implying that these three-dimensional oblique waves are buoyancy-driven instabilities (Gill & Davey Reference Gill and Davey1969; McBain et al. Reference McBain, Armfield and Desrayaud2007). It should be noted that similar buoyancy-driven instabilities were also observed in unstratified vertical NCBLs (Nachtsheim & Swigert Reference Nachtsheim and Swigert1965).
The contours of constant frequency are shown in figure 3(c). For a constant spanwise wavenumber  $\beta$, an increase in the streamwise wavenumber
 $\alpha$ increases the frequency of the instability. Correlating this with the constant phase speed contours shown in figure 3(b) suggests that the high-speed buoyancy-driven instabilities are of low frequency, and the low-speed shear-driven instabilities have a higher frequency. The constant frequency contours, especially at high values of
 $\alpha$, are almost vertical lines. This demonstrates that the frequency of the oblique waves (instability waves with
 $\beta \neq 0$) tends to the frequency of the two-dimensional streamwise waves for increasing streamwise wavenumber
 $\alpha$, implying that the angle of the oblique waves has a diminishing effect on the frequency of the instability with increasing streamwise wavenumber.
4. Oblique-mode breakdown
It is evident from § 3 that oblique modes can grow linearly, with certain wavenumber combinations of oblique modes having comparable growth rates to two-dimensional disturbances. Therefore, it is plausible that a pair of oblique modes that grow due to linear mechanisms might attain a finite-amplitude state and cause a transition without any two-dimensional disturbances. This oblique-mode breakdown, or the so-called O-type transition, is demonstrated in this section using DNS.
A pair of symmetric oblique waves is introduced into the flow using (2.11) with different values of  $\alpha$ and
 $\beta$, i.e.
 $(\alpha,+ \beta )$ and (
 $\alpha, - \beta$) oblique waves. After the pair of oblique waves is introduced into the flow, the external oblique waves interact with the flow and generate instability waves due to the receptivity process (Morkovin Reference Morkovin1969). The receptivity of the boundary layer is not investigated in this paper, and only the dynamics of the waves after the receptivity process is investigated. The parameter range of streamwise and spanwise wavenumbers investigated in the current study is shown in Appendix B.
In the vertical buoyancy layer, there are different transition pathways to turbulence depending on the streamwise and spanwise wavenumbers of the initial oblique waves. This section describes the two dominant pathways observed during the O-type transition by examining the O-type transition caused by  $(0.4,\pm 0.4)$ and
 $(0.2,\pm 0.4)$ oblique waves. In § 4.1, the transition caused
 $(0.4,\pm 0.4)$ oblique waves is discussed, where it is shown that streaks dominate the flow field during the initial stages of transition. In § 4.2, the transition caused
 $(0.2,\pm 0.4)$ oblique waves is analysed, where it is shown that two-dimensional streamwise waves dominate the flow field during the initial stages of transition.
4.1. Transition dominated by streaks
The O-type transition initiated by  $(0.4,\pm 0.4)$ oblique waves is scrutinised in this section. First, the evolution of the mean flow during the transition is examined. The mean streamwise velocity and buoyancy fields at different times during the transition are shown in figure 4. The plots in the figure correspond to streamwise velocity and buoyancy fields that are averaged spatially in the homogenous
 $x_2$–
 $x_3$ plane. As the boundary layer flow is unsteady, it is not averaged in time. The averaging procedure is similar to the averaging procedure of Ke et al. (Reference Ke, Williamson, Armfield, Norris and Komiya2020). The mean streamwise velocity and buoyancy fields closely follow the analytic solution at
 $t = 1400$. At
 $t = 1600$, the mean streamwise velocity field exhibits a lower maximum streamwise velocity, and the flow reversal moves away from the wall. With increasing
 $t$, this trend continues with a reduction in maximum streamwise velocity, a smoothing of the velocity profile around the inflexion point present in the outer layer, and the displacement of the flow reversal away from the wall. The mean buoyancy field also experiences this smoothing, with larger regions at the edge of the boundary layer exhibiting negative values of
 $\bar {\vartheta }$, indicating that a higher amount of fluid around the outer layers of the buoyancy layer exhibits a mean temperature that is less than the temperature of the ambient surroundings. The reduction in the maximum flow velocity and the smoothing of the boundary layer is consistent with ensemble-averaged profiles of the turbulent vertical buoyancy layer (Fedorovich & Shapiro Reference Fedorovich and Shapiro2009; Giometto et al. Reference Giometto, Katul, Fang and Parlange2017).
(a) Mean streamwise velocity profile  $\overline {u_2}$ and (b) mean buoyancy field profile
 $\bar {\vartheta }$ during the transition process for
 $(0.4,\pm 0.4)$ oblique waves.

The average wall shear stress and average wall heat flux are also monitored to understand the temporal evolution of transition. The wall shear stress and heat flux are averaged over the full length and width of the heated wall. Following Reddy et al. (Reference Reddy, Schmid, Baggett and Henningson1998), a transition is quantified by sharp peaks in average wall shear stress and wall heat flux. It should be noted that the peaks in average wall shear stress and average wall heat flux need not coincide as it is well known that the buoyancy field and the velocity field can transition at different times (Zhao et al. Reference Zhao, Lei and Patterson2017). For consistency, the average wall-shear-stress peak is considered the transition point.
Figure 5 shows the variation of average wall shear stress and average wall heat flux during the transition initiated by a pair of  $(0.4,\pm 0.4)$ oblique waves. Until
 $t < 1400$, the average wall shear stress and average wall heat flux are approximately equal to the analytic laminar solution's wall shear stress and wall heat flux, suggesting that the amplitude of the instability waves is small enough to avoid mean-flow distortion. The wall shear stress
 $\tau _w$ and wall heat flux
 $\phi _q$ for the laminar analytic solution can be written as
 \begin{gather} \tau_w = \frac{1}{Re}, \end{gather}
 \begin{gather} \phi_q = \frac{1}{Re Pr}, \end{gather}
since at the wall,  $\partial u_2 / \partial x_1$ and
 $\partial \vartheta / \partial x_1$ are equal to 1 and
 $-1$, respectively.
Wall behaviour when streamwise vortices and streaks dominate early transition. (a) Average wall shear stress and (b) average wall heat flux during the transition for  $(0.4,\pm 0.4)$ oblique waves. The shaded regions represent the transition phase.

The variation in the average wall shear stress and wall heat flux until  $t < 1400$ is consistent with the mean flow in figure 4, where it is found to follow the laminar analytic solution closely.
For  $t < 1400$, the oblique waves have a negligible influence on inducing changes to the laminar flow. During this
 $t$, along with experiencing growth due to linear mechanisms, the
 $(\alpha,\pm \beta )$ oblique waves nonlinearly interact to generate higher-order modes to cause a mean flow distortion. Once the amplitudes of the nonlinearly generated modes and nonlinear saturation become dominant,
 $\tau _w$ and
 $\phi _q$ deviate from the analytic solution, which is visible at
 $t > 1400$ in figure 5. This behaviour during transition is qualitatively similar to the observations of Ke et al. (Reference Ke, Williamson, Armfield, McBain and Norris2019) for the vertical temporally evolving unstratified natural convection boundary layer. At
 $t > 1400$, the mean flow in figure 4 begins to deviate from the laminar analytic solution, again consistent with the deviation in the average wall shear stress and average wall heat flux.
At approximately  $t \sim 1900$, there is a sharp peak which indicates that the transition has taken place (Reddy et al. Reference Reddy, Schmid, Baggett and Henningson1998). The mean flow in figure 4 at
 $t > 1900$ is significantly different from the laminar analytic solution, implying strong mean-flow distortion due to nonlinear effects.
Note that it is clear from figure 5 that the average wall shear stress is highest for the laminar flow and decreases during the transition. This implies that the viscous length scale would continuously increase during the transition, demonstrating that determining the mesh size based on the viscous length scale of the laminar analytic solution is a good approximation for DNS of the transitional buoyancy layer.
The amplitudes of the different modes are calculated to identify the dominant modes responsible for the O-type transition. The amplitude of the initial oblique waves and the first level of nonlinearly generated modes are shown in figure 6. The amplitudes are calculated by calculating a two-dimensional Fourier transform of the streamwise velocity and buoyancy fields across a wall-normal plane ( $x_1 = 0.785$) inside the boundary layer. The location of maximum velocity of the laminar flow is at
 $x_1 = 0.785$. Initially, the
 $(0.4,\pm 0.4)$ oblique waves interact with the base flow and grow in amplitude. The
 $(0.4,\pm 0.4)$ oblique waves lie inside the neutral curve in figure 3(a) and should experience growth due to linear mechanisms. The growth rate of the
 $(0.4,\pm 0.4)$ oblique wave obtained from DNS until
 $t < 1400$ is
 $4.486 \times 10^{-3}$, which is similar to the growth rate predicted by linear stability analysis (growth rate predicted by the linear stability analysis is
 $4.638 \times 10^{-3}$), implying that the oblique waves in the DNS linearly interact with the base flow and experience exponential growth.
Amplitudes of the oblique waves and the first level of nonlinearly generated modes for  $(0.4,\pm 0.4)$ oblique wave transition. Solid lines correspond to the amplitudes obtained from DNS. Thin dashed lines correspond to the amplitudes predicted by the nonlinear growth rate model (NM). Thick dot-dashed lines correspond to the amplitudes predicted by linear stability analysis (LSA). Only the modes observed in the streamwise velocity field at
 $x_1 = 0.785$ are shown.

Along with interacting with the base flow, the oblique waves nonlinearly interact with each other to form higher-order modes and cause mean-flow distortion. The initial stages of the nonlinear interactions can be quantified by using the wave–wave interactions given in (4.3a)–(4.3e) (Chang & Malik Reference Chang and Malik1994). In this section, the  $(0.4,\pm 0.4)$ oblique waves are represented with
 $(1,\pm 1)$ for simplicity
 \begin{gather} (1, 1) - (1, - 1) = (0, + 2), \end{gather}
 \begin{gather} (1, + 1) + (1, - 1) = ({+}2, 0), \end{gather}
 \begin{gather} (1, - 1) - (1, + 1) = (0, - 2), \end{gather}
 \begin{gather} (1, + 1) + (1, + 1) = (+ 2, + 2), \end{gather}
 \begin{gather} (1, + 1) - (1, - 1) = (0, 0). \end{gather}
In (4.3), the  $(0,\pm 2)$ modes are referred to as the streak modes or the streamwise vortex modes,
 $(2,0)$ modes are referred to as the harmonic two-dimensional modes, the
 $(2,2)$ modes are referred to as the harmonic oblique waves and the
 $(0,0)$ mode is the mean flow distortion.
For  $(0.4,\pm 0.4)$ oblique waves, the
 $(2,0)$ harmonic two-dimensional mode is the
 $(0.8,0)$ mode, which also lies inside the marginally unstable curve in figure 3(a), meaning that this mode should also experience linear growth. The linear growth rate of
 $(0.8,0)$ mode predicted by linear stability analysis is
 $3.43 \times 10^{-3}$. The
 $(2,2) = (0.8,0.8)$ and
 $(0,\pm 2) = (0,\pm 0.8)$ modes are linearly stable at
 $Re = 200$, which is evident from figure 3(a).
For a purely nonlinear interaction between  $(1,\pm 1)$ oblique waves, the first level of nonlinearly generated modes (the
 $(0,\pm 2)$,
 $(2,0)$ and
 $(2,\pm 2)$ modes) in (4.3) grow with twice the growth rates of the initial oblique waves (Laible & Fasel Reference Laible and Fasel2016), which is discussed in Appendix C. The theoretical growth rates of the first level of nonlinearly generated modes can be observed in DNS during the early stages of transition. At this stage, the flow is only saturated with the initial oblique waves, with the higher-order modes having very small amplitudes. As only oblique waves dominate the flow, dominant interactions would be present between the oblique waves and the mean flow (Laible & Fasel Reference Laible and Fasel2016). Until
 $t < 1400$, the
 $(1,\pm 1)$ oblique waves have a growth rate of
 $4.486 \times 10^{-3}$ and the first level of nonlinearly generated modes, i.e.
 $(2,0)$ and
 $(2,2)$ modes have a growth rate of
 $8.926 \times 10^{-3}$ and
 $8.861 \times 10^{-3}$, respectively. According to the theoretical model presented in Appendix C, the first level of nonlinearly generated modes must have a growth rate of
 $8.972 \times 10^{-3}$, which is twice the DNS growth rate of
 $(1,\pm 1)$ oblique waves. The growth rate observed in DNS is similar to that predicted by the theoretical model, implying that these modes grow mostly due to nonlinear mechanisms. The
 $(2,0)$ modes can also experience growth during the transition due to linear mechanisms. However, it is not reflected in figure 6, suggesting that the
 $(2,0)$ in the present case experiences strong growth due to nonlinear mechanisms than linear mechanisms. The nonlinear growth rate being higher than the linear growth rate supports the observed behaviour, which is discussed in Appendix C.
From figure 6, the  $(0,\pm 2)$ modes initially grow according to the predicted amplitude but soon diverge and have increased growth rates at
 $t > 1000$. The amplitude of
 $(0,\pm 2)$ modes becomes greater than that of
 $(2,0)$ modes and the initially perturbed oblique waves at
 $t \sim 1400$. For these wavenumber combinations, the growth of
 $(0,\pm 2)$ modes supersedes the growth of
 $(2,0)$ modes and the initially perturbed oblique waves. This can be explained if higher levels of nonlinear interactions are considered. The nonlinearly generated streamwise vortices, streaks and harmonic two-dimensional streamwise waves also nonlinearly interact with the initial oblique waves. The nonlinear interactions between oblique waves and the first level of nonlinearly generated modes to generate the second level of higher-order nonlinearly generated modes can be quantified using the following nonlinear wave–wave interactions:
 \begin{gather} (1,1) + (2,2) = (3,3), \end{gather}
 \begin{gather} (2,0) + (1,1) = (3,1), \end{gather}
 \begin{gather} (2,0) + (1,-1) = (3,-1), \end{gather}
 \begin{gather} (0,2) + (1,1) = (1,3), \end{gather}
 \begin{gather} (0,-2) + (1,-1) = (1,-3). \end{gather}
The amplitude of the various modes during the transition caused by  $(0.4,\pm 0.4)$ oblique waves is shown in figure 7. The amplitude of the different modes in the buoyancy field is also shown in this figure, highlighting the similarities in the amplitudes of the modes in the streamwise velocity and buoyancy fields.
Temporal development of  $u_2$ and
 $\vartheta$ disturbance amplitude for different wavenumbers at a wall-normal distance
 $x_1 = 0.785$;
 $(1,1) = (0.4,\pm 0.4)$ and the rest are multiples of
 $(0.4,\pm 0.4)$. Thick solid black, red and blue solid lines represent the
 $u_2$ disturbance; thin dot-dashed black, green and magenta lines represent the
 $\vartheta$ disturbance.

The growth of modes arising from the nonlinear interactions between the oblique waves and streamwise vortices, harmonic oblique waves and harmonic two-dimensional waves are shown in figure 7(b) ((4.4a)–(4.4e)). The nonlinear interaction between streaks and initial oblique waves generates oblique waves having thrice the original spanwise wavenumber, i.e. oblique waves with  $(1,\pm 3)$ wavenumbers, and oblique waves having thrice the original streamwise wavenumber, i.e. oblique waves with
 $(3,\pm 1)$ wavenumbers. The amplitude of the
 $(1,\pm 3)$ modes is comparable to the amplitude of the initial oblique waves at
 $t \sim 1500$, which is around the same time the amplitude of the streaks starts to become larger than the amplitude of the initial oblique waves. The
 $(3,\pm 1)$ modes (
 $(1.2,\pm 0.4)$), on the other hand, grow to the same amplitudes as the
 $(1,\pm 3)$ modes (
 $(0.4,\pm 1.2)$) only at
 $t \sim 2500$. Before this
 $t$, the amplitude of
 $(1,\pm 3)$ modes is at least an order of magnitude smaller than
 $(3,\pm 1)$ modes.
Comparing figures 7(a) and 7(b), it can be deduced that at  $t \sim 1200$, the amplitude of the
 $(1,\pm 3)$ modes is comparable to the amplitude of the
 $(0,\pm 2)$ modes. At this time, it is plausible that the
 $(1,\pm 3)$ modes are nonlinearly interacting with the
 $(1,\pm 1)$ modes to generate
 $(0,\pm 2)$ modes. This, combined with the first level of nonlinear interactions and non-modal growth mechanisms if present, is believed to cause the increase in the growth rate of the
 $(0,2)$ mode. It should be noted that the streamwise vortex mode is known to exhibit non-modal growth in incompressible and compressible boundary layers (Schmid & Henningson Reference Schmid and Henningson1992; Hanifi et al. Reference Hanifi, Schmid and Henningson1996; Schmid Reference Schmid2007). The reader is referred to Xiong & Tao (Reference Xiong and Tao2017) on transient non-modal growth in buoyancy layers.
Interestingly, this increased growth rate of the  $(0,\pm 2)$ modes observed in the streamwise velocity field is not observed in the temperature field at
 $x_1 = 0.785$, with the
 $(0,\pm 2)$ and
 $(2,0)$ modes having similar growth rates until
 $t < 1400$. This is the case as the
 $(1,\pm 3)$ modes in the temperature field have much lower amplitudes and their interactions with the
 $(1,\pm 1)$ modes do not significantly alter the growth rates of the
 $(0,\pm 2)$ modes in the temperature field.
The  $(1,0)$ and
 $(0,\pm 1)$ modes (shown in figure 7c) are not a result of the nonlinear wave–wave interactions between the pair of initial oblique waves but are a consequence of the limited machine precision (Mayer et al. Reference Mayer, Von Terzi and Fasel2011). These modes grow and interact nonlinearly with the oblique waves to generate
 $(2,\pm 1)$ and
 $(1,\pm 2)$ modes (shown in figure 7d). They also interact with streaks and harmonic two-dimensional waves during the transition process. For the present case
 $(1,0)$ and
 $(0,\pm 1)$ modes are
 $(0.4,0)$ and
 $(0,\pm 0.4)$;
 $(2,1)$ and
 $(1,\pm 2)$ modes are
 $(0.8,\pm 0.4)$ and
 $(0.4,\pm 0.8)$ modes. This effect of noise generated by limited machine precision can be qualitatively related to unavoidable small-amplitude white noise generated in experiments (Mayer et al. Reference Mayer, Von Terzi and Fasel2011).
By comparing the wall behaviour in figure 5 and the temporal development of modes in figures 6 and 7, it can be inferred that a sharp peak in the average wall shear stress and the average wall heat flux correlates with the peak in the amplitude of  $(0,2)$ modes, indicating that the transition process in the present case is related to the breakdown of streaks. At
 $t \sim 2100$, the amplitudes of several modes become comparable to the amplitude of the initial oblique waves, and it is at this time, the flow has transitioned to a turbulent state. The various modes reach saturation when the amplitude is of the order of magnitude of
 $10^{-2}$. The transition observed here is similar to the transition pathway observed in channel flow (Reddy et al. Reference Reddy, Schmid, Baggett and Henningson1998). However, it should be noted that the transition is subcritical in the case of channel flow, whereas here, it is supercritical, with the initial oblique waves being linearly unstable. Supercritically, it is similar to the oblique mode breakdown of compressible flat-plate boundary layers (Chang & Malik Reference Chang and Malik1994; Mayer et al. Reference Mayer, Von Terzi and Fasel2011).
The flow field at  $t = 1600$ at three different locations is shown in figure 8. This
 $t$ corresponds to the time when nonlinear interactions have started to become dominant, evident from figure 7. At this time, at
 $x_1 = 0.785$, the amplitude of the streaks and harmonic two-dimensional waves is greater than the amplitude of the oblique waves (see figure 7a). The streamwise velocity field exhibits streamwise vortices and streaks as these modes have greater amplitudes than the harmonic two-dimensional waves’ amplitudes. The streamwise velocity field is dominated by streamwise vortices close to the wall (
 $x_1 = 0.28$). In contrast, at the location of maximum flow velocity (
 $x_1 = 0.785$), the streamwise vortices give rise to streaks and dominate the flow field. The streamwise vortices near the wall transport fluid from regions close to the wall to the outer layers and bring fluid from the outer to the inner layers. As the fluid is transported to the outer layers, the streamwise vortices merge due to mean shear and give rise to streaks. In the outer layer (
 $x_1 = 4.3$), a streaky structure is observed in the streamwise velocity and buoyancy field.
Flow field at  $t = 1600$ when perturbed by
 $(0.4,\pm 0.4)$ oblique waves. (a) Streamwise velocity field and (b) buoyancy field at
 $x_1 = 4.5$; (c) streamwise velocity field and (d) buoyancy field at
 $x_1 = 0.785$; (e) streamwise velocity field and (f) buoyancy field at
 $x_1 = 0.28$. Note that the contour magnitude is different in the figures.

4.1.1. Secondary flow when steaks dominate transition
Secondary flows consisting of longitudinal vortex systems are present in unstratified vertical NCBLs during a transition initiated by two-dimensional waves and three-dimensional disturbances (Jaluria & Gebhart Reference Jaluria and Gebhart1973; Zhao et al. Reference Zhao, Lei and Patterson2017). Secondary flows are also observed during the O-type transition in the vertical buoyancy layer. The spanwise velocity averaged along the entire streamwise length of the domain across an  $x_1$–
 $x_3$ plane at different
 $t$ is shown in figure 9. Only one wavelength
 $2 {\rm \pi}/ \beta$ is shown in the spanwise direction. At
 $t = 1600$, the mean spanwise velocity changes sign twice, signifying the presence of a regular single longitudinal vortex system. The inner spanwise velocity roll is concentrated on the outer boundary layer, while the outer spanwise velocity roll extends into the bulk. The outer roll brings the cold fluid from the bulk towards the boundary layer, while the inner roll redistributes the fluid displaced by the outer roll and the hotter fluid adjacent to the wall. The inner roll begins to distort at
 $t = 1700$ and at
 $t = 1800$ a double longitudinal vortex system begins to emerge. This vortex system is generated between the vertical surface and the inner roll of the single longitudinal vortex system. It redistributes fluid around the inner boundary layer, i.e. the region between the wall and the velocity maximum. A clear double vortex longitudinal vortex system is observed at
 $t = 1900$. The outer roll stretches into the bulk and promotes mixing. The spanwise wavenumber of the longitudinal vortex system is twice the spanwise wavenumber of the initial oblique waves during the entire transition.
Mean spanwise velocity at different times during the transition initiated by  $(0.4,\pm 0.4$) oblique waves. The spanwise velocity field averaged along the entire streamwise length of the domain across an
 $x_1$–
 $x_3$ plane is represented using
 $\widetilde {u_3}$; (a)
 $t = 1600$, (b)
 $t = 1700$, (c)
 $t = 1800$, (d)
 $t = 1900$.

4.2. Transition dominated by two-dimensional waves
Unlike the O-type transition in several incompressible and compressible flat-plate boundary layer flows, the streaks or streamwise vortex modes do not always dominate the flow field during the oblique-mode breakdown. The transition pathway observed for  $(0.2,\pm 0.4)$ oblique waves demonstrates an alternate route and is discussed in this section.
The mean velocity and buoyancy profiles are shown in figure 10. The mean profiles are obtained by spatially averaging the flow in the homogenous plane ( $x_2$–
 $x_3$ plane) at each
 $t$. Qualitative similarities with the mean-flow evolution in figure 4 are immediately evident. During the initial stages of transition, the mean flow closely follows the analytic solution, and with an increase in
 $t$, the velocity peaks in figure 10(a) become smaller. The mean flow begins to distort at
 $t \geq 1560$, and it is at this stage that nonlinear interactions are non-negligible. The deviation in the mean flow is only marginal until
 $t = 2080$, and at
 $t \geq 2340$, the mean streamwise velocity and buoyancy fields significantly deviate from the analytic solution, implying dominant mean-flow distortion due to nonlinear effects. It should be noted that the mean flow during the transition is qualitatively similar to the ensemble-averaged mean flow of turbulent vertical buoyancy layers (Fedorovich & Shapiro Reference Fedorovich and Shapiro2009; Giometto et al. Reference Giometto, Katul, Fang and Parlange2017).
(a) Mean streamwise velocity profile  $\overline {u_2}$ and (b) mean buoyancy field profile
 $\bar {\vartheta }$ during the transition phase for
 $(0.2,\pm 0.4)$ oblique waves.

The wall behaviour during the oblique-mode breakdown of  $(0.2,\pm 0.4)$ waves is shown in figure 11. The average wall shear stress and wall heat flux are computed by averaging along the full length and width of the heated wall. It is immediately evident that the wall behaviour differs from the wall behaviour shown in figure 5. Until
 $t < 1300$, the average wall shear stress and average wall heat flux are approximately equal to the laminar analytic solution, indicating that the amplitude of the modes is small enough to avoid mean-flow distortion. The average wall shear stress and average wall heat flux begin to deviate from the analytic solution at
 $t > 1300$, implying the onset of mean-flow distortion. The wall behaviour is consistent with the mean flow in figure 10 with the mean flow also deviating from the analytic solution at
 $t > 1300$. The average wall heat flux and average wall-shear-stress plateau from
 $t \sim 1500$ to
 $t \sim 2100$ and exhibit a sharp peak at
 $t \sim 2400$. This sharp peak is referred to as the transition point (Reddy et al. Reference Reddy, Schmid, Baggett and Henningson1998). The plateau is a characteristic feature of this transition pathway. Correlating figures 11 and 10, it can be inferred that the minimal mean-flow distortion from
 $t \sim 1500$ to
 $t \sim 2100$ causes the average wall shear stress and average wall heat flux to plateau and only significant distortions mean flow cause significant deviation in the average wall shear stress and average wall heat flux.
Wall behaviour when two-dimensional waves dominate the flow. (a) Average wall shear stress and (b) average wall heat flux during the transition process for  $(0.2,\pm 0.4)$ oblique waves. The shaded regions represent the transition phase.

The amplitudes of the initial oblique waves and the first level of nonlinearly generated modes are shown in figure 12. The amplitudes of the modes during the transition initiated by  $(0.2,\pm 0.4)$ oblique waves are calculated by taking a two-dimensional Fourier transform of the streamwise velocity and buoyancy fields across a wall-normal plane (
 $x_1 = 0.785$) inside the boundary layer. For simplicity, the
 $(0.2,\pm 0.4)$ oblique waves are represented using
 $(1,\pm 1)$ modes from hereon. The
 $(0.2,\pm 0.4)$ modes nonlinearly interact with each other to generate the first level of nonlinearly generated modes, similar to the
 $(0.4,\pm 0.4)$ oblique waves (following (4.3)).
Amplitudes of the oblique waves and the first level of nonlinearly generated modes for  $(0.2,\pm 0.4)$ oblique wave transition. Solid lines correspond to the amplitudes obtained from DNS. Thin dashed lines correspond to the amplitudes predicted by the nonlinear growth rate model (NM). Thick dot-dashed lines correspond to the amplitudes predicted by linear stability analysis (LSA). Only the modes observed in the streamwise velocity field at
 $x_1 = 0.785$ are shown.

Linear theory shows that the  $(0.2,\pm 0.4)$ oblique waves are unstable and grow at
 $\phi = 1.989 \times 10^{-3}$ with
 $\omega = 4.239 \times 10^{-2}$. It should be noted that
 $(0.2,\pm 0.4)$ oblique waves experience lower linear growth rates compared with
 $(0.4,\pm 0.4)$ oblique waves. From the DNS results in figure 12, it is observed that these waves grow with
 $\phi = 1.936 \times 10^{-3}$, implying that the modes mostly experience linear growth. Interestingly, despite the initial oblique waves having lower growth rates than
 $(0.4,\pm 0.4)$ oblique waves, the mean-flow distortion appears earlier during the transition. For
 $(0.2,\pm 0.4)$ oblique waves, the onset of mean-flow distortion occurs at
 $t \sim 1300$ while for
 $(0.4,\pm 0.4)$ oblique waves, it occurs at
 $t \sim 1400$.
For a purely nonlinear interaction, the first level of nonlinearly generated modes, shown in figure 12, should have twice the growth rates of the initial oblique waves (see Appendix C). As the  $(1, \pm 1)$ modes have a growth rate
 $\phi = 1.936 \times 10^{-3}$, the first level of nonlinearly generated modes must have a growth rate
 $\phi = 3.872 \times 10^{-3}$. Until
 $t < 1500$, the growth rates of the
 $(0,\pm 2)$ modes and the
 $(2,2)$ modes are
 $3.896 \times 10^{-3}$ and
 $3.855 \times 10^{-3}$, respectively. These growth rates are approximately twice the growth rates of the initial oblique waves, agreeing with the theoretical model. It should be noted that the
 $(0,\pm 2)$ and
 $(2,\pm 2)$ modes are linearly stable (evident from figure 3a). As the growth rates of the
 $(0,\pm 2)$ are similar to the growth rates of the nonlinear theoretical model, it is conjectured that the non-modal transient growth of the streak modes is not significant in the present case. If the non-modal growth were to be significant, the streak modes would have grown much faster than the predicted nonlinear growth rate (Schmid & Henningson Reference Schmid and Henningson1992; Reddy et al. Reference Reddy, Schmid, Baggett and Henningson1998; Berlin et al. Reference Berlin, Wiegel and Henningson1999; Levin et al. Reference Levin, Davidsson and Henningson2005). The non-modal transient growth, if present, might only have a significant effect on influencing the initial amplitude of the
 $(0,\pm 2)$, similar to the continuous transient growth observed in compressible boundary layers (Laible & Fasel Reference Laible and Fasel2016). The non-modal growth of the nonlinearly generated modes is outside the scope of the current study.
Interestingly, the growth rate of the  $(2,0)$ modes is significantly greater than the growth rates predicted by the nonlinear analysis. In DNS, the
 $(2,0)$ modes grow with
 $\phi = 9.89 \times 10^{-3}$, which is
 $2.55$ times greater than the growth rate of the nonlinear theoretical model. Similar to the
 $(0.8,0)$ harmonic two-dimensional waves in § 4.1, the
 $(2,0) = (0.4,0)$ modes in this case can experience both linear and nonlinear growth. According to linear theory, the
 $(0.4,0)$ modes have a growth rate of
 $1.01 \times 10^{-2}$, which is greater than the predicted nonlinear growth. The
 $(0.4,0)$ mode in figure 12 has a growth rate of
 $9.89 \times 10^{-3}$ until
 $t < 1500$, closely matching the linear growth rate. This demonstrates that the
 $(2,0)$ modes in the present case, despite being nonlinearly generated due to the interaction between a pair of oblique waves, experience rapid growth due to linear mechanisms. This is the case as the linear growth rate is greater than the nonlinear growth rate of these modes. It should be noted that the
 $(2,0)$ modes grow due to both linear and nonlinear mechanisms. However, the growth rate of the
 $(2,0)$ modes can be well approximated using only the linear growth rate because the linear growth rate is significantly greater than the nonlinear growth rate (see Appendix C).
The dynamics of different modes in the streamwise velocity and temperature fields at  $x_1 = 0.785$ during the transition process for
 $(0.2,\pm 0.4)$ modes is shown in figure 13. The harmonic two-dimensional streamwise waves grow to amplitudes that are three orders of magnitude larger than streaks, which is evident at
 $t \sim 1500$ in figure 13. At
 $t \sim 1000$, the harmonic two-dimensional waves have amplitudes larger than the initial oblique waves. The plateau observed in average wall shear stress and average wall heat flux in figure 11 is due to the nonlinear saturation of the harmonic two-dimensional streamwise waves. The transition has not occurred until
 $t < 2300$.
Temporal development of  $u_2$ and
 $\vartheta$ disturbance amplitude for different wavenumbers at a wall-normal distance
 $x_1 = 0.785$ at
 $t = 1413$. Here,
 $(1,1) = (0.2,\pm 0.4)$ and the rest are multiples of
 $(0.2,\pm 0.4)$. Thick solid black, red and blue solid lines represent the
 $u_2$ disturbance; thin dot-dashed black, green and magenta lines represent the
 $\vartheta$ disturbance.

The amplitude of the harmonic two-dimensional streamwise waves saturates at  $t \sim 1500$, and at this point, there is significant energy transfer into
 $(0,\pm 2)$ modes. From this
 $t$, the streak modes grow with higher growth rates than earlier, as there is an increased energy transfer into these modes. It should be noted that similar growth rates are observed for the
 $(0,\pm 2)$ modes in the streamwise velocity and buoyancy fields for
 $(0.2,\pm 0.4)$ oblique waves, unlike the O-type transition caused by
 $(0.4,\pm 0.4)$ oblique waves.
Significant imbalances in energy transfer in  $(3, \pm 1)$ and
 $(1, \pm 3)$ modes are also present, which arise from nonlinear interactions between oblique waves, harmonic two-dimensional waves and streaks (see figure 13b). As the harmonic two-dimensional waves grow much faster than the streaks, there is greater energy transfer to the
 $(3, \pm 1)$ modes; hence, its amplitude is around two orders of magnitude higher than
 $(1, \pm 3)$ modes. For the present case, linear mechanisms also aid the growth of
 $(3, \pm 1)$ modes initially as the oblique wave
 $(0.6,\pm 0.4)$ (
 $(0.4,0) + (0.2,\pm 0.4) = (0.6,\pm 0.4)$) lies inside the neutral curve. Again, at
 $t \sim 1500$, there is a significant shift in the growth of modes with now nonlinear mechanisms favouring the rapid growth of
 $(1, \pm 3)$ modes, which is a consequence of the rapid growth of
 $(0,\pm 2)$ streak modes.
The peak in figure 11 is observed at  $t \sim 2400$, and it is at this point that the flow breaks down into smaller structures, and the transition has taken place. By correlating this peak to the growth of modes in figure 13, it is clear that the peak can be associated with the peak observed in the amplitude of
 $(0,\pm 2)$ streak mode, implying that the transition is related to the breakdown of streaks or streamwise vortex modes.
Similar to the transition observed for  $(0.4,\pm 0.4)$ oblique waves, modes that are not direct descendants of the nonlinear wave–wave interactions are observed, which is a consequence of limited machine precision (Mayer et al. Reference Mayer, Von Terzi and Fasel2011). The dynamics of these modes and their interaction with the initial oblique waves are shown in figure 13(c,d). Such transition is also observed during the oblique-mode breakdown of
 $(0.2,\pm 0.1)$,
 $(0.2, \pm 0.2)$,
 $(0.3,\pm 0.5)$ oblique waves (not shown for brevity).
The flow field at two different wall-normal locations at  $t = 1413$ is shown in figure 14. The amplitudes of the nonlinearly generated modes are nonnegligible at this time. The streamwise velocity and reduced temperature fields are correlated. Both fields exhibit flow structures resembling two-dimensional waves, demonstrating that the initial stages of transition are dominated by two-dimensional waves for these streamwise and spanwise wavenumbers. Two-dimensional waves are also observed close to the wall, unlike streaks which are only dominant away from the wall (see figure 8).
Flow field at  $t = 1413.6$ when perturbed by
 $(0.2,\pm 0.4)$ oblique waves. (a) Streamwise velocity field; (b) buoyancy field at
 $x_1 = 0.785$; (c) streamwise velocity field (d) buoyancy field at
 $x_1 = 0.28$. Two-dimensional waves are present close to the wall and away from the wall. Note that the contour magnitude is different in the figures.

Therefore, a pair of oblique waves with small amplitude can cause a supercritical transition in the vertical buoyancy layer by forming streaks or harmonic two-dimensional streamwise waves during the early stages of transition. In the transition caused by  $(0.2,\pm 0.4)$ oblique waves, the oblique waves nonlinearly interact with each other to generate
 $(0.4,0)$ two-dimensional waves, and these waves linearly can grow with
 $\phi = 1.011 \times 10^{-2}$. However, in the O-type transition initiated by
 $(0.4,\pm 0.4)$ oblique waves, the nonlinearly generated
 $(0.8,0)$ two-dimensional waves can linearly grow with
 $\phi = 3.432 \times 10^{-3}$. In both cases, the nonlinear effects aid the formation of two-dimensional streamwise waves. However, for
 $(0.2,\pm 0.4)$ oblique waves, the nonlinear growth of the two-dimensional waves is aided by the strong linear growth (the linear growth of
 $(0.8,0)$ modes is around an order of magnitude larger than the linear growth of
 $(0.4,0)$ modes) during the early stages of transition. Hence, two-dimensional streamwise waves dominate the early stages of transition initiated by
 $(0.2,\pm 0.4)$ oblique waves, unlike the O-type transition initiated by
 $(0.4,\pm 0.4)$ oblique waves. It should be noted that the nonlinearly generated streak modes do not experience linear growth as these modes are always linearly stable (Xiong & Tao Reference Xiong and Tao2017).
This demonstrates that two-dimensional streamwise waves can dominate the flow field during the early stages of the O-type transition of the vertical buoyancy layer if the growth of the nonlinearly generated modes is aided by the strong linear growth of the corresponding modes. This is in stark contrast to the O-type transition commonly reported in incompressible and compressible flat-plate boundary layer flows, where streaks always seem to dominate the flow (Berlin et al. Reference Berlin, Lundbladh and Henningson1994, Reference Berlin, Wiegel and Henningson1999; Chang & Malik Reference Chang and Malik1994; Mayer et al. Reference Mayer, Von Terzi and Fasel2011; Levin et al. Reference Levin, Davidsson and Henningson2005). Despite this, in both cases, the transition is related to the breakdown of streak modes in the late stages.
At  $Re = 200$, streamwise vortices and streaks dominate the early transition if the initial oblique waves have relatively large streamwise wavenumbers (streamwise wavenumbers towards the right of the neutral curve in figure 3a). However, harmonic two-dimensional streamwise waves primarily dominate the flow field during the early stages of transition if the initial oblique waves have relatively small streamwise wavenumbers (streamwise wavenumbers towards the left of the neutral curve in figure 3a). This is the case as after the initial nonlinear interactions, oblique waves having low streamwise wavenumbers produce harmonic two-dimensional streamwise waves that are linearly unstable with substantial growth rates, which aid in the rapid growth of nonlinear modes.
Although a pair of oblique waves initiate the transition, some of the stages of this transition route are qualitatively similar to the H-type transition observed in several other flat plate boundary layer flows (Kachanov & Levchenko Reference Kachanov and Levchenko1984; Berlin et al. Reference Berlin, Lundbladh and Henningson1994, Reference Berlin, Wiegel and Henningson1999; Sayadi et al. Reference Sayadi, Hamman and Moin2013). In the classical H-type transition, a two-dimensional wave having streamwise wavenumber  $2 \alpha$ nonlinearly interacts with three-dimensional oblique waves
 $(\alpha,\pm \beta )$ to form staggered
 $\varLambda$ vortices and cause a transition. This is the case as similar nonlinear interactions between a two-dimensional wave with streamwise wavenumber
 $2 \alpha$ and three-dimensional oblique waves with wavenumbers
 $(\alpha,\pm \beta )$ exist during the O-type transition. The similarity between H-type and O-type transition was also observed in the Blasius boundary layer (Berlin et al. Reference Berlin, Wiegel and Henningson1999).
4.2.1. Secondary flow when two-dimensional waves dominate transition
The mean spanwise velocity at different time instants is shown in figure 15. The spanwise velocity is averaged along the entire streamwise length of the domain across an  $x_1$–
 $x_3$ plane. Similar to figure 9, only one spanwise wavelength of the initial oblique wave
 $2 {\rm \pi}/ \beta$ is shown. Initially, a double longitudinal vortex system (the mean spanwise velocity changes sign three times) with minimal magnitude is present. However, at
 $t = 2200$, there is a single longitudinal vortex system (the mean spanwise velocity changes sign two times) whose magnitude is similar to the single longitudinal vortex system shown in figure 9. At this time, the amplitude of the streak modes is greater than the amplitude of the two-dimensional waves. At
 $t = 2400$, an additional vortex system is present. The inner vortex system is observed in the inner boundary layer, the intermediate vortex is observed in the outer boundary layer, and the outer vortex system extends into the bulk, similar to the vortex system in figure 9(d). Similar to the secondary flows observed when streaks dominated the flow, these secondary flows also promote mixing. The spanwise wavenumber of the vortex system is again twice the wavenumber of the oblique wave. Interestingly, it is similar to the H-type transition vortex system observed in unstratified spatially developing vertical natural convection boundary layers (Zhao et al. Reference Zhao, Lei and Patterson2017), implying similarities between H-type and O-type transitions of NCBLs.
Mean spanwise velocity at different times during the transition initiated by  $(0.2,\pm 0.4)$ oblique waves showing the presence of a longitudinal vortex system. The spanwise velocity field averaged along the entire streamwise length of the domain across an
 $x_1$–
 $x_3$ plane is represented using
 $\widetilde {u_3}$; (a)
 $t = 1800$, (b)
 $t = 2000$, (c)
 $t = 2200$, (d)
 $t = 2400$.

5. Turbulence statistics during oblique-mode breakdown
To understand the turbulence generation during the O-type transition, the full nonlinear Navier–Stokes equations in (2.1) are written as a mean flow (represented using  $\overline {u_i},\bar {p},\bar {\vartheta }$) and perturbation (represented using
 $\hat {u}_i,\hat {p},\hat {\vartheta }$), based on Reynolds decomposition (Giometto et al. Reference Giometto, Katul, Fang and Parlange2017). The mean flow corresponds to the flow averaged in the spatially homogenous
 $x_2$–
 $x_3$ plane.
The mean turbulent kinetic energy (TKE =  $1/2 \langle \hat {u}_i \hat {u}_i \rangle$) and buoyancy variance (
 $\langle \hat {\vartheta }\hat {\vartheta } \rangle$) at different times during the transition resulting from
 $(0.4, \pm 0.4)$ and
 $(0.2,\pm 0.4)$ oblique waves are shown in figure 16. The averaged fields in the homogenous
 $x_2$–
 $x_3$ plane is represented using
 $\langle {\cdot } \rangle$. The mean quantities are not averaged in time as the flow is unsteady.
Variation of TKE and  $\langle \hat {\vartheta }\hat {\vartheta } \rangle$ during O-type transition: (a) TKE
 $1/2 \langle \widehat {u_i}\widehat {u_i}\rangle$ and (b) buoyancy variance
 $\langle \hat {\vartheta }\hat {\vartheta } \rangle$ during the transition process for
 $(0.4,\pm 0.4)$. (c) The TKE
 $1/2 \langle \widehat {u_i}\widehat {u_i}\rangle$ and (d) buoyancy variance
 $\langle \hat {\vartheta }\hat {\vartheta } \rangle$ during the transition process for
 $(0.2,\pm 0.4)$.

During the initial stages of transition, there is minimal TKE and  $\langle \hat {\vartheta }\hat {\vartheta } \rangle$, and over time, there is a rapid growth of TKE and
 $\langle \hat {\vartheta }\hat {\vartheta } \rangle$. The small peaks in TKE and
 $\langle \hat {\vartheta }\hat {\vartheta } \rangle$ are observed in the outer layer of the vertical buoyancy layer. Most of
 $\langle \hat {\vartheta }\hat {\vartheta } \rangle$ is present close to the wall. In contrast, most of TKE is concentrated around the outer boundary layer, which is qualitatively similar to the distribution of TKE and
 $\langle \hat {\vartheta }\hat {\vartheta } \rangle$ for the turbulent vertical buoyancy layer (Giometto et al. Reference Giometto, Katul, Fang and Parlange2017). Peaks in TKE profiles are concentrated where
 $\bar {\vartheta }$ is zero, implying that more TKE is produced when the temperature is zero. Two peaks are visible
 $\langle \hat {\vartheta }\hat {\vartheta } \rangle$ during late stages of transition. The first large peak is close to the wall and is located approximately where the flow velocity is maximum. The second peak is around regions where the flow velocity is zero, the shear zone between the boundary layer flow and the flow reversal.
There are subtle differences between the TKE of  $(0.4,\pm 0.4)$ oblique-mode breakdown and
 $(0.2,\pm 0.4)$ oblique-mode breakdown. For
 $(0.4,\pm 0.4)$ oblique waves, there is a rapid growth of TKE during the initial stages with a single peak around the outer boundary layer. On the other hand, the TKE for
 $(0.2,\pm 0.4)$ oblique waves features two distinct peaks during the early stages of transition, with one peak concentrated around the inner boundary layer. This peak corresponds to the time when two-dimensional waves dominate the fluid flow, suggesting that when two-dimensional waves dominate the flow, there is a reasonable amount of turbulence production in the inner boundary layer close to the wall. It also correlates with the inner longitudinal roll (secondary mean flow shown in figure 15) observed during the early stages of transition. On the other hand, the buoyancy variance is qualitatively similar in both cases, with one large peak near the maximum flow velocity.
To determine the dynamics of TKE production during O-type transition, the shear ( $P_S$) and buoyancy (
 $P_B$) contributions to the production of TKE are calculated and are shown in figure 17. Here,
 $P_S$ and
 $P_B$ are calculated using
 \begin{gather} P_S ={-}\langle \widehat{u_2} \widehat{u_1} \rangle \frac{\partial \overline{u_2}}{\partial x_1}, \end{gather}
 \begin{gather} P_B = \frac{2}{Re}\langle \hat{\vartheta} \widehat{u_2} \rangle, \end{gather}
which result from the Reynolds decomposition of the momentum equation. It should be noted that streamwise 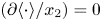 $(\partial \langle {\cdot } \rangle / x_2) = 0$ and spanwise homogeneity
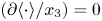 $(\partial \langle {\cdot } \rangle / x_3) = 0$, and negligible subsidence is assumed (Giometto et al. Reference Giometto, Katul, Fang and Parlange2017).
The TKE production during O-type transition. (a) Shear production and (b) buoyancy production during the transition initiated by  $(0.4,\pm 0.4)$ oblique waves. (c) Shear production and (d) buoyancy production during the transition initiated by
 $(0.2,\pm 0.4)$ oblique waves.

For  $Pr = 0.71$, most of the TKE produced is due to shear, which is evident from the magnitudes of
 $P_S$ and
 $P_B$ in figure 17. It should be noted that the peaks in TKE in figure 16(a,c) correlate to the peaks in figure 17(a,c). The shear-dominated TKE is similar to the shear-dominated TKE observed for instability waves for
 $Pr < 2$ in two-dimensional differentially heated cavities (Janssen & Armfield Reference Janssen and Armfield1996). This is in contrast to the K-type and H-type transition of spatially developing unstratified vertical natural convection and mixed convection boundary layer for
 $Pr = 7$ where buoyancy contributes more to TKE than shear (Chen & Chung Reference Chen and Chung2002; Zhao et al. Reference Zhao, Lei and Patterson2017). This demonstrates that the TKE production is dominated by shear for low Prandtl number fluids. In contrast, it is dominated by buoyancy for high Prandtl number fluids.
The value of  $P_S$ has localised peaks in the outer layers of the buoyancy layer during the initial stages, which broaden and encompass the flow reversal and the bulk flow during the late stages of transition. Also,
 $P_B$ exhibits regions of positive and negative values, which signify the sources and sinks of TKE (Giometto et al. Reference Giometto, Katul, Fang and Parlange2017).
During the transition initiated by  $(0.4,\pm 0.4)$ oblique waves, the positive peaks of
 $P_B$ are much closer to the wall than the positive peaks of
 $P_S$. Positive peaks in
 $P_B$ are concentrated in regions where the flow velocity is maximum. The negative peaks in
 $P_B$ are located around the outer boundary layer, flow reversal and the bulk. Here,
 $P_B$ acts as a sink for TKE. However, during the transition initiated by
 $(0.2,\pm 0.4)$ oblique waves,
 $P_B$ close to the wall has negative values during the early stages of transition, which indicates that close to the wall, when two-dimensional waves dominate the flow,
 $P_B$ acts as a sink for TKE. The times at which
 $P_B$ acts as a sink near the wall also correlate with the times when a longitudinal secondary mean flow in the inner boundary layer is observed during the transition (see figure 15). During the late stages of transition, the
 $P_B$ sink near the wall vanishes and a sink in the outer layer, flow reversal and the bulk flow emerge. It is qualitatively similar to the
 $P_B$ observed during the transition initiated by
 $(0.4,\pm 0.4)$ oblique waves.
The integral values of mean Reynolds stresses ( $(1/L_x) \int _{x_1 = 0}^{x_1 \to \infty } \langle \hat {u}_1\hat {u}_1 \rangle \partial x_1$,
 $(1/L_x) \int _{x_1 = 0}^{x_1 \to \infty } \langle \hat {u}_2\hat {u}_2 \rangle \partial x_1$,
 $(1/L_x) \int _{x_1 = 0}^{x_1 \to \infty } \langle \hat {u}_3\hat {u}_3 \rangle \partial x_1$ and
 $(1/L_x) \int _{x_1 = 0}^{x_1 \to \infty } \langle \hat {u}_1\hat {u}_2 \rangle \partial x_1$) are shown in figure 18. The wall-normal length of the domain is represented using
 $L_x$. The integral values of
 $\langle \hat {u}_2\hat {u}_2 \rangle$ is around an order of magnitude higher than
 $\langle \hat {u}_1\hat {u}_1 \rangle$ and
 $\langle \hat {u}_3\hat {u}_3 \rangle$ during the transition caused by both
 $(0.4,\pm 0.4)$ and
 $(0.2,\pm 0.4)$ oblique waves. As TKE is proportional to the trace of the Reynolds stress tensor, it can be concluded that the streamwise Reynolds normal stress is the major contributor to TKE, which is expected in boundary layer flows.
Integral Reynolds stresses during the transition initiated by (a)  $(0.4,\pm 0.4)$ oblique waves and (b)
 $(0.2,\pm 0.4)$ oblique waves.

In figure 18(a), initially, when the oblique waves grow linearly, and the nonlinear effects are negligible, the integral spanwise Reynolds normal stress has a greater magnitude than the integral wall-normal Reynolds normal stress and the Reynolds shear stress. During the initial nonlinear stages, the flow is dominated by streaks; hence, the integral spanwise Reynolds normal stress is greater than the integral wall-normal Reynolds normal stress. At the same time, the integral streamwise Reynolds normal stress becomes at least an order of magnitude greater than other components of the Reynolds stress tensor. At  $t \geq 1500$, the integral Reynolds shear stress becomes more significant than the integral spanwise Reynolds normal stress, which coincides with mean-flow distortion. The integral values of Reynolds stresses converge to the same magnitude at the transition point.
Figure 18(b) shows the evolution of integral values of Reynolds stresses when two-dimensional waves dominate the flow field. A similar trend is observed for the integral streamwise Reynolds normal stress, with it always having a higher magnitude than other components of the Reynolds stress tensor. However, there are significant differences in the behaviour of integral wall-normal and spanwise Reynolds normal stresses. Initially, the integral spanwise Reynolds normal stress is greater than the magnitude of wall-normal Reynolds normal stress and Reynolds shear stress. At  $t \sim 1000$, there is a rapid growth of the wall-normal Reynolds normal stress and Reynolds shear stress which coincides with the time when the amplitude of the two-dimensional waves becomes greater than the amplitude of the initial oblique waves (see figure 13a). Rapid growth is observed until nonlinear saturation at
 $t \sim 1500$. From
 $t \sim 1500$ to
 $t \sim 2000$, the streamwise and wall-normal Reynolds normal stress have approximately constant integral values while the spanwise Reynolds normal stress experiences rapid growth, which correlates with the rapid growth of streak modes in figure 13(a). The onset of mean-flow distortion causes rapid growth in integral Reynolds shear stress, similar to what is observed during transition caused by
 $(0.4,\pm 0.4)$ oblique waves in figure 18(a). From
 $t \geq 2000$, all the integral Reynolds stress tensor components grow to similar magnitudes. In contrast, the magnitude of the integral streamwise Reynolds normal stress is around an order of magnitude greater, similar to the behaviour observed in figure 18(a). It should be noted that during the initial stages of transition, the growth rates of integral wall-normal and spanwise Reynolds stresses are similar to the growth rates of harmonic two-dimensional modes and streak modes, respectively.
6. Effect of initial amplitude
Additional DNSs of transition initiated by  $(0.4,\pm 0.4)$ and
 $(0.2,\pm 0.4)$ oblique waves with different values of amplitude
 $A$ in (2.11) are performed to understand the effect of initial amplitude of oblique waves on O-type transition.
The growth rates of the initial oblique waves and the first level of nonlinearly generated modes are shown in figure 19, and it is clear that the growth rates are independent of the initial amplitude of the oblique waves. The growth rates of the  $(0,\pm 2) = (0, \pm 0.8)$ modes are not shown in figure 19(a) as a constant growth rate was not observed for a sufficiently long duration in the early stages of transition (see § 4.1).
Growth rates of oblique waves and the first level of nonlinearly generated modes during the early stages of transition for different initial amplitudes of oblique waves: (a)  $(0.4,\pm 0.4)$ oblique waves;
 $(0.2,\pm 0.4)$ oblique waves.

Despite the growth rates being the same, significant differences were observed in the transition times, which are investigated in this section.
For consistency, the time  $t_N$ is defined as when the average wall shear stress deviates
 $2\,\%$ from the analytic solution as there is mean-flow distortion at this time. The time when the first peak is observed in the plots of average wall shear stress is used as the transition time (
 $t_T$) (Reddy et al. Reference Reddy, Schmid, Baggett and Henningson1998). The time
 $t_D$ is defined as the time from when there is mean-flow distortion to the transition time
 $(t_D = t_T - t_N)$. A schematic representation of
 $t_N$,
 $t_T$ and
 $t_D$ is made in figure 20. It should be noted that the peaks in average wall shear stress and average wall heat flux need not occur simultaneously as it is well known that the buoyancy field and the velocity field can transition at different times (Zhao et al. Reference Zhao, Lei and Patterson2017). Despite this, it should be noted that the time difference between the peaks observed in average wall shear stress and average wall heat flux is below
 $20$. During the O-type transition, where harmonic two-dimensional waves dominate the flow, the peak refers to the first sharp increase in average wall shear stress and average wall heat flux. It is not the plateau observed in the wall behaviour due to the nonlinear saturation of two-dimensional waves (see figure 20b).
(a) Values of  $t_N$,
 $t_T$ and
 $t_D$ when
 $(0.4,\pm 0.4)$ oblique waves cause a transition; (b)
 $t_N$,
 $t_T$,
 $t_D$,
 $t_{N2}$ and
 $t_{D2}$ when
 $(0.2,\pm 0.4)$ oblique waves cause a transition. Amplitude
 $A = 10^{-3}$. Note that the average wall shear stress
 $\tau _w$ shown here is the same as figures 5(a) and 11(a).

The effect of initial amplitude of  $(0.2, \pm 0.4)$ and
 $(0.4, \pm 0.4)$ oblique waves on transition in vertical buoyancy layers is shown in figure 21. The dashed lines shown in figure 21 correspond to least-squares fit of
 $t \propto A^{\chi }$. The exponent
 $\chi$ and the proportionality constant are annotated in the figure.
(a) Time when nonlinear effects start to become dominant  $(t_N)$, (b) time when transition occurs
 $(t_T)$ and (c) time taken from when nonlinear effects start to dominate to transition (
 $T_D$).

In figure 21(a), an increase in the initial amplitude decreases  $t_N$, indicating that mean-flow distortion occurs earlier. When perturbed with
 $(0.2, \pm 0.4)$ oblique waves having the same amplitude as
 $(0.4, \pm 0.4)$ oblique waves, the mean-flow distortion becomes noticeable earlier than
 $(0.4, \pm 0.4)$ oblique waves. The exponents are not the same for
 $(0.2, \pm 0.4)$ and
 $(0.4, \pm 0.4)$ oblique waves, suggesting that the onset of mean-flow distortion depends on the oblique wave's wavenumber. From the exponents shown in figure 21(a), it is clear that the trend is continuing for even smaller amplitude disturbances. This implies that when the vertical buoyancy layer is perturbed with a pair of oblique waves, the onset of mean-flow distortion occurs faster for a truly infinitesimal disturbance comprising of
 $(0.2, \pm 0.4)$ oblique waves than
 $(0.4, \pm 0.4)$ oblique waves. The rapid growth of
 $(0.4,0)$ two-dimensional waves due to dominant linear growth for
 $(0.2, \pm 0.4)$ oblique waves compared with the growth of
 $(0.8,0)$ two-dimensional waves for
 $(0.4, \pm 0.4)$ oblique waves during transition is the cause of this behaviour.
In figure 21(b), an increase in the initial amplitude of the oblique waves reduces the time to transition ( $t_T$) for
 $(0.2, \pm 0.4)$ and
 $(0.4, \pm 0.4)$ oblique waves. For a given initial amplitude
 $(0.4, \pm 0.4)$ oblique waves cause faster transition than
 $(0.2, \pm 0.4)$ oblique waves. Interestingly, despite the mean flow being distorted earlier for
 $(0.2, \pm 0.4)$ oblique waves, the transition occurs quicker for
 $(0.4, \pm 0.4)$ oblique waves. The slope of
 $(0.4, \pm 0.4)$ oblique waves is steeper than
 $(0.2, \pm 0.4)$ oblique waves, demonstrating that
 $(0.4, \pm 0.4)$ oblique waves can cause faster transition for initial amplitudes much smaller than the amplitudes investigated here and is the case for infinitesimal oblique waves. It should be noted that this trend might not hold when finite-amplitude disturbances are considered. Investigating the O-type transition subject to finite-amplitude initial oblique waves is outside the scope of the current study.
It should be noted that the transition considered in the present study is supercritical. Therefore, there would not be a critical initial amplitude below which transition cannot take place, unlike the case of the subcritical transition observed in asymptotic suction boundary layer (Levin et al. Reference Levin, Davidsson and Henningson2005) and plane–Poiseuille flows (Reddy et al. Reference Reddy, Schmid, Baggett and Henningson1998).
Figure 21(c) shows the time taken from when mean-flow distortion becomes noticeable to transition  $(t_D = t_T - t_N)$. Interestingly, the difference between the transition time and the time when nonlinear interactions start to dominate is approximately a constant value for
 $(0.4, \pm 0.4)$ oblique waves, irrespective of the initial amplitude. This indicates that when streaks dominate the O-type transition, the initial amplitude of the oblique waves only plays a role until the initial mean-flow distortion. Once there is an onset of significant mean flow distortion, the time required for the breakdown of streaks to cause a transition is independent of the initial amplitude.
For  $(0.2,\pm 0.4)$ oblique waves,
 $t_D$ is inversely proportional to the initial amplitude with an increase in amplitude reducing
 $t_D$. An increase in amplitude reduces the plateau (see figure 11a) observed in average wall shear stress. This plateau corresponds to the nonlinear saturation of the harmonic two-dimensional modes when the amplitude of the streak modes does not have the same order of magnitude. Irrespective of the initial amplitude, this average wall-shear-stress plateau is saturated around
 $96\,\%$ of the analytic solution.
Two new temporal points are defined to understand the transition observed for  $(0.2,\pm 0.4)$ oblique waves. The time
 $t_{N2}$ is when the average wall shear stress begins to deviate from the analytic solution and before the exponential decay observed before the initial peak. The time
 $t_{D2}$ is when there is an exponential decay in the average wall shear stress from the plateau region to the peak. For consistency,
 $t_{D2}$ is defined as the difference between
 $t_T$ and the time when the average wall shear stress is
 $95\,\%$ of the analytic solution, which is lower than the saturation plateau. Also,
 $t_{N2}$ is defined as the difference between
 $t_T$ and
 $t_{D2}$. A schematic representation of
 $t_{N2}$ and
 $t_{D2}$ is shown in figure 20(b).
The time when there is almost an exponential decay in the average wall shear stress corresponds to the time when the streak modes have greater amplitude than the initial oblique waves and harmonic two-dimensional waves as discussed in § 4.2. The variation of  $t_{D2}$ and
 $t_{N2}$ to initial amplitude is shown in figure 22. The dashed line again corresponds to a least-squares fit of
 $t \propto A^{\chi }$. Interestingly,
 $t_{D2}$ repeats the trend of
 $t_D$ observed for
 $(0.4,\pm 0.4)$ oblique-mode breakdown in figure 21(c) with it converging to a constant value. This similarity in
 $t_{D2}$ suggests that despite the transition pathway being different for
 $(0.4,\pm 0.4)$ and
 $(0.2,\pm 0.4)$ oblique waves, the breakdown of streak modes and their nonlinear interactions with other modes are effective mechanisms in both. It should be noted that
 $t_{N2}$ decreases with an increase in initial amplitude as
 $t_T$ decreases with an increase in initial amplitude and
 $t_T = t_{N2} + t_{D2}$.
Values of  $t_{N_2}$ and
 $t_{D2}$ during transition dominated by
 $(0.2,\pm 0.4)$ oblique waves.

7. Oblique-mode breakdown of ${(0.3,\pm 0.3)}$ modes

There is no clear separation between the two transition pathways observed in the early nonlinear stages. The dominance of streaks and streamwise two-dimensional waves is demonstrated in § 4. It is also possible that the vertical buoyancy layer transitions to turbulence with both streaks and harmonic two-dimensional streamwise waves dominating the flow structure. Such a transition is observed for  $(0.3,\pm 0.3)$ oblique waves. The amplitude of modes during transition initiated by
 $(0.3,\pm 0.3)$ oblique waves is shown in figure 23. The
 $(1,\pm 1)$ modes in the figure correspond to
 $(0.3,\pm 0.3)$ modes.
Temporal development of  $u_2$ and
 $\vartheta$ disturbance amplitude for different wavenumbers at a wall-normal distance
 $x_1 = 0.785$. Here,
 $(1,1) = (0.3,\pm 0.3)$ and the rest are multiples of
 $(0.3,\pm 0.3)$. Thick solid black, red and blue solid lines represent the
 $u_2$ disturbance; thin dot-dashed black, green and magenta lines represent the
 $\vartheta$ disturbance.

The initial nonlinear stages of the transition process for  $(0.3,\pm 0.3)$ oblique waves follows the linear and nonlinear interactions of
 $(0.4,\pm 0.4)$ modes. The
 $(0.3,\pm 0.3)$ nonlinearly interact with each other to form
 $(0.6, 0)$ and
 $(0.0,\pm 0.6)$ modes. During the initial stages of transition, the growth rates of the
 $(0.0, \pm 0.6)$ and the
 $(0.6,0)$ modes are nearly identical, which is a consequence of the nonlinear interaction model discussed in Appendix C. At this time, the
 $(0.3,\pm 0.3)$ modes mainly grow due to linear mechanisms and have a growth rate of
 $5.704 \times 10^{-3}$, which is similar to the growth rate predicted by linear stability analysis (see table 2). At
 $t \sim 1400$, the amplitude of the
 $(0.0,\pm 0.6)$ mode is greater than the amplitude of the
 $(0.3, 0.3)$ mode, and therefore, the flow field is primarily dominated by streaks, shown in figure 24(a). However, it is not always the case, and at
 $t \sim 1750$ the amplitude of
 $(0.6,0)$ mode becomes greater than the amplitude of
 $(0, \pm 0.6)$ and
 $(0.3, \pm 0.3)$ modes. At this time, the streamwise velocity flow field is dominated by harmonic two-dimensional waves, shown in figure 24(b). This shows that at this wavenumber combination of oblique waves, the flow field during the O-type transition is a combination of streak modes and harmonic two-dimensional waves, which equates to the combination of the two transition routes discussed in this paper. In the later stages, the transition is again qualitatively similar to the H-type transition, similar to the observations of
 $(0.2, \pm 0.4)$ oblique waves. The development of the other modes follows the nonlinear wave–wave interactions discussed in § 4. The
 $(0.9,\pm 0.3)$ modes result from nonlinear interactions between
 $(0.3,\pm 0.3)$ and
 $(0.6,0)$ modes, while
 $(0.3,\pm 0.9)$ modes result from nonlinear interactions between
 $(0.3,\pm 0.3)$ and
 $(0,\pm 0.6)$ modes. The amplitude of the
 $(0.3,\pm 0.9)$ modes is always greater than the amplitude of the
 $(0.9,\pm 0.3)$ modes, similar to what is observed during the transition initiated by
 $(0.4 \pm 0.4)$ oblique waves. The modes shown in figure 23(c,d) are again due to limited machine precision (Mayer et al. Reference Mayer, Von Terzi and Fasel2011).
Streamwise velocity at  $x_1 = 0.785$ when perturbed by
 $(0.3,\pm 0.3)$ oblique waves. Note that the contour magnitude is different in the figures; (a)
 $t = 1400$, (b)
 $t = 1750$.

Investigating the detailed evolution of such a combined O-type transition is outside the scope of the present study. Nevertheless, figures 23 and 24 again demonstrate that streak modes do not always dominate the O-type transition in vertical buoyancy layers, unlike the O-type transition observed in canonical flat-plate incompressible and compressible boundary layers. The transition route when a pair of infinitesimal oblique waves are introduced into the flow can be broadly summarised as:
Oblique waves  $\Rightarrow$ Receptivity
 $\Rightarrow$ Linear growth
 $\Rightarrow$ Nonlinear interactions to form streaks, harmonic two-dimensional streamwise waves and harmonic oblique waves
 $\Rightarrow$ Further nonlinear interactions between streaks, harmonic two-dimensional streamwise waves and initial oblique waves
 $\Rightarrow$ Breakdown to turbulence.
8. Conclusions
The transition to turbulence of the vertical buoyancy layer caused by the oblique-mode breakdown is investigated using linear stability analysis and direct numerical simulation.
Linear theory demonstrates that for  $Pr = 0.71$ at
 $Re = 200$, a two-dimensional streamwise wave is the most amplified disturbance. However, certain three-dimensional oblique waves can grow linearly and have comparable growth rates to two-dimensional streamwise waves. The vertical buoyancy layer selectively filters the three-dimensional oblique waves, depending on the waves’ spanwise wavenumber
 $\beta$.
The nonlinear evolution and transition of the flow caused by a pair of symmetric oblique waves  $(\alpha,\pm \beta )$ depends on the streamwise and spanwise wavenumbers of the oblique waves. According to linear theory, the infinitesimal oblique waves initially grow until they reach a finite-amplitude state. The initial nonlinear interactions between the oblique waves generate streaks or streamwise vortices, harmonic two-dimensional waves, i.e. two-dimensional waves having twice the streamwise wavenumber of the oblique waves, and harmonic oblique waves. The growth rates of the first level of nonlinearly generated modes and the transition pathway depend on the streamwise and spanwise wavenumbers of the oblique waves.
For certain wavenumbers of the oblique waves, the transition is dominated by streaks. It is similar to oblique-mode breakdown observed in other canonical flows such as plane–Poiseuille flow, Blasius boundary layer flow, asymptotic suction boundary layer flow and a compressible supersonic boundary layer flow (Berlin et al. Reference Berlin, Lundbladh and Henningson1994, Reference Berlin, Wiegel and Henningson1999; Reddy et al. Reference Reddy, Schmid, Baggett and Henningson1998; Chang & Malik Reference Chang and Malik1994; Levin et al. Reference Levin, Davidsson and Henningson2005; Mayer et al. Reference Mayer, Von Terzi and Fasel2011; Laible & Fasel Reference Laible and Fasel2016). During this transition, the nonlinear interactions between the oblique waves seed energy into streaks, harmonic two-dimensional waves and harmonic oblique waves. These first level of nonlinearly generated modes grow mainly due to nonlinear mechanisms, with their growth rates being twice the growth rates of the initial oblique waves. The streaks or the streamwise vortex modes in the streamwise velocity field experience rapid growth and dominate the flow field.
For a different set of wavenumbers of the oblique waves, the initial stages of the transition are dominated by two-dimensional streamwise waves, unlike the oblique-mode breakdown observed in other canonical flows such as plane–Poiseuille flow, Blasius boundary layer flow, asymptotic suction boundary layer flow and a flat-plate compressible supersonic boundary layer flow (Berlin et al. Reference Berlin, Lundbladh and Henningson1994; Chang & Malik Reference Chang and Malik1994; Reddy et al. Reference Reddy, Schmid, Baggett and Henningson1998; Berlin et al. Reference Berlin, Wiegel and Henningson1999; Levin et al. Reference Levin, Davidsson and Henningson2005; Mayer et al. Reference Mayer, Von Terzi and Fasel2011). In this transition pathway, the oblique waves also nonlinearly interact to generate streaks, harmonic two-dimensional waves and harmonic oblique waves. However, due to strong linear amplification, the harmonic two-dimensional waves generated experience higher growth rates than streaks and harmonic oblique waves. This is the case as the nonlinearly generated harmonic two-dimensional waves are linearly unstable, and the nonlinear growth of the disturbances is supplemented by significant linear growth. This ensures that the harmonic two-dimensional waves dominate the flow during the transition.
There is no clear separation between the two transition pathways, and for certain wavenumbers, both streaks and two-dimensional streamwise waves can dominate the flow field. Despite the different flow fields being observed during the early stages of transition, the transition is related to the breakdown of streaks and the nonlinear generation of higher-order modes.
Secondary longitudinal mean flows are observed during the O-type transition in the vertical buoyancy layer, which is also a characteristic feature of K-type and H-type transition in unstratified vertical NCBLs (Jaluria & Gebhart Reference Jaluria and Gebhart1973; Zhao et al. Reference Zhao, Lei and Patterson2017). The longitudinal rolls have twice the spanwise wavenumber of the initial oblique waves and grow in intensity during the transition. The longitudinal mean flows are present in the inner boundary layer and extend further into the bulk, promoting mixing.
An analysis of TKE and buoyancy variance reveals that most of the turbulent kinetic energy is produced in the outer boundary layer. In contrast, the most significant buoyancy variance is observed near the velocity maximum. During the oblique transition, shear contributes more to TKE than buoyancy, with buoyancy dissipating the turbulent kinetic energy at specific distances from the wall. Before the breakdown, the spanwise Reynolds normal stress is more significant than the wall-normal Reynolds normal stress when streak modes dominate the transition. In contrast, the opposite is true when the two-dimensional streamwise waves dominate the initial stages of transition.
The growth rates of the initial oblique waves and the first level of nonlinearly generated modes are independent of the initial amplitude of the oblique waves. The onset of mean-flow distortion and the transition time is dependent on the initial amplitude of the oblique waves, with an increase in the initial amplitude causing a faster transition. However, the breakdown of streak modes once they become the dominant modes in the flow field during the two different transition pathways considered in this study is independent of the initial amplitude of the oblique waves.
Overall, it is demonstrated that the oblique-mode breakdown in a vertical buoyancy layer depends on the wavenumber of the initial oblique waves. Unlike other canonical flows such as the channel flow, Blasius boundary layer flow or the flat-plate compressible boundary layer flow, streaks do not always dominate the transition. Streaks and two-dimensional waves can dominate the transition to turbulence, and the transition pathway depends on the streamwise and spanwise wavenumber of the oblique waves.
Acknowledgements
We thank New Zealand eScience Infrastructure (NeSI) for providing high-performance computing facilities.
Funding
This research received no specific grant from any funding agency, commercial or not-for-profit sectors.
Declaration of interests
The authors report no conflict of interest.
Appendix A. Effect of wall-normal domain size on transition
Two different domain sizes were used to investigate the effect of wall-normal domain size on the transition initiated by  $(0.4,\pm 0.4)$ oblique waves. The domain D1 is the standard domain used throughout the study, having a wall-normal size of
 $4.8 \delta _{lf}$. The domain D2 is the larger domain whose wall-normal domain size is
 $9.6 \delta _{lf}$, which is twice the domain size of D1. The streamwise and spanwise domain sizes of the domains D1 and D2 are kept constant at
 $6 {\rm \pi}/ \alpha$ and
 $6 {\rm \pi}/ \beta$.
The evolution of average wall shear stress and average wall heat flux was monitored to investigate the transition. The average wall shear stress and heat flux are calculated by averaging the values along the entire length and width of the wall. Figure 25 shows the evolution of the average wall shear stress and heat flux of domains D1 and D2. From the figure, it is evident that the evolution of the average wall shear stress and heat flux of the domain D1 closely matched the evolution of the average wall shear stress and heat flux of the domain D2 until the breakdown (the temporal point where a peak is observed in the average wall shear stress).
Wall behaviour observed in two domains (D1 and D2) with different wall-normal domain sizes. (a) Average wall shear stress and (b) average wall heat flux during the transition process for  $(0.4,\pm 0.4)$ oblique waves.

The growth rates of the initial oblique waves and a few nonlinearly generated modes from domain D2 were also compared with the growth rates observed while using domain D1. The growth rates are shown in table 3, and it is clear that doubling the wall-normal domain size only marginally influenced the growth rates of the nonlinearly generated modes during the transition.
Growth rates  $\phi$ of the initial oblique waves and the nonlinear modes observed in DNS while using D1 and D2 domains.

Both these results demonstrate that the chosen wall-normal domain size of  $4.8 \delta _{lf}$ is adequate to capture the transition behaviour investigated in the current study correctly.
Appendix B. Parameter study of oblique waves
Figure 26 shows the oblique wave parameters investigated in the current study. Thirty-five direct numerical simulations are conducted with these  $\alpha$ and
 $\beta$ values. The figure clearly shows that a transition was only observed for parameter values enclosed by the neutral curve, implying that the O-type transition investigated is supercritical.
Phase-space plot of the Oblique-mode breakdown in the vertical buoyancy layer at  $Re = 200$. Black circles and grey squares correspond to the parameter values investigated in the current study. A black circle represents a parameter combination where transition was observed. A grey square represents a parameter combination where transition was not observed. Thick black curve represents the neutral curve.

Appendix C. Growth rates of nonlinearly generated modes
Consider a one-dimensional flow governed by a one-dimensional viscous Burgers’ equation with the Oberbeck–Boussinesq approximation for buoyancy and a streamwise- dependent velocity source for stratification. The mean flow is represented using  $u$ and
 $T$ for velocity and temperature, respectively. The equation governing the fluid flow is as follows:
 \begin{gather} \frac{\partial u}{\partial t} + u \frac{\partial u}{\partial x} = \nu \frac{\partial^2 u}{\partial x^2} + g \beta T, \end{gather}
 \begin{gather} \frac{\partial T}{\partial t} + u \frac{\partial T}{\partial x} = \kappa \frac{\partial^2 T}{\partial x^2} - S u, \end{gather}
where  $\beta$ is the coefficient of thermal expansion,
 $\nu$ is the kinematic viscosity,
 $g$ is the acceleration due to gravity,
 $\kappa$ is the thermal diffusivity and
 $S$ is the stratification parameter. Equation (C1) can be considered a one-dimensional representation of the current flow.
Writing (C1) as a combination of a base state  $U,T$ and perturbation
 $u',T'$ gives
 \begin{gather} \frac{\partial u'}{\partial t} + u' \frac{\partial U}{\partial x} + U \frac{\partial u'}{\partial x} + u' \frac{\partial u'}{\partial x} = \nu \frac{\partial^2 u'}{\partial x^2} + g \beta T', \end{gather}
 \begin{gather} \frac{\partial T'}{\partial t} + u' \frac{\partial T}{\partial x} + U \frac{\partial T'}{\partial x} + u' \frac{\partial T'}{\partial x} = \kappa \frac{\partial^2 T'}{\partial x^2} - S u'. \end{gather}
Equation (C2) is equivalent to linear stability equations if the nonlinear advection term is ignored.
Consider that the perturbations in the flow take the following wave-like form:
 \begin{gather} u' = \sum_{k={-}\infty}^\infty A_k(t) {\rm e}^{{\rm i}k\alpha x_1}, \end{gather}
 \begin{gather} T' = \sum_{k={-}\infty}^\infty A_k(t) {\rm e}^{{\rm i}k\alpha x_1}, \end{gather}
where  $k$ is the wavenumber of the waves,
 $A_k(t)$ is the amplitude and
 $\alpha$ is the streamwise wavenumber. For simplicity, the perturbation fields
 $u'$ and
 $T'$ are assumed to have the same amplitude and zero phase difference. Rewriting (C2) using the above wave-like form for perturbations gives
 $$\begin{gather} \sum_{k={-}\infty}^\infty \left( \frac{\partial A_k(t)}{\partial t} + {\rm i} k\alpha U A_k(t) + k^2 \alpha^2 \nu A_k(t) -g \beta \right) {\rm e}^{{\rm i}k\alpha x}\nonumber\\ ={-} \sum_{m={-}\infty}^\infty \sum_{n={-}\infty}^\infty \left( A_m(t){\rm i} n \alpha A_n(t) \right) {\rm e}^{{\rm i}(m+n)\alpha x}, \end{gather}$$
 $$\begin{gather}\sum_{k={-}\infty}^\infty \left( \frac{\partial A_k(t)}{\partial t} + {\rm i} k\alpha U A_k(t) + k^2 \alpha^2 \kappa A_k(t) +S \right) {\rm e}^{{\rm i}k\alpha x} \nonumber\\ ={-} \sum_{m={-}\infty}^\infty \sum_{n={-}\infty}^\infty \left( A_m(t){\rm i} n \alpha A_n(t) \right) {\rm e}^{{\rm i}(m+n)\alpha x}, \end{gather}$$
where  $m$ and
 $n$ are also the wavenumbers of the perturbations. It should be noted that a convolution sum is used to represent the nonlinear advection terms. The above analysis is similar to the analysis of Schmid & Henningson (Reference Schmid and Henningson2001).
If the flow is composed of only two waves with wavenumber  $k/2$, (C4) simplifies to
 \begin{gather} \frac{\partial A_k(t)}{\partial t} + {\rm i} k\alpha U A_k(t) + k^2 \alpha^2 \nu A_k(t) - g \beta = 0.5 (A_{k/2}(t))^2 {\rm i} k \alpha, \end{gather}
 \begin{gather} \frac{\partial A_k(t)}{\partial t} + {\rm i} k\alpha U A_k(t) + k^2 \alpha^2 \kappa A_k(t) + S = 0.5 (A_{k/2}(t))^2 {\rm i} k \alpha. \end{gather}
From (C5), it is clear that the evolution of the nonlinear wave with wavenumber  $k$ is proportional to the square of the amplitude of the initial waves having wavenumber
 $k/2$, implying that the growth rate of the nonlinearly generated wave is proportional to twice the growth rate of the initial waves. Although the analysis shown here corresponds to only a one-dimensional flow, extending this analysis to a three-dimensional flow composed of a pair of symmetric oblique waves is straightforward. A similar analysis using a pair of oblique waves perturbing a one-dimensional inviscid Burgers’ equation was performed by Laible & Fasel (Reference Laible and Fasel2016). The authors reached the same conclusion regarding the growth rates of nonlinearly generated modes.
The above conclusion is valid for a purely nonlinear interaction where the nonlinearly generated mode does not experience linear growth or decay. However, it is not the case for the vertical buoyancy layer, as the nonlinearly generated modes can experience amplification or damping due to linear mechanisms. Therefore, the growth rates of the nonlinearly generated modes should be a combination of the linear and nonlinear growth rates.
Despite this, the growth rates of the nonlinearly generated modes can be well approximated by either linear or nonlinear growth rates if the magnitude of one of those is significantly greater than the other (evident from § 4). For large  $t$, if the linear growth rate of the nonlinearly generated wave is less than the nonlinear growth rate of the initial waves, then the growth rate of the nonlinear waves can be approximated by solely considering the growth rates of the initial waves multiplied by two. Alternatively, for large
 $t$, if the linear growth rate of the nonlinearly generated wave is greater than the nonlinear growth rate, then the growth rate of the nonlinear waves can be approximated by solely considering the linear growth rate of the nonlinear wave. These conditions hold because the waves experience exponential growth (evident from (C4)).



