Introduction
Amyotrophic lateral sclerosis (ALS), the most common motor neuron disease (MND), is a rapidly progressive neurodegenerative disorder primary involving upper and lower motor neurons.Reference Hardiman, Al-Chalabi and Chiò 1 However, increasing evidence supports the multisystem extent of the disease, recently recognized as belonging to a clinical, genetic, and neuropathological continuum with frontotemporal lobar degeneration (FTLD)Reference Burrell, Halliday and Kril 2 and sharing many of the core prion-like protein misfoldings, aggregation, and mislocation processes with other neurodegenerative disorders, such as Alzheimer’s and Parkinson’s diseases.Reference Ahmad, Baig, Mushtaq, Kamal, Greig and Choi 3 –Reference Grad, Fernando and Cashman 5 Furthermore, the high prevalence of behavioral and/or cognitive dysfunctions described in ALSReference Lulé, Böhm and Müller 6 , Reference Strong, Abrahams and Goldstein 7 and the finding of an hexanucleotide repeat expansion in C9orf72 as a major cause of both ALS and frontotemporal dementia (FTD)Reference De Jesus-Hernandez, Mackenzie and Boeve 8 , Reference Renton, Majounie and Waite 9 have represented significant milestones of ALS research in the last decade. Nevertheless, from the therapeutic point of view, clinical trials continued to fail, in part due to the lack of biomarkers of disease progression.Reference Turner 10 An objective biomarker of disease activity, more sensitive than changes of the ALS Functional Rating Scale-Revised (ALSFRS-R) scoreReference Cedarbaum, Stambler and Malta 11 over time, would be valuable to reduce therapeutic trial heterogeneity and provide faster no-go decisions. At present, among the instrumental markers of disease progression, investigators mostly use electrophysiology measures as secondary outcome measures in clinical trials, also according to the revised Airlie House ALS Clinical Trials Consensus Guidelines.Reference Berg LH, Sorenson and Gronseth 12
Advanced neuroimaging techniques, such as structural and functional magnetic resonance imaging (MRI) techniques, have increasingly emerged over the last 2 decades for in vivo mapping structural, functional, and molecular aspects of ALS pathology, potentially yielding assess to surrogate markers for diagnosis, stratification, and disease progression monitoring.Reference Menke, Agosta, Grosskreutz, Filippi and Turner 13
Longitudinal MRI studies in ALS have contributed to exploring the disease spreading in vivo, Reference Menke, Körner and Filippini 14 –Reference de Albuquerque, Branco, Rezende, de Andrade, Nucci and França 19 although the clinical heterogeneity of the cohorts of patients examined, the relatively small sample sizes, the lack of standardized MRI protocols, and the limited knowledge of the natural progression of the disease have hindered to translate the interpretation of these MRI findings from group-level to individual-level inferences.Reference Bede and Hardiman 20 , Reference Schuster, Elamin, Hardiman and Bede 21 However, relevant clues to monitor ALS progression in vivo may derive from multimodal approaches, combining more neuroimaging techniques to investigate both white and gray matter (WM and GM) alterations in the same cohorts. In this regard, Menke et alReference Menke, Körner and Filippini 14 in a large structural MRI study on patients with ALS showed limited changes of diffusion tensor imaging (DTI) metrics, such as fractional anisotropy (FA) and axial, mean, and radial diffusivity (AD, MD, and RD) measures, assessed in the corpus callosum (CC) and in the left corticospinal tract (CST) after a minimum of six months, while voxel-based morphometry (VBM) analysis revealed widespread GM volume decrease in both motor and extramotor brain areas. More recently, in a multimodal 2-year follow-up study performed in a small group of slowly progressive patients with MND, Menke et alReference Menke, Proudfoot, Talbot and Turner 15 reported widespread brain changes in both GM and WM structural MRI measures. Moreover, the analysis of resting state functional MRI (RS-fMRI) data showed a mixed picture of both regional decrease and increase in functional connectivity (FC) between, respectively, the sensorimotor network (SMN) and the frontal pole and between the left frontoparietal network (L-FPN) and the left primary motor cortex.
On this background, in order to identify functional and structural MRI changes in a cohort of newly diagnosed patients with ALS to be monitored over time, we performed a 1-year follow-up study by monitoring six-monthly structural and functional MRI data.
Methods
Case selection
Twenty-two right-handed patients (20 male and 2 female; mean age 57.5 ± 10.1) with definite clinical or laboratory-supported probable ALS, according to El-Escorial revised criteria,Reference Brooks, Miller, Swash and Munsat 22 showing a “classic” phenotype,Reference Chiò, Calvo, Moglia, Mazzini and Mora 23 were consecutively recruited at the First Division of Neurology of the University of Campania “Luigi Vanvitelli” (Naples, Italy). They underwent three multimodal MRI assessments approximately every six months (median ± SD, 6 months ± 1) over a period of one year. Two patients had a bulbar onset and 20a spinal onset.
As for assessment of disability status, we measured the ALSFRS-R total score (0-48, with lower total reflecting higher disability) and subscores (ie, bulbar, fine-motor, gross-motor, and respiratory subscores),Reference Cedarbaum, Stambler and Malta 11 and the upper motor neuron (UMN) score, index of pyramidal dysfunction through the evaluation of the number of pathologic reflexes elicited from 15 body sites.Reference Turner, Cagnin and Turkheimer 24 Disease duration was calculated from symptom onset to scan date in months, and the rate of progression determined by: (48− current ALSFRS-R)/disease duration. None of the patients recruited was affected by others neurological diseases or previous mental illness.
Genetic analysis was performed in all patients, exploring C9orf72 repeat expansion and mutations of SOD1, TARDBP and FUS/TLS. No mutations of these genes were reported.
Twenty-two right-handed healthy control subjects (HCs) (18 male and 4 female; mean age 56.8 ± 10.1) were enrolled by “word of mouth” and among caregivers’ friends. They were age-, sex-, and education-matched with the enrolled patients with ALS. Moreover, they had no comorbid neurological, psychiatric, or medical conditions.
Neuropsychological assessment
To assess cognitive and behavioral profile of our population, the Italian version of Edinburgh Cognitive and Behavioral ALS Screen (ECAS)Reference Poletti, Solca and Carelli 25 , Reference Siciliano, Trojano and Trojsi 26 was administered by neuropsychologists with specific expertise in ALS assessment (M.S., C.P., G.S.) to all participants. In particular, we administered ECAS in that it has been validated as an ALS-specific tool, designed to detect cognitive and behavioral changes in patients with ALS, accounting to difficulties in speaking, writing, and drawing.Reference Abrahams, Newton, Niven, Foley and Bak 27 The ALS group was monitored every six months.
Statistical analysis: between-groups comparisons of clinical and neuropsychological data
All data were tested for normality, and values between –1 and +1 for asymmetry were considered acceptable.Reference Hays, Anderson and Revicki 28 According to the normal distribution of data, t test, and Pearson’s chi squared test (χ2) were used to compare demographic, clinical, and neuropsychological measures between patients with ALS and HCs at baseline.
One-way repeated-measures ANOVA was used to determine the changes of functional abilities and cognitive performances across the observation period in patients with ALS. The effect size was expressed as omega squared (ω2) for each outcome.
Bonferroni correction was applied to reduce the likelihood of making a Type I error.
All analyses were performed using Statistical Package for Social Science (SPSS) version 21, with P value <.05 considered statistically significant.
MRI analysis
Magnetic resonance imaging
Magnetic-resonance images were acquired on a 3T scanner equipped with an eight-channel parallel head coil (General Electric Healthcare, Milwaukee, WI). The imaging protocol included three-dimensional T1-weighted sagittal images (gradient-echo sequence Inversion Recovery prepared Fast Spoiled Gradient Recalled-echo, time repetition = 6988 ms, TI = 1100 ms, TE = 3.9 ms, flip angle = 10, voxel size = 1 × 1 × 1.2 mm3); RS-fMRI sequence, consisting of 240 volumes of a repeated gradient-echo echoplanar imaging T2*-weighted sequence (time repetition = 1508 ms, axial slices = 29, matrix = 64 × 64, field of view = 256 mm, thickness = 4 mm, interslice gap = 0 mm); whole-brain DTI, performed using a GRE EPI sequence (repetition time = 10 000 ms, echo time = 88 ms, field of view = 320 mm, isotropic resolution = 2.5 mm, b value = 1000 s/mm2, 32 isotropically distributed gradients, frequency encoding RL); T2-fluid attenuation inversion recovery to exclude severe cerebrovascular disease according to standard clinical neuroradiological criteria on visual inspection by three experienced radiologists. During the functional scan, subjects were asked to simply stay motionless, stay awake, relax, and keep their eyes closed. No visual or auditory stimuli was presented at any time during functional scanning. The total duration of each scan was about 40 minutes.
RS-fMRI data preparation and preprocessing
Standard functional image data preparation and preprocessing, statistical analysis, and visualization were performed with the software BrainVoyager QX (Brain Innovation BV, Maastricht, The Netherlands). Data preprocessing included the correction for slice scan timing acquisition, a three-dimensional rigid-body motion correction based on a six-parameter rigid body alignment to correct for minor head movements, and the application of a temporal high-pass filter with cut-off set to three cycles per time course. Translational motion parameters were verified to be always less than one functional voxel for all included participants. Structural and functional data were coregistered and spatially normalized to the Talairach standard space using a 12-parameter affine transformation. During this procedure, the functional images were resampled to an isometric 3-mm grid covering the entire Talairach box. Finally, the resulting image time series were spatially smoothed with a 6-mm full-width half-maximum isotropic Gaussian kernel.
Resting State Networks (RSN) functional connectivity analysis
To extract RSN maps, single-subject and group-level independent component analyses (ICA)Reference Hays, Anderson and Revicki 28 were carried out on the preprocessed functional time series using two plug-in extensions of BrainVoyager QX, respectively, implementing the fastICA algorithmReference Hyvärinen, Karhunen and Oja 29 and the self-organizing group ICA algorithm.Reference Esposito, Scarabino and Hyvärinen 30
For each single subject, 40 independent components were extracted (corresponding to 1/6th of the number of time points)Reference Greicius, Flores and Menon 31 and scaled to spatial z scores (ie, the number of standard deviations of their whole-brain spatial distribution). To generate group components and allow for population-level inferences in each RSN, all individual component maps from all subjects were “clustered” in the subject space according to the mutual similarities of their whole-brain distributions using the self-organizing group ICA algorithm. Thereby, all 40 individual independent components were uniquely assigned to 1 out of 40 “clusters” of independent components. Once the components belonging to a cluster were retrieved, the corresponding maps were averaged and the resulting map was assumed as the representative of the cluster. The 40 single-group average maps were visually inspected to recognize the spatial patterns associated with the main RSNsReference Mantini, Perrucci, Del Gratta, Romani and Corbetta 32 , Reference Smith, Fox and Miller 33 and to remove components clearly related to artifacts. For this purpose, single-group one-sample t tests were used to analyze the whole-brain distribution of the components in each group separately and the resulting t maps were thresholded at P = .05 (Bonferroni corrected over the entire brain). From this analysis, an inclusive mask was also created from the healthy control group maps and used to define a new search volume for within-network two-group comparisons. These comparisons were made with the classical analysis of variance (ANOVA) that included one between-subject factor with four levels: healthy controls, patients with ALS at T0, T1, and T2.
To correct the resulting t maps for multiple comparisons, regional effects within the search volume were only considered significant for compact clusters after the joint application of a voxel- and a cluster-level threshold. The cluster-level threshold was estimated nonparametrically with a randomization approach: we calculated the FWHM from each RSNs’ map in relationship to the healthy control group and starting from an initial (uncorrected) threshold of P = .001 applied to all voxels, a minimum cluster size was calculated that protected against false-positive clusters at 5% after 1000 Monte Carlo simulations.Reference Forman, Cohen, Fitzgerald, Eddy, Mintun and Noll 34
DTI analysis
A voxel-based tract-based spatial statistics (TBSS) approach was used for group analysis of DTI data.Reference Smith, Jenkinson and Johansen-Berg 35 DTI data sets were processed with the Functional MRI of the Brain (FMRIB) Software Library (FSL) software package (www.fmrib.ox.ac.uk/fsl). Preprocessing included eddy current and motion correction and brain-tissue extraction. After preprocessing, DTI images were averaged and concatenated into 33 (1 B = 0 + 32 B = 1000) volumes and a diffusion tensor model was fitted at each voxel, generating FA, MD, and AD and eigenvalue (λ1, λ2, and λ3) maps. The average of the second and third eigenvalues of the diffusion tensor was used for the definition of the RD. Images were warped to the Montreal Neurological Institute (MNI) 152 template, available as standard T1 data set in the FSL software package. TBSS was run with FA maps to create the “skeleton,” which represents the center of all fiber bundles in common to all subjects, and which was used for all other maps. To this purpose, FA images of all subjects (n = 44) were aligned to a common target (1 × 1 × 1 mm3 MNI152 FMRIB58_FA standard space) using nonlinear registration. A mean FA skeleton was then created with threshold of FA > 0.2. Age, gender, and education were considered as covariates. Moreover, the TBSS results were linked to standard anatomic data derived from the International Consortium of Brain Mapping DTI-81 WM (ICBM-DTI-81-WM) labels atlas (Johns Hopkins University, Baltimore, MD).Reference Wakana, Caprihan and Panzenboeck 36 , Reference Hua, Zhang and Wakana 37
In addition to the TBSS analysis, a volume of interest (VOI) analysis was also performed. We defined 13 WM tracts typically used in studies on ALS a priori, based on the ICBM-DTI-81-WM labels atlasReference Wakana, Caprihan and Panzenboeck 36 , Reference Hua, Zhang and Wakana 37: body, genu, and splenium of CC; CST; inferior longitudinal fasciculus (left/right); inferior fronto-occipital fasciculus (left/right); superior longitudinal fasciculus (left/right); and uncinate fasciculus (UF, left/right). Mean FA, MD, AD, and RD values within these tract labels in MNI space were extracted from the spatially normalized and skeletonized FA, MD, AD, and RD maps of each individual. The DTI parameters of the VOIs were compared between the two groups of subjects using unpaired t test (P < .01, Bonferroni corrected).
Regional atrophy measurements: VBM
To control for the confounding influences of GM atrophy on RS signal, we performed a VBM analysis using the VBM8 toolbox (http://dbm.neuro.uni-jena.de/vbm.html) of SPM12 software package (http://www.fil.ion.ucl.ac.uk/spm/) with default parameters incorporating the DARTEL toolbox to obtain a high-dimensional normalization protocol.Reference Ashburner 38 Data processing was carried out according to a previously described protocol.Reference Farb, Grady and Strother 39 In particular, anatomic images were created using the nonlinear components of the model, thereby controlling for the linear transformations of global brain size and orientation, whereas displaying local nonlinear differences in GM volume. Moreover, modulated images were smoothed with 8-mm full-width half-maximum Gaussian kernel to create the final probability maps. GM atrophy results of comparisons between patients with ALS and HCs were familywise error (FWE) corrected at a level of P < .05 and covaried for age and total intracranial volume.
Ethics statement
The research was conducted according to the principles expressed in the Declaration of Helsinki. Ethics approval was obtained from the Ethics Committee of the University of Campania “Luigi Vanvitelli.” Patient or family written informed consent was obtained from each participant.
Results
Demographics and neuropsychological variables
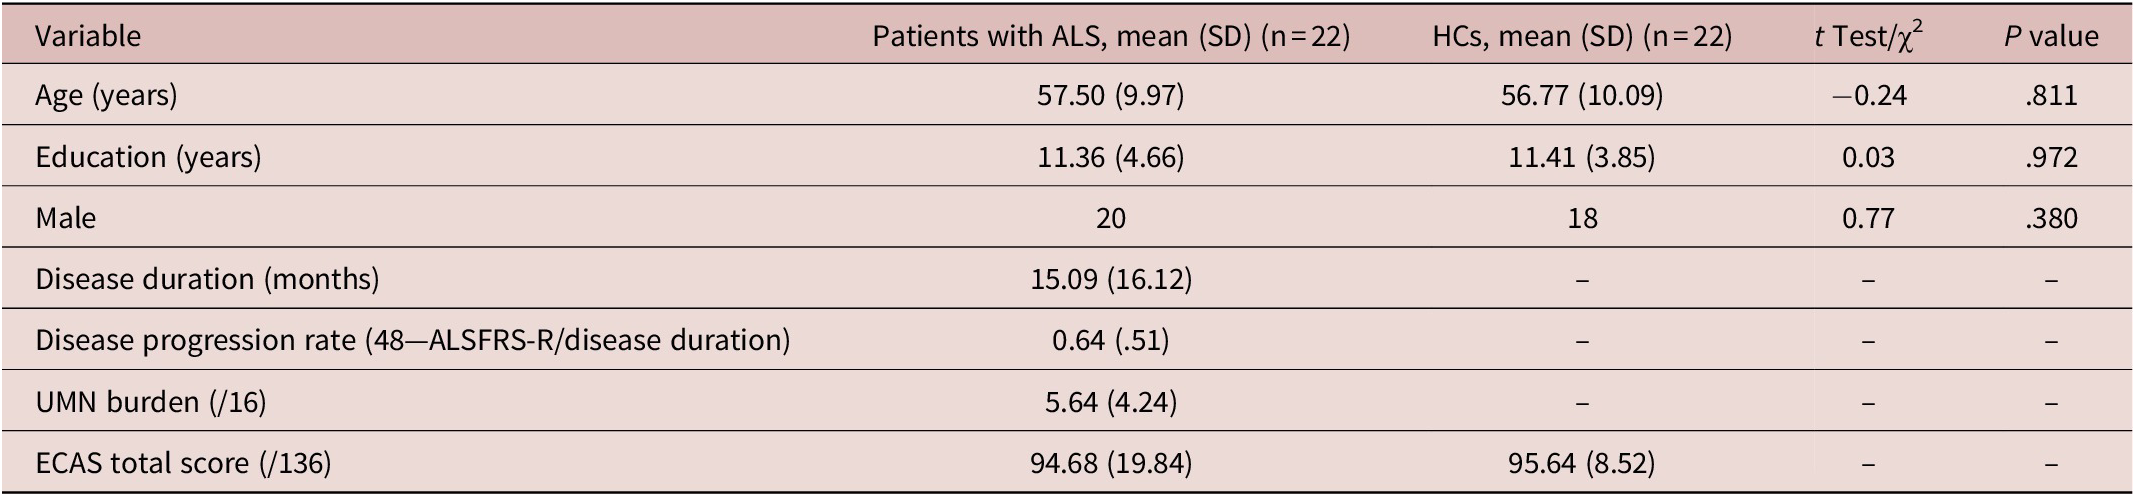
Patients and controls characteristics were reported in Table 1. At baseline, we revealed that three patients had a cognitive impairment (ALSci) according to the revised Strong criteria.Reference Strong, Abrahams and Goldstein 7 After six months, 17 patients continued the study and, after one year, 14 patients concluded the scans, including the three patients with ALSci. The dropouts were determined by worsening of the clinical conditions that hindered to perform MRI scans.
Demographic, clinical, and neuropsychological measures of patients and healthy controls at baseline.

Abbreviations: ALS, amyotrophic lateral sclerosis; ECAS, Edinburgh Cognitive and Behavioral ALS Screen; HCs, healthy control subjects; SD, standard deviation; UMN, upper motor neuron; χ2, Chi-square test.
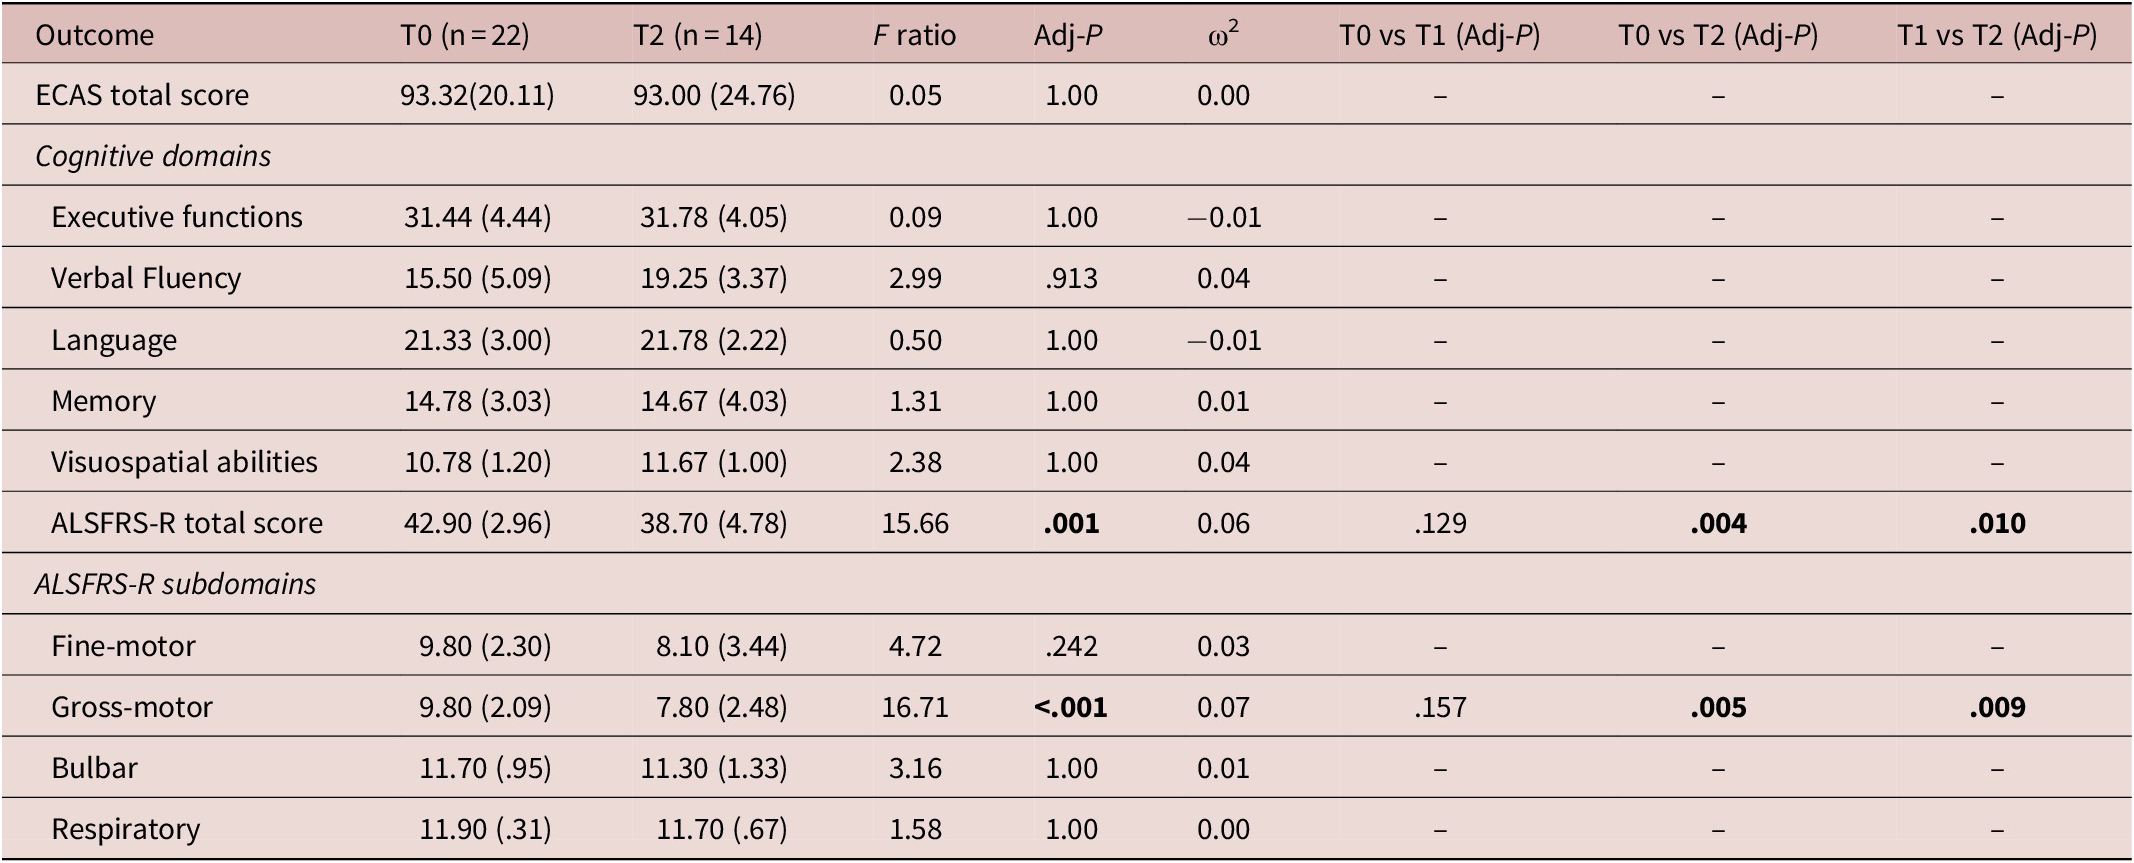
Mauchly’s test indicated that the assumption of sphericity was violated only for ECAS total score, (χ2 = 8.64, P = .013) and ALSFRS-R bulbar subscore (χ2 = 9.45, P = .009), therefore the degrees of freedom of these outcomes were corrected using Greenhouse and Geisser estimates of sphericity (ε = 0.71 and ε = 0.59, respectively). One-way repeated-measures ANOVA showed that the ALSFRS-R total score and gross-motor subscore significantly differed during the follow-up period. Post hoc analysis revealed that patients’ functional ability deterioration (particularly gross-motor abilities) became more severe in T2 compared to T0 and T1. Conversely, from the neuropsychological point of view, ECAS total scores and subscores did not reveal significant changes throughout one year (Table 2). In particular, the three patients with ALSci at baseline did not show significant changes of their cognitive profile throughout one year.
Results of one-way repeated-measures ANOVA for determining the changes of functional abilities and cognitive performances across the observation period.
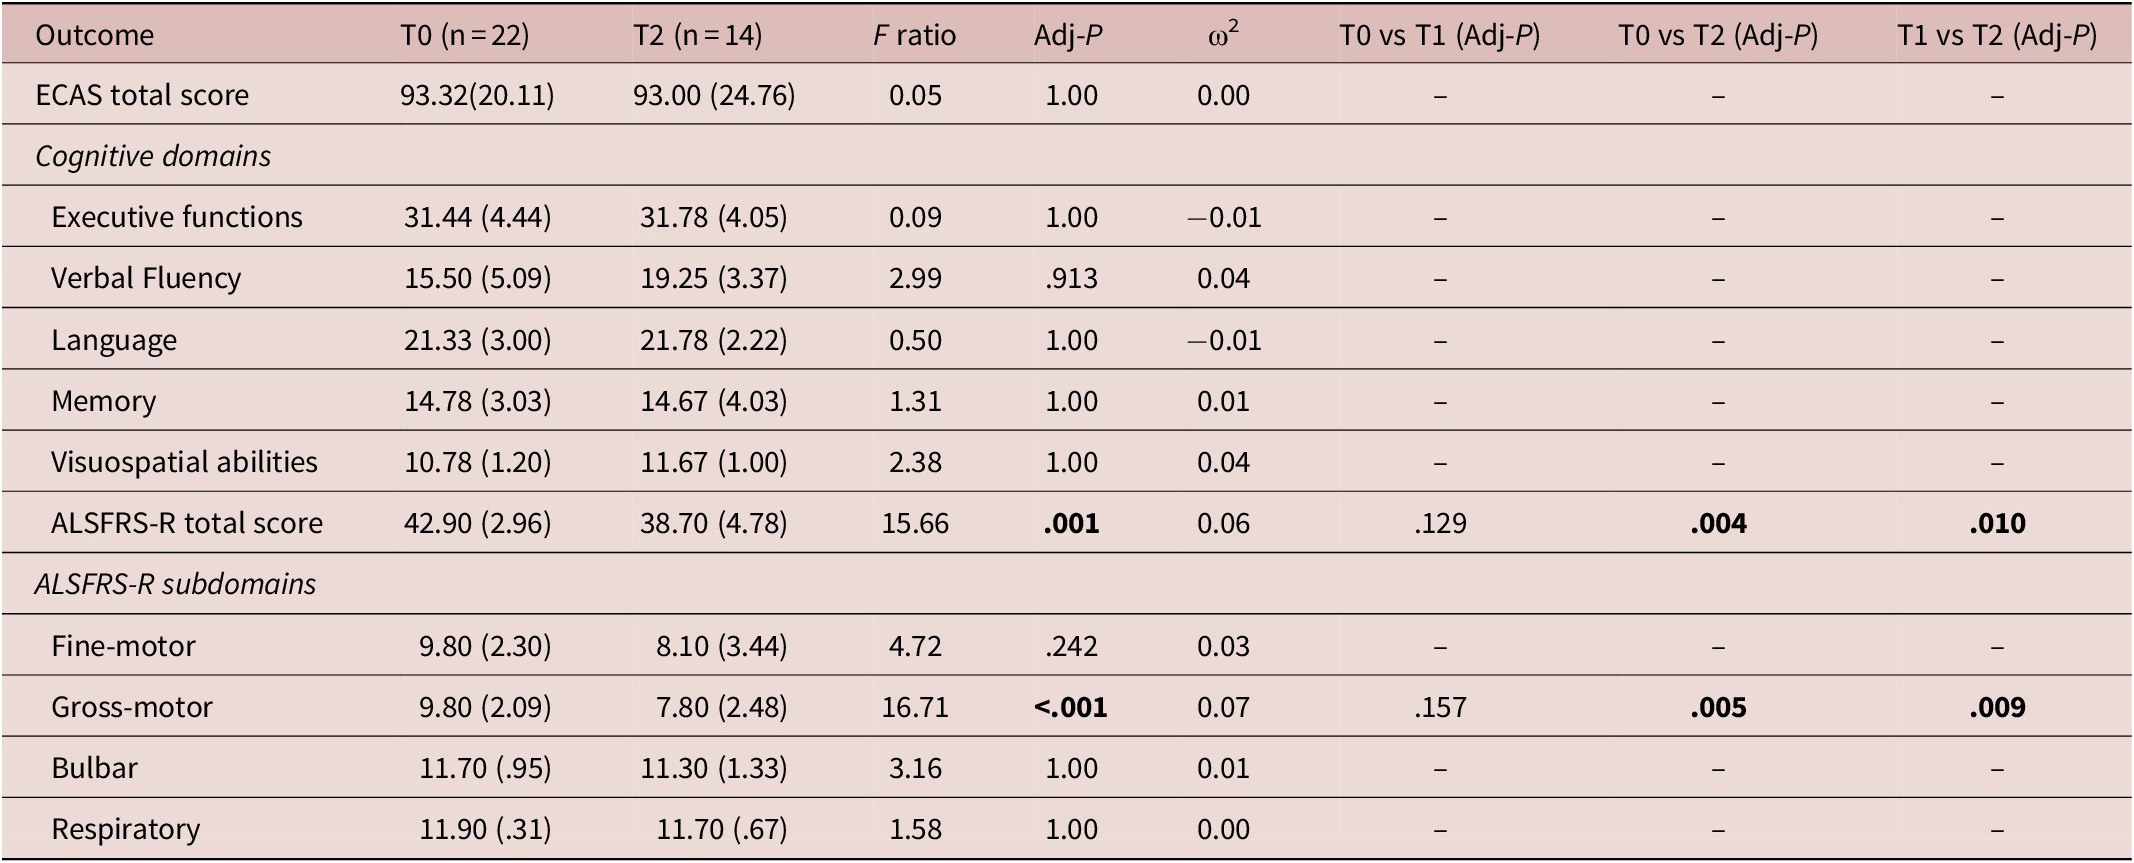
Note: Data are shown as mean (standard deviation). Significant differences are signed in bold.
Abbreviations: Adj-P, P value corrected for Bonferroni procedure; ALS, amyotrophic lateral sclerosis; ECAS, Edinburgh Cognitive and Behavioral ALS Screen; ω2 = omega squared.
RSN functional connectivity
The main RSN components were identified within the set of estimated independent components from the single-group maps using similarReference Damoiseaux, Rombouts and Barkhof 40 or identicalReference Mantini, Perrucci, Del Gratta, Romani and Corbetta 32 methodologies derived from previous studies. Among RSNs, SMN component, as motor network, and default mode network (DMN), right and left FPNs and salience network (SLN) components, as extramotor networks, showed statistically significant regional group effects in their spatial distribution. In particular: the SMN included primary and supplementary motor areasReference Greicius, Krasnow, Reiss and Menon 41; the DMN comprised the posterior cingulate cortex, precuneus cortex, medial prefrontal cortex, and angular gyriReference Greicius, Krasnow, Reiss and Menon 41; the FPNs, including regions subserving attention and executive processing, were found as lateralized in left and right ones (L- and R-FPN), according to previous evidenceReference Damoiseaux, Rombouts and Barkhof 40 , Reference Agosta, Canu and Valsasina 42; finally, the “salience” component (SLN) comprised dorsolateral prefrontal, anterior insular, and inferior parietal cortices, which subserve processing of emotional stimuli.Reference Mantini, Perrucci, Del Gratta, Romani and Corbetta 32 , Reference Filippi, Agosta and Scola 43
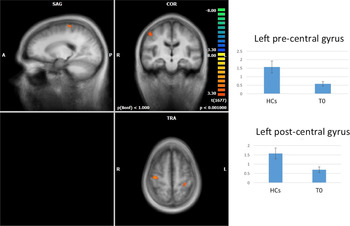
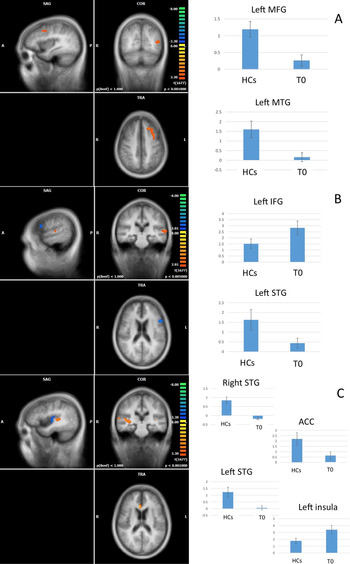
When compared to HCs, at baseline, patients with ALS exhibited a decreased FC in the SMN, in the right precentral and left postcentral gyri (Figure 1); in the DMN, in the left middle frontal gyrus (MFG) and the left middle temporal gyrus (MTG) (Figure 2A); in the R-FPN, in the MFG; in the L-FPN, in the superior temporal gyrus (STG) (Figure 2B); in the SLN, in the bilateral STG and anterior cingulated cortex (ACC) (Figure 2C). Conversely, we revealed increased FC in the L-FPN, in the inferior frontal gyrus (IFG), and in the SLN, in the left insula (Figure 2B,C).
Baseline (T0) comparison between functional connectivity (FC) signal fluctuations in patients with amyotrophic lateral sclerosis (ALS) vs healthy controls (HCs): sensorimot network (SMN) Decreased FC in the right precentral and left postcentral gyri in the ALS group. (A, anterior; COR, coronal; L, left; P, posterior; R, right; SAG, sagittal; TRA, transverse).

Baseline (T0) comparison between functional connectivity (FC) signal fluctuations in patients with amyotrophic lateral sclerosis (ALS) vs healthy controls (HCs): extramotor RSNs default mode network (DMN; A): decreased FC in the left middle frontal gyrus (MFG) and the left middle temporal gyrus (MTG) is displayed in the ALS group; left-frontoparietal network (L-FPN; B): decreased FC in the superior temporal gyrus (STG) and increased FC in the inferior temporal gyrus (ITG) in the ALS group; Salience Network (SLN; C): decreased FC in the bilateral STG and anterior cingulated cortex (ACC) and increased FC in the left insula. A, anterior; COR, coronal; L, left; P, posterior; R, right; SAG, sagittal; TRA, transverse.

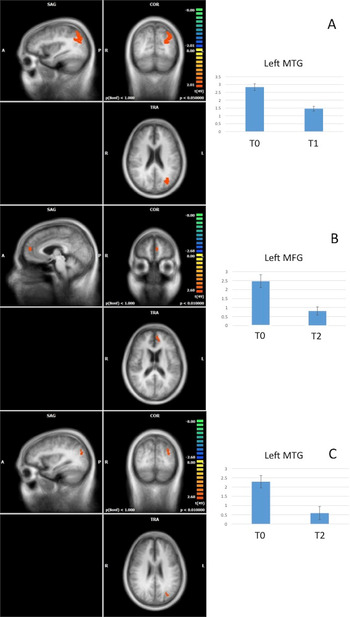
After six months (T1; Figure 3A), by comparing RS-fMRI data at T0 vs T1, the patients with ALS scanned (n = 17) showed reduced FC in the L-FPN in the left MTG. After one year (T2; Figure 3B,C), by comparing RS-fMRI data at T0 vs T2, the patients with ALS (n = 14) exhibited reduced FC in the DMN in the left MFG and in the L-FPN in the left MTG. Conversely, we did not reveal significant longitudinal changes of FC in the SMN, R-FPN, and SLN.
Longitudinal analysis: changes of functional connectivity (FC) connectivity over six months (T1) and one year (T2) in the ALS group After six months (T0 > T1), reduced FC in the left-frontoparietal network (L-FPN) in the left MTG (A) in the patients with amyotrophic lateral sclerosis (ALS) (n = 17); after one year (T0 > T2), reduced FC in the default mode network (DMN) in the left middle frontal gyrus (MFG) in the patients with ALS (n = 14; B) and in the L-FPN in the left middle temporal gyrus (MTG; C). A, anterior; COR, coronal; L, left; P, posterior; R, right; SAG, sagittal; TRA, transverse.

DTI TBSS whole-brain and VOI analyses
When comparing whole-brain metrics in patients with ALS vs HCs at baseline, six-months, and one-year time points, we did not reveal significant differences in any DTI parameter. However, after having extracted DTI data at the three time points from a priori VOIs, we showed that, after six months and one year, FA was decreased in the ALS group in comparison to HCs in the body of CC (T1 > HCs, P = .003; T2 > HCs, P = .01; Bonferroni corrected) and, after six months, FA was decreased in the right CST (P = .03, uncorrected).
The longitudinal analysis showed that, after six months, FA significantly decreased (T0 > T1; P = .002, Bonferroni corrected) in the ALS group (n = 17) in the right UF. Conversely, we did not reveal significant longitudinal changes of MD, RD, and AD in the studied VOIs. For more details, Supplementary Material Table S3 shows FA, MD, RD, and AD values in the analyzed VOIs at the three time points.
VBM analysis
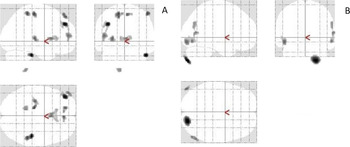
Compared to HCs, patients with ALS showed at baseline regional GM atrophy (P < .05, FWE-corrected) in motor (left precentral gyri) and extramotor (left frontal pole, right supramarginal gyrus, right inferior temporal gyrus, putamen) areas (Figure 4A). After six-months and one year, we did not found significant longitudinal GM changes in the motor areas. However, after one year (T0 > T2), we revealed reduction of GM volume (P = .001, FWE-corrected) in the right occipitolateral cortex (Figure 4B).
Cross-sectional and longitudinal voxel-based morphometry (VBM) analysis. At baseline (T0) regional gray matter (GM) atrophy (P < .05, family-wise error [FWE]-corrected) in left precentral gyri, left frontal pole, right supramarginal gyrus, right inferior temporal gyrus (ITG) and putamen in the amyotrophic lateral sclerosis (ALS) group (n = 22; A), shown in gray. After one year (T0 > T2), loss of GM volume (P = .001, FWE-corrected) in the right occipitolateral cortex in the ALS group (n = 14), shown in gray (B).

Discussion
This study reports the original evidence that nondemented patients with ALS show longitudinal functional and structural connectivity changes in extramotor domains, although only progressive motor decline is detectable and changes of cognitive performances over time are unapparent. Our longitudinal, multi-modal approach, including RS-fMRI, DTI, and VBM analyses of datasets from a small sample of patients with ALS revealed, at baseline, significant FC changes in the ALS group, compared to HCs, in some motor and extramotor networks, although, at six-months and one-year time points, connectivity alterations were reported only in extramotor RSNs. Furthermore, also WM and GM significant changes over time were reported in extramotor areas, such as the right UF and the right occipitolateral cortex.
The present evidence of longitudinal RS-fMRI abnormalities mainly involving frontotemporal areas recalls previous findings supporting the existence of a genetic and pathophysiologic,Reference Burrell, Halliday and Kril 2 clinicalReference Strong, Abrahams and Goldstein 7 , Reference Beeldman, Raaphorst and Klein Twennaar 44 and neuroimagingReference Crespi, Dodich and Cappa 45 continuum between FTLD and ALS, although the clinical evolution of the two syndromes allows to distinguish two distinct entities.Reference Lulé, Böhm and Müller 6 Moreover, while our patients, at baseline, showed decreased FC and regional GM atrophy in both motor and extramotor networks, progressive structural and functional alterations were not described in motor regions after six-months and one-year follow-up. Conversely, ALSFRS-R scores and subscores demonstrated significant worsening of the gross-motor abilities of the studied patients with ALS over time.
Our findings of progressive FC changes in frontotemporal areas, although not corresponding to clinical evidence of progressive changes of executive and language performances, intriguingly resemble neuropathologic findings of disease “spreading” in ALS from motor towards extramotor areas.Reference Eisen, Braak, Del Tredici, Lemon, Ludolph and Kiernan 46 Specifically, the “prion-like” corticofugal spreading hypothesis supported the view that ALS is a primary cortical neurodegenerative disease in which the cerebral and spinal dissemination of aggregates of phosphorylated transactive response DNA-binding Protein 43 (pTDP-43), the neuropathological hallmark of the ALS-FTLD spectrum of neurodegeneration,Reference Braak, Brettschneider, Ludolph, Lee, Trojanowski and Del Tredici 47 , Reference Brettschneider, Del Tredici and Toledo 48 spreads from motor neurons to subcortical nuclei according to a “corticofugal” axonal spreading pattern,Reference Eisen, Braak, Del Tredici, Lemon, Ludolph and Kiernan 46 , Reference Braak, Brettschneider, Ludolph, Lee, Trojanowski and Del Tredici 47 identifying a four-stages sequential model of pTDP-43 pathology in ALS.Reference Braak, Brettschneider, Ludolph, Lee, Trojanowski and Del Tredici 47 –Reference Schmidt, de Reus, Scholtens, van den Berg and van den Heuvel 53 To note, a previous cross-sectional and longitudinal FC analysis by Schulthess et al.,Reference Schulthess, Gorges and Müller 18 using a hypothesis-driven approach for investigating FC changes in a priori-defined intrinsic networks, revealed significantly increased FC over time in motor, brainstem, ventral attention, and default mode/hippocampal networks, according to the model of progression of TDP-43 pathology.Reference Eisen, Braak, Del Tredici, Lemon, Ludolph and Kiernan 46 –Reference Ludolph and Brettschneider 49 Although resembling our findings with regard to the cross-sectional evidence of increased FC in the L-FPN (in the IFG) and in the SLN (in the left insula), when comparing patients with ALS to HCs, we did not observe a significant longitudinal FC increase in the ALS group across time. Probably, the incongruence between our results and those by Schulthess et al.Reference Schulthess, Gorges and Müller 18 may be related to the heterogeneity of the studied cohorts and to the different methodologies used. In particular, Schulthess et al.Reference Schulthess, Gorges and Müller 18 compared longitudinal RS-fMRI changes detected in patients with ALS to those described in HCs by a hypothesis-guided MRI approach, while we could not longitudinally scan HCs. Moreover, the longer time of our observation may have determined that the early evidence of RSN “hyper-connectivity” disappeared when the pathology burden became more significant in the disease course. Interestingly, the cross-sectional evidence of RSN “hyper-connectivity” has been identified in ALS as well as in FTD as a disease-specific pathological finding that might result from a loss of the inhibitory influence exerted by interneurons or astrocytes on motorneurons.Reference Do-Ha, Buskila and Ooi 54 In this regard, a further hypothesis to explain the evidence of RSN “hyper-connectivity” in some RSNs has been significantly correlated with ALS-specific measures of physical disability in both cross-sectionalReference Tedeschi, Trojsi and Tessitore 55 and longitudinalReference Schulthess, Gorges and Müller 18 analyses, thereby suggesting that this mechanism may be involved in recruiting further brain structures by reorganizing functional networks in order to bypass affected regions.
Longitudinal extramotor FC changes in our population were not supported by WM and GM changes, revealed after six months in the right UF and after one year in the right occipitolateral cortex. Progressive GM degeneration was identified as a key longitudinal finding by some authors,Reference Menke, Proudfoot, Talbot and Turner 15 , Reference Bede and Hardiman 17 although other evidence did not show longitudinal cortical changes in some cohorts of patients with ALS.Reference Cardenas-Blanco, Machts and Acosta-Cabronero 16 , Reference Schuster, Kasper and Machts 56 , Reference Verstraete, Veldink, Hendrikse, Schelhaas, Heuvel and Berg 57 Among the significant evidence in favor of the potential use of GM analyses for capturing progressive cortical changes in patients with ALS, a previous longitudinal analysis by Menke et al.Reference Menke, Proudfoot, Talbot and Turner 15 described widespread and progressive regional GM atrophy in cortical (precentral gyri and posterior cingulate cortex) and subcortical (thalamus, caudate, and pallidum bilaterally, and right putamen, hippocampus and amygdale) brain areas in a cohort of patients with ALS. Moreover, a more recent eight-month follow-up studyReference Bede and Hardiman 17 confirmed that GM degeneration spreads considerably, involving the bilateral frontal, temporal and parietal lobes, as well as the cerebellum, with particularly significant changes in bilateral precentral gyri. The inconsistency between the results of these previous longitudinal studies and the findings of our VBM analysis may be due to the clinical heterogeneity of the cohorts studied and of the methodologies used. Conversely, the longitudinal occipitolateral changes reported in the cohort of patients with ALS examined in the present study may reflect the progressive widespread of the neurodegenerative process from motor toward posterior areas, as also confirmed by previous structural connectome analyses.Reference Buchanan, Pettit, Storkey, Abrahams and Bastin 58 , Reference Verstraete, Veldink, Mandl, Berg and Heuvel 59 Furthermore, in line with this evidence, the results from a functional connectome study by Zhou C et al.Reference Zhou, Hu and Hu 60 confirmed the involvement of posterior networks in a cohort of patients with ALS, revealing that the voxel-wise network degree centrality was altered in the visual areas and that patients with ALS with higher degree centrality in right inferior occipital gyrus exhibited a more advanced stage of disease.
The conclusions of longitudinal WM studies have been shown similarly inconsistent: some authors described significant WM degeneration over time,Reference Menke, Körner and Filippini 14 –Reference Cardenas-Blanco, Machts and Acosta-Cabronero 16 while others showed limited progressionReference Bede and Hardiman 17 or did not reveal progressive WM changes.Reference Blain, Williams and Johnston 61 , Reference Agosta, Rocca and Valsasina 62 Despite these conflicting results, some key disease-associate foci of impaired WM integrity have been identified in most cross-sectional studies, such as for CC, CST, and WM underneath the precentral gyrus and the supplementary motor cortex,Reference Agosta, Pagani and Petrolini 63 –Reference Agosta, Ferraro and Riva 65 although we did not confirm this pattern of WM impairment at baseline in our study. Probably, the small sample of the patients examined and the early observation in the disease course hindered to identify at baseline alterations of WM which were observed after six months in our cohort of patients, as well as previously shown in more advanced stages of ALSReference Agosta, Pagani and Petrolini 63 , Reference Filippini, Douaud, Mackay, Knight, Talbot and Turner 66 or in subsets of patients with faster disease progression.Reference Rajagopalan and Pioro 67 Interestingly, our longitudinal evidence of a significant decrease of FA in the right UF in the ALS group after six months may further reflect an early extent of microstructural abnormalities in extramotor areas. This corroborates the findings by Agosta et al.Reference Agosta, Pagani and Petrolini 63 , Reference Agosta, Ferraro and Riva 65 showing that the subtle involvement of the UF may precede the appearance of executive and nonexecutive deficits and behavioral symptoms in patients with ALS. Moreover, some evidence by Christidi et al.Reference Christidi, Zalonis and Kyriazi 68 , Reference Christidi, Karavasilis and Zalonis 69 supported the potential contribution of UF microstructural changes to ALS-related memory impairment, especially with regard to episodic memory formation and retrieval, considering the role of UF in connecting the inferior frontal lobe with the anterior portions of the temporal lobe.
Some limitations of our study must be acknowledged. Although some results of the DTI analysis do not survive correction for multiple comparisons, they suggest an involvement of WM tracts that are corroborated in other studies (ie, FA decrease in the right CST in the ALS group). While our patient sample size was relatively small and the attrition rate, due to disease progression, was high (ie, about one third of the studied population), hindering to monitor the fast progressors, such group sizes are common in previous cross-sectionalReference Agosta, Pagani and Petrolini 63 , Reference Filippini, Douaud, Mackay, Knight, Talbot and Turner 66 , Reference Christidi, Zalonis and Kyriazi 68 and longitudinal studies on patients with ALS.Reference Menke, Proudfoot, Talbot and Turner 15 , Reference de Albuquerque, Branco, Rezende, de Andrade, Nucci and França 19 Moreover, in our statistical models we have not accounted for longitudinal changes in our HCs. While relatively limited progressive change is expected in six months in healthy individuals, corrections for healthy aging may be appropriate.
Although the small sample size and the attrition rate of the studied population, our findings may suggest the potential role of FC changes in extramotor areas as candidate radiological markers of disease progression, preceding the appearance of major cognitive impairment, probably better suited as outcome measures than FC and structural metrics’ changes in motor areas. FC measures need further refinement and standardization, but may have a potential role as outcome measures in ALS along the entire disease course.
Acknowledgments
The authors thank all patients and healthy controls for their willingness to participate in the present study.
Disclosures
The authors declare that this research was conducted in the absence of any commercial or financial relationships that could be construed as a potential conflict of interest.
Supplementary Materials
To view supplementary material for this article, please visit http://dx.doi.org/10.1017/S109285292000005X.