

Introduction
Campaign contributions’ salience in politics and elections is both obvious and well-understood and persists as the subject of sustained scholarly attention.Footnote 1 Such sustained attention no doubt reflects campaign contributions’ consistent influence on electoral outcomes (Fowler, Garro, and Spenkuch Reference Fowler, Garro and Spenkuch2020; Green and Gerber Reference Green and Gerber2019). Curiously, however, comparatively far less is known about campaign contributions in the local prosecutor election setting. Indeed, even basic questions about how campaign contributions vary across prosecutor candidates and districts have largely escaped sustained or granular scholarly attention. This is so despite local prosecutors’ critical importance to the administration of criminal justice at the retail level in the United States. This is also so despite the ever-increasing amount of campaign contributions that prosecutor elections attract.
Given campaign contributions’ salience to election outcomes generally (Fowler et al. Reference Fowler, Garro and Spenkuch2020; Green and Gerber Reference Green and Gerber2019), the comparative paucity of research on local prosecutor candidate fundraising surprises (but see, e.g., Hessick, Morse, and Pinnell Reference Hessick, Morse and Pinnell2023b). While much of the limited research in local prosecutor election context explores how variation in reported campaign contributions across candidates may inform electoral outcomes, far less research explores factors that help explain how campaign contributions vary across local prosecutor candidates. Greater clarity on this issue (and others) is important because while general concerns about campaign contributions’ possible corrosive effects on democratic processes are well-understood and documented (e.g., Grier, Grier, and Mkrtchian Reference Grier, Grier and Mkrtchian2023), whether such concerns emerge in the local prosecutor electoral context remains comparatively underexplored.
Aside from uncertainty about campaign contributions’ influence on local prosecutor elections, the sheer scale, and recent growth, of prosecutor candidates’ fundraising alone warrant increased scholarly attention (Hessick Reference Hessick2024). While a sizable portion (almost 40%) of candidates in districts’ most recent local prosecutor elections reported receiving no campaign contributions, the per-candidate mean of those candidates who received reportable contributions exceeds $71,000. Indeed, one candidate from Cook County, IL (Chicago), Kim Foxx, raised more than $3M for her 2016 election (Hessick et al. Reference Hessick2023b). Similarly, total candidate fundraising in one district election, Queens, NY, surpassed $7M (Hessick et al. Reference Hessick2023b).
Intersections involving prosecutor candidate fundraising, electoral contestation, and candidate incumbency also warrant close research attention, given the out-sized role each factor plays in candidates’ prospects for electoral success. Concerns about local prosecutor election contestation issues are both real and growing. For unopposed candidates running in uncontested elections, success was functionally assured. Similarly, though to a slightly lesser extent, incumbent prosecutor candidates win almost 90% of their elections (Hessick and Morse Reference Hessick and Morse2020). Of the 2,205 local prosecutor district elections included in this study, 70% involved uncontested elections and 80% included incumbent candidates. As well, almost 59% of the prosecutor elections involved an unopposed incumbent candidate. Such a high ex ante likelihood of electoral success should, on balance, reduce pressure on unopposed and incumbent candidates to raise campaign contributions.
Also notable is that unopposed candidates, despite virtual ex ante assurance of electoral victory, nonetheless received more than $15.9M in reported campaign contributions. While what motivates donors to contribute to candidates virtually certain to win may be unclear, the array of possible donor motivations includes troubling ones. For example, in those districts where sufficient donor information exists, attorneys emerge as the leading identified group of contributors to prosecutor candidates (Heise Reference Heise2025). This is important insofar as some percentage of the attorney donors include defense attorneys whose practices could involve professional interactions with local prosecutors.
This study undertakes two main descriptive tasks. One task involves mapping the broad contours of how reported campaign contributions distribute across local prosecutor candidates and districts. A second, related task involves developing an initial accounting of key factors, including candidate incumbency, electoral contestation, and district population, that plausibly inform local prosecutor campaign fundraising efficacy. To accomplish its objectives, this study leverages a leading and recently released prosecutor election and campaign contributions dataset that includes information on 3,123 prosecutor candidates and their most recent elections across 2,205 districts between 2012 and 2019.
Findings in Table 1 underscore one key point, and this point informs this study’s empirical strategy. Specifically, across the 2,205 districts in this study 70% of the most recent prosecutor elections were uncontested. As the outcomes of these uncontested elections were clear ex ante, this electoral outcome clarity, in turn, likely informed candidate campaign contribution amounts. Owing to the observed (and assumed) systematic differences distinguishing uncontested and contested local prosecutor elections, analyses in this study consider these two different election types separately.
Descriptive Statistics, by Election Type

Table 1. Long description
The table is organized into three columns of means: 1 All, 2 Uncontested, and 3 Contested.
Candidate-level variables:
- Total contributions (cand. $): All 42,793; Uncontested 10,230; Contested 75,169.
- Incumbent candidate (1 = yes): All 0.57; Uncontested 0.83; Contested 0.30.
- Female candidate (1 = yes): All 0.21; Uncontested 0.18; Contested 0.25.
- Democratic candidate (1 = yes): All 0.29; Uncontested 0.25; Contested 0.34.
- Republican candidate (1 = yes): All 0.53; Uncontested 0.58; Contested 0.48.
- Progressive (1 = yes): All 0.02; Uncontested 0.00; Contested 0.04.
- N: All 3,123; Uncontested 1,557; Contested 1,566.
District-level variables:
- Total contributions (distr. $): All 60,609; Uncontested 10,356; Contested 176,484.
- Incumbent election (1 = yes): All 0.80; Uncontested 0.84; Contested 0.70.
- Progressive cand. election (1 = yes): All 0.03; Uncontested 0.00; Contested 0.09.
- Multi-county district (1 = yes): All 0.15; Uncontested 0.14; Contested 0.16.
- Budget per capita: All 16.81; Uncontested 16.70; Contested 17.07.
- Population (log): All 10.59; Uncontested 10.38; Contested 11.09.
- Partisan mismatch (1 = yes): All 0.19; Uncontested 0.19; Contested 0.21.
- N: All 2,205; Uncontested 1,538; Contested 667.
State-level variables:
- Excludes uncontested (1 = yes): All 0.33; Uncontested 0.33; Contested 0.33.
- Partisan election (1 = yes): All 0.86; Uncontested 0.85; Contested 0.89.
- Straight ticket option (1 = yes): All 0.29; Uncontested 0.28; Contested 0.31.
- N: All 45; Uncontested 44; Contested 45.
Source: Local Prosecutor Campaign Contributions, 2012–2019, Prosecutors and Politics Project Dataverse, UNC Dataverse (June 23, 2023) (candidate- and district-level datasets). A scaled ordinal version of the Budget per capita variable is included in the models.
Notably, these two different electoral contexts (uncontested and contested prosecutor elections) nonetheless share a few key factors that systematically inform variation in candidate fundraising totals. As Tables 5 and 6 illustrate, key factors that influenced local prosecutor candidate fundraising success in uncontested elections include district population as well as electoral districts that include two (or more) more counties. As expected, however, a far richer and more complex set of factors germane to candidate fundraising emerges as salient across contested local prosector elections. Overall, along with the consistent influence of district population, Republican and progressive candidates proved comparatively more successful when it came to campaign fundraising. Somewhat curiously, candidate incumbency’s influence on campaign contributions varies across the candidate and district levels. Insofar as increases in candidates’ reported fundraising totals (along with incumbency status) systematically correspond with an increased probability of an election win (Table 7), factors that inform local prosecutor candidates’ campaign contributions warrant greater and sustained attention. Taken together, findings make clear that while campaign contributions inform prosecutor election outcomes, factors that inform fundraising success vary across the candidate and district levels as well as contested and uncontested elections and, in so doing, suggest important distributional concerns.
Literature review
Research on campaign contributions in various electoral settings is both long-standing and well-developed. Given elections’ importance and campaign contributions’ potential influence, a great deal of research emphasizes how campaign spending influences election outcomes (e.g., Wang Reference Wang2022; Schuster Reference Schuster2020; Hall Reference Hall2016; Bonneau Reference Bonneau2007; Gerber Reference Gerber1998). As well, Schuster (Reference Schuster2020) helps explain how different types of campaign spending vary in terms of their impact on electoral outcomes. Moreover, the influence of candidate campaign fundraising on electoral success is not limited to elections in the United States. For example, Wang (Reference Wang2022) studied candidate-level election data from 2008 through 2016 in Taiwan and found that increases in a candidate’s campaign contributions correspond with increases in that candidate’s probability of electoral success. Similar research findings emerge in Irish, Korean, and British elections as well (e.g., Benoit and Marsh Reference Benoit and Marsh2008; Shin et al. Reference Shin, Jin, Gross and Eom2005; Pattie, Johnston, and Fieldhouse Reference Pattie, Johnston and Fieldhouse1995).
While a campaign contribution advantage systematically increases a candidate’s likelihood of electoral success (Hall Reference Hall2016; Le et al. Reference Le, Onur, Sarwar and Yalcin2024), it does not, of course, guarantee it. Indeed, the most recent United States presidential campaign, anomalous for an array of reasons, is also notable in that the losing candidate, former Vice President Kamala Harris, significantly outraised and outspent her opponent, President Donald Trump (Schleifer and Sun Reference Schleifer and Sun2024). Anomalies notwithstanding, however, the weight of research findings implies a positive association between a candidate’s campaign fundraising and electoral success, and these findings are generally robust over time.
Adjacent to research on the relation between campaign fundraising success and electoral outcomes is a comparatively less well-developed research literature on campaign donors’ behaviors, motivations, and objectives. Much of this research separately analyzes contributions from political action committees (PACs) (e.g., Bonica Reference Adam2013) and individuals (e.g., Barber Reference Barber2016; McCarty, Poole, and Rosenthal Reference McCarty, Poole and Rosenthal2006), as Barber (Reference Barber2016) finds that these two different groups of donors give for systematically different reasons. When it comes to individual-level donor motivations for their campaign contributions, Barber (Reference Barber2016) emphasizes donors’ ideological preferences. Relatedly, Verba, Schlozman, and Brady (Reference Verba, Schlozman and Brady1995) note that more ideologically extreme and wealthy individuals are more likely to donate to political campaigns. Research also suggests that specific electoral contexts can attract campaign contributions from predictable sources. For example, attorneys account for an important share of campaign contributors in local elections for state judges (e.g., Yanez and Sukhatme Reference Yanez and Sukhatme2024) as well as local prosecutors (e.g., Hessick et al. Reference Hessick2023b). Regardless of the electoral context, however, observed increases in candidate fundraising over time underscore the need for a more granular understanding of factors that inform candidate fundraising success.
Existing empirical research on campaign contributions and their various influences understandably focuses on local, state, and federal legislative bodies, and, to a lesser extent, elected state judges. By contrast, comparatively less research explores campaign contributions in the local prosecutor electoral setting.Footnote 2 However, if prosecutor candidate fundraising success influences prosecutor election results, as the weight of research suggests (e.g., Fowler et al. Reference Fowler, Garro and Spenkuch2020), and if elections influence prosecutors’ conduct and use of discretion, as research also implies (McCannon Reference McCannon2018; Nelson and Samarth Reference Nelson and Samarth2022), the combination of these two findings identifies a potential indirect pathway that plausibly links prosecutors’ campaign contributions and how they perform their duties and exercise their broad discretion. This possibility is important as prosecutors’ discretionary decisions can lead to incarceration for individuals even though various components of prosecutors’ decisions often lack transparency (Misner Reference Misner1996; Hessick and Pinnell Reference Hessick and Pinnell2021; Ouziel Reference Ouziel2022). Such a possibility contributes to the need for greater research attention to campaign contributions in the local prosecutor election context.
Existing research in the local prosecutor context considers the various ways in which local prosecutor decision-making and discretion respond to general electoral pressures. For example, Dyke (Reference Dyke2007) observes that case dismissals decrease when a prosecutor is up for re-election. McCannon (Reference McCannon2013) finds that appellate courts are less likely to affirm a lower court’s conviction when the conviction occurred during the prosecutor’s re-election. Bandyopadhyay and McCannon (Reference Bandyopadhyay and McCannon2015, Reference Bandyopadhyay and McCannon2014) argue that the proportion of convictions that arise from jury trials, rather than plea bargains, increases during a prosecutor’s re-election and is further distorted in contested prosecutor elections. Bandyopadhyay and McCannon (Reference Bandyopadhyay and McCannon2018) follow-up their finding of decreased plea bargains during prosecutors’ re-elections with parallel findings of growing case backlog queues when prosecutors run for re-election. Likewise, Nadel, Scaggs, and Bales (Reference Nadel, Samuel and Bales2017) find that the timing of prosecutor elections corresponds with increased prison admission rates. Finally, evidence of electoral influences on criminal justice outcomes is by no means limited to prosecutors. Studies of public defender elections in Florida, for example, suggest that the timing of elections maps onto systematic increases in plea bargains and defendant acquittals (McCannon Reference McCannon2018).
Emerging research in the local prosecutor setting considers how campaign contributions may inform various prosecutor election outcomes as well as identifies key factors that correspond with candidate fundraising variation. Whether a local prosecutor election is contested, for example, systematically corresponds with candidates’ campaign contribution totals (Heise Reference Heise2025). Hessick, Treul, and Love (Reference Hessick, Treul and Love2023a) also note the influence of electoral district population as well as electoral contestation on campaign contribution totals. Moreover, Hessick et al. (Reference Hessick2023b) find that, as a donor group, attorneys provide a disproportionate amount of the campaign contributions reported by local prosecutor candidates. This is important owing to the possibility that some of these donors could include defense attorneys who professionally interact with local prosecutors.
That electoral battles persist over local prosecutor offices and their policies underscores that the exercise of prosecutorial discretion possesses real-world consequences for many (Epps Reference Epps2021; Wright and Miller Reference Wright and Miller2010). This should surprise few, as prosecutors have long occupied a central role in the criminal justice system. Of late, however, and particularly incident to the rise (and more recent fall) of so-called “progressive prosecutors,” local prosecutors and their elections have increasingly become political flashpoints nested within enduring national debates over criminal justice reform (Pfaff Reference Pfaff2023; Davis and Taylor Reference Davis and Taylor2025; Carson et al. Reference Carson, Cann, Yates and Wright2026). A growing number of progressive prosecutors campaign for office on platforms that emphasize various reforms, which typically include promises to use the power of their office in less punitive ways (Hessick Reference Hessick2023b; Hessick and Su Reference Hessick and Su2023; Pfaff Reference Pfaff2023).
This nascent rise in progressive prosecutor candidates, however, has also elicited concurrent state-level efforts to limit or circumvent prosecutorial discretion (Carson et al. Reference Carson, Cann, Yates and Wright2026). These efforts include legislative proposals to curtail locally-elected prosecutors’ authority or discretion or replacing them altogether with state appointees. One consequence incident to the collision of these factors is that local prosecutors have increasingly become controversial and sometimes polarizing political actors (Carson et al. Reference Carson, Cann, Yates and Wright2026). Accordingly, in this increasingly fraught electoral context, what campaign contributions to local prosecutor candidates might be “purchasing” warrants careful attention.
Data and empirical strategy
Data
The data analyzed in this study derive from three main sources. One source includes candidate-level data on reported campaign contributions to local prosecutor candidates. Candidate-level campaign contribution data were then merged with a nation-wide district-level prosecutor election dataset. Finally, additional state-level information on presidential election results and various state election laws further supplement the final dataset. The resultant candidate- and district-level datasets include information on virtually all prosecutor candidates (N = 3,123) in almost every district across the 45 states that elect local prosecutors and gather sufficient campaign contribution information for each district’s (N = 2,205) most recent prosecutor election cycle between 2012 and 2019.
Dependent variables
As this study principally explores factors that inform variation in local prosecutor candidates’ reported campaign contributions, the analyses focus on two distinct, though related, dependent variables: Total contributions (cand.) and Total contributions (distr.). The former variable measures each prosecutor candidate’s campaign contributions, if any. The latter reflects the summation of reported campaign contributions across all candidates within each district. In addition, supplementary analyses consider whether candidate fundraising variation systematically influenced electoral success for prosecutor candidates who ran in contested elections (Candidate won – contested).
As Table 1 illustrates, prosecutor candidates reported receiving, on average, just under $43,000 in campaign contributions. Insofar as almost 40% of the candidates reported receiving no campaign contributions (or declined all contributions), the mean total for those candidates who reported contributions is $71,000 per candidate. At the district level, Table 1 reports a mean of $60,609 in total campaign contributions raised and reported across candidates within each district. This district-level mean jumps to over $100,000 for the 55% of districts that reported any contributions. To illustrate how money increasingly saturates local prosecutor elections, one prosecutor candidate, Kim Foxx (Cook County, IL), raised more than $3M for her 2016 election. Similarly, district-level campaign contribution totals in one district (Queens, NY) exceeded $7M.
While information on all reported campaign contributions to local prosecutor candidates during the study period are available for 96% of the districts that held prosecutor elections, approximately 45% of these districts reported no contributions. Of course, candidate or district reports of no campaign contributions do not necessarily mean that no dollars flowed to those candidates or into their electoral districts. For example, campaign contribution activity may have failed to exceed a district’s reporting threshold. Relatedly, Hessick et al. (Reference Hessick2023b) note that campaign contribution reporting thresholds vary across states and range from $200 to $5,000.
Moreover, the absence of reportable campaign contributions in 45% of the local prosecutor districts, for whatever reason, while potentially high, is not necessarily atypical in the local, county-level electoral context. Bellin (Reference Bellin2020) observes that local prosecutor elections are “relative bargains” compared to other political offices. In addition, a paucity of campaign contribution activity may also reflect overall voter and candidate disinterest in prosecutor elections. Indeed, prosecutor candidates regularly run unopposed and, in some jurisdictions, “it is difficult to find anyone willing to take the job” (Bellin Reference Bellin2020, 708).
Campaign contribution data from adjacent local elections provide additional context. For example, prior to 2008, state (Texas) district court judicial elections in Harris County (the Houston area) were noted for consistent Republican candidate success and unopposed elections. Consequently, only 25% of the Democratic judicial candidates received any reportable campaign contributions (Yanez and Sukhatme Reference Yanez and Sukhatme2024).
Independent variables
Independent variables in this study, summarized in Table 1, aggregate at the candidate, district, and state levels.
Key candidate-level independent variables likely to inform campaign contributions include those relating to electoral contestation and incumbency. Unopposed candidate signals those prosecutor candidates who ran unopposed in both the primary and general elections. As Table 1 illustrates, among the 3,123 candidates, 1,557 (49.9%) ran unopposed.
While a candidate’s status as unopposed assuredly implicates the candidate’s fundraising potential, the direction of its influence is comparatively less clear. On the one hand, unopposed prosecutor candidates whose electoral success is virtually assured ex ante presumably require fewer campaign contributions than prosecutor candidates participating in contested elections. Indeed, average candidate total contributions for contested candidates ($75,169) exceed average total contributions for unopposed candidates ($10,230) by more than a factor of seven. On the other hand, however, an alternative “war chest” hypothesis suggests that candidates are incented to raise campaign contributions in an effort to deter potential challengers and help secure uncontested elections. Existing empirical support for these competing hypotheses is mixed (Goodlife Reference Goodliffe2004; Hessick et al. Reference Hessick2023b).
While the assumption that prosecutor candidates running unopposed require fewer campaign contributions is relatively intuitive, how to operationalize electoral contestation is comparatively less so. Consistent with the weight of existing research (Hessick and Morse Reference Hessick and Morse2020; Hessick et al. Reference Hessick2023b), this study construes those districts that operate primary and general elections as engaging in a single electoral contest. Given the ample variation in election mechanics involving 3,123 candidates across 2,205 districts and that elections yield a single prevailing prosecutor for each district, treating each district’s election process as a single event better reflects reality. Consequently, and similar to Hessick et al. (Reference Hessick2023b), this study construes a candidate as unopposed or an election as uncontested if electoral contestation was absent in both the primary and general elections.
Such an approach to electoral contestation more aptly assesses whether, from a voter’s perspective, there was an “electoral opportunity to choose the current prosecutor” (Hessick and Morse Reference Hessick and Morse2020, 1563). On balance, the approach adopted in this study better reflects that, in some districts, voters’ only meaningful choice occurs in a primary election because voters in that district skew heavily in favor of one political party. Moreover, as virtually all (99.4%) of the unopposed prosecutor candidates in this dataset flow from single-candidate districts, these candidates lacked opposition in both primary and general elections.
Independent of – though related to in many instances – electoral contestation, the importance of incumbency in the prosecutor campaign contribution context is difficult to over-emphasize. Table 1 (Column 1) illustrates that, overall, more than one-half (57%) of the prosecutor candidates ran as incumbents. Table 1 (Columns 2 and 3) also makes clear how incumbency intersects with electoral contestation. Specifically, incumbent candidates were far more likely to run in unopposed (83%) rather than contested (30%) elections.
Incumbent candidates’ overwhelming electoral success rate further contributes to incumbency’s salience in the local prosecutor electoral setting. Hessick and Morse (Reference Hessick and Morse2020, 1544) note that incumbent prosecutors seeking re-election “win an astonishing 95 percent of the time.” Incumbent candidates in this dataset prevailed in 89% of their elections which comports with prior research. To be sure, however, the palpable electoral advantage enjoyed by incumbent candidates can be partly attributed to the comparatively higher number of uncontested elections that incumbent candidates confront. At the same time, the presence of an incumbent candidate may reduce the probability of a contested election. Regardless of the reason, incumbent candidates confront comparatively less electoral uncertainty ex ante, and this reduced uncertainty should, in turn, reduce pressure on incumbent candidates’ fundraising efforts.
While this study of local prosecutor campaign contribution variation focuses on electoral contestation and incumbency’s influence, additional variables are both necessary and helpful. For example, given the prominence of so-called “progressive” prosecutors during this study’s timeframe (2012–2019), the Progressive candidate variable signals the 66 candidates (2%) identified as “progressive” or “reform” prosecutor candidates (Green and Slansky Reference Sklansky2017; Green and Rophie Reference Green and Roiphe2020; Levin Reference Levin2021; Hessick et al. Reference Hessick2023b). As Hessick et al. (Reference Hessick2023b) note, identifying progressive (or “reform”) prosecutor candidates is not an easy task. That no single, stable definition exists reflects the relative infancy of the progressive prosecutor movement as well as the wide array of jurisdictions in which progressive candidates have run. Nonetheless, in an effort to tether this study to prior scholarship, this study incorporates a consensus list of progressive candidates used in prior studies (e.g., Hessick et al. Reference Hessick2023b, 1838-39 tbl.14; Pfaff Reference Pfaff2023).
Candidates’ various political party options unsurprisingly include the two traditional political parties. As Table 1 notes, the Democratic candidate and Republican candidate variables identify 29 and 53% of the prosecutor candidates, respectively. To help assess gender’s possible influence (Carson et al. Reference Carson, Cann, Yates and Wright2026), Female candidate identifies 21% of the prosecutor candidates in the dataset.
Many of the factors that aggregate at the district level and plausibly inform prosecutor campaign contribution variation track those found at the candidate level. Incumbent election identifies those district elections that included an incumbent candidate. Even though most prosecutor districts are single-county districts, Multi-county district identifies elections in districts that drew from multiple counties (across 16 states). Budget per capita reflects the dollars spent per person by the district’s prosecutors’ office. As the weight of political science research suggests that electoral contestation is more likely in a general election if an incumbent is not of the party that received the majority of votes in the most-recent presidential election (Jacobson Reference Jacobson1989), the Partisan mismatch variable identifies those districts where an incumbent prosecutor was not representing the party that received the majority of votes in the 2016 presidential election. Finally, as researchers consistently find that population variation across districts informs prosecutor elections, including the likelihood of contested elections (Hessick et al. Reference Hessick, Treul and Love2023a; Heise Reference Heise2025), models in this study include a Population variable which reflects the natural log of each district’s 2010 population to explore whether district population variation likewise corresponds with reported campaign contributions’ variation.
Although districts in 45 states elect their local prosecutors, the legal rules governing prosecutor elections vary across states. Election law variation across states likely influences such factors as when would-be candidates decide to enter a race, how well candidates fare against one another, and, germane to this study, prosecutor candidate fundraising. To better account for election law variation, this study focuses on three key state-level election law differences.
First, some states exclude uncontested elections from either their primary or general ballots, or both. In these states, unopposed candidates avoid having to stand for election. As Hessick and Morse (Reference Hessick and Morse2020) observe, this practice could potentially reduce the number of contested prosecutor elections because voters (and potential challengers) are not reminded on an election day that this is, indeed, an elected office and that there is not much of a choice. Excusing unopposed prosecutor candidates from standing for election possesses obvious implications for candidate fundraising as well. To account for these possible influences, Excludes uncontested identifies those districts in the 17 states that exclude uncontested elections from either primary or general election ballots.
Second, while a local prosecutor’s office is a partisan office in a majority of states, a minority of states classify the office as non-partisan and, as a consequence, omit prosecutor candidates’ political party affiliation on ballots. Five states hold non-partisan prosecutorial elections, and two additional states permit counties to determine whether to hold partisan or non-partisan elections. Existing research largely splits on whether this rule affects contested prosecutor elections and, in turn, candidate fundraising. On the one hand, Wright’s (Reference Wright2014) study of prosecutor elections in fifteen states observes that states with non-partisan elections had higher rates of contested elections. On the other hand, Hessick and Morse (Reference Hessick and Morse2020) do not observe a correlation between non-partisan elections and contestation. While Hessick and Morse (Reference Hessick and Morse2020) do not find direct implications for electoral contestation on candidate fundraising, possible candidate fundraising consequences attributable to a non-partisan election persist. To control for these possible influences, the Partisan election variable signals prosecutor offices classified as partisan.
Finally, ten states allow voters to cast party-line votes rather than vote on individual candidates. Research implies that a “straight ticket voting” option can nudge some individuals to vote in a partisan direction in general elections (Engstrom and Roberts Reference Engstrom and Roberts2020; Hessick et al. Reference Hessick2023b). Thus, a straight ticket voting option could influence the competitiveness of general elections with a partisan mismatch: that is, an incumbent’s comparative advantage could be diluted by voters who select this option since the majority of voters are from the opposing party. If so, Hessick et al. (Reference Hessick2023b) suggest that challenging candidates may be more inclined to emerge and, if so, a competitive election is more likely in straight ticket voting states and when a partisan mismatch emerges. Once again, to the extent that a straight ticket voting option informs prosecutor elections and their outcomes, it also follows that a straight ticket voting option may likewise inform prosecutor candidate fundraising. To account for this possibility, Straight ticket option identifies districts in the ten states that provide voters the option for straight ticket voting. A descriptive summary of the universe of variables included in the models follows in Table 1.
Data limitations
While it remains difficult to over-state the recently released datasets’ importance to empirical work on local prosecutor elections, these datasets are not without limitations. For example, although one of the datasets’ key features is that district-level prosecutor election outcomes can be linked to candidate-level campaign contribution data, information on the timing of these candidate campaign contributions is not included. As well, although the datasets span from 2012 to 2019, the datasets are nonetheless fundamentally cross-sectional as they draw from each district’s most recent local prosecutor election during that time frame across the more than 2,300 districts nationwide. What will be even more helpful for future research are longitudinal datasets designed to detect possible time trends. This aspect may be especially important to help assess a recent emergence of so-called “progressive” prosecutor candidates.
Empirical strategy
Two main factors inform this study’s empirical strategy. First, because prior research emphasizes that uncontested and contested local prosecutor elections systematically differ in fundamental ways (e.g., Heise Reference Heise2025; Hessick et al. Reference Hessick, Treul and Love2023a), including ways germane to campaign contributions (Heise Reference Heise2025), the main analyses in this study (Tables 5 and 6) separate uncontested and contested prosecutor elections. Relatedly, contested prosecutor elections challenge the assumed independence between (or among) candidates running against each other in a single district. Accordingly, candidate-level analyses of contested prosecutor elections include an alternative specification that incorporates district-level fixed effects (Table 5, Column 3).
Second, the number of prosecutor candidates who reported receiving no campaign contributions or whose contributions fell below reporting thresholds contributes to the over-dispersion observed in the dependent variables (Figures 1A and 1B). Accordingly, zero-inflated negative binomial regression (“ZINB”) models were estimated to identify factors that correlate with prosecutor candidate campaign contributions.Footnote 3 As prosecutor elections legally and administratively nest within states, and consistent with prior research (Hessick et al. Reference Hessick2023b; Heise Reference Heise2025), specifications cluster on states. Analyses of prosecutor campaign contributions initially focus on candidate-level data (Table 5). A similar (but not identical) set of analyses focuses on prosecutor campaign contributions aggregated at the district-level (Table 6). Moreover, supplemental analyses explore variables, including campaign contributions, which help account for electoral outcomes in contested prosecutor elections (Table 7). As the dependent variable in this final set of analyses is bimodal, the final set of estimations involves logistic regression models.
(A) Total Campaign Contributions to Prosecutor Candidates, By Election Type. (B) Total Campaign Contributions Across Prosecutor Candidates Within District, By Election Type.
Notes: (A) Candidate-level dataset; N = 3,123. (B) District-level dataset; N = 2,205.
Source: Local Prosecutor Campaign Contributions, 2012–2019, Prosecutors and Politics Project Dataverse, UNC Dataverse (June 23, 2023) (candidate- and district-level datasets).

Figure 1. Long description
Panel A contains two histograms showing candidate-level data. The Y-axis is Percent from 0 to 100. The X-axis is Total Campaign Contributions to Prosecutor Candidates from 0 to 3 M.
* The Contested histogram shows a tall bar near 0 at approximately 83 percent, with a very thin tail extending toward 1 M.
* The Uncontested histogram shows a single dominant bar near 0 at nearly 100 percent, with almost no visible data beyond the first bin.
Panel B contains two histograms showing district-level data. The Y-axis is Percent from 0 to 100. The X-axis is Total Campaign Contributions Across Prosecutor Candidates Within District from 0 to 8 M.
* The Contested histogram shows a bar near 0 at approximately 84 percent, with a slightly longer tail extending toward 2 M compared to Panel A.
* The Uncontested histogram shows a dominant bar near 0 at nearly 100 percent, with negligible values beyond the initial bin.
Results
Before turning to the regression results, a brief discussion of preliminary descriptive findings helps map out some of the broad contours of the local prosecutor electoral and candidate fundraising terrain and, in so doing, supplies useful context.
Descriptive results
A brief description of the magnitude of campaign contributions to local prosecutor candidates, as well as how these contributions distribute across various prosecutor election types, district population, candidate incumbency, and contested election outcomes, follows.
Campaign contributions and electoral contestation
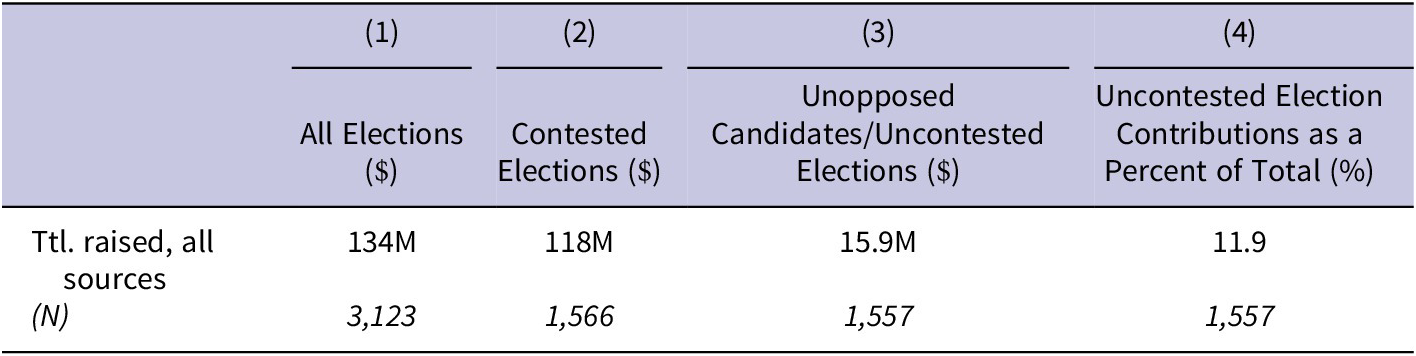
Results presented in Table 2 indicate that prosecutor candidates reported raising approximately $134M (Column 1). Unsurprisingly, campaign contribution totals were comparatively higher in contested elections (Columns 2 and 3). Also notable is that unopposed prosecutor candidates raised $15.9M (Column 3). Indeed, as Column 4 illustrates, almost 12% of the total $134M contributed to prosecutor candidates went to unopposed candidates in uncontested elections. Finally, it is important to recall that while candidates reported receiving approximately $134M in campaign contributions in total, almost 40% of the 3,123 candidates reported receiving no campaign contributions.
Total Contributions to Prosecutor Candidates, by Election Type

Table 2. Long description
The table consists of five columns and two data rows.
Column headers are as follows:
Column 1 is unlabeled.
Column 2 is (1) All Elections in dollars.
Column 3 is (2) Contested Elections in dollars.
Column 4 is (3) Unopposed Candidates or Uncontested Elections in dollars.
Column 5 is (4) Uncontested Election Contributions as a Percent of Total.
Data Row 1: Total raised, all sources.
Column 2: 134M.
Column 3: 118M.
Column 4: 15.9M.
Column 5: 11.9.
Data Row 2: (N).
Column 2: 3,123.
Column 3: 1,566.
Column 4: 1,557.
Column 5: 1,557.
The source is listed as Local Prosecutor Campaign Contributions candidate-level dataset, 2012 to 2019, Prosecutors and Politics Project Dataverse, U N C Dataverse, June 23, 2023.
Source: Local Prosecutor Campaign Contributions (candidate-level dataset), 2012–2019, Prosecutors and Politics Project Dataverse, UNC Dataverse (June 23, 2023).
Prosecutor election contestation and incumbency, by district population
Prior research emphasizes election contestation, candidate incumbency status, and district population as salient for explaining variation in local prosecutor candidates’ campaign contributions (e.g., Heise Reference Heise2025; Hessick et al. Reference Hessick2023b).
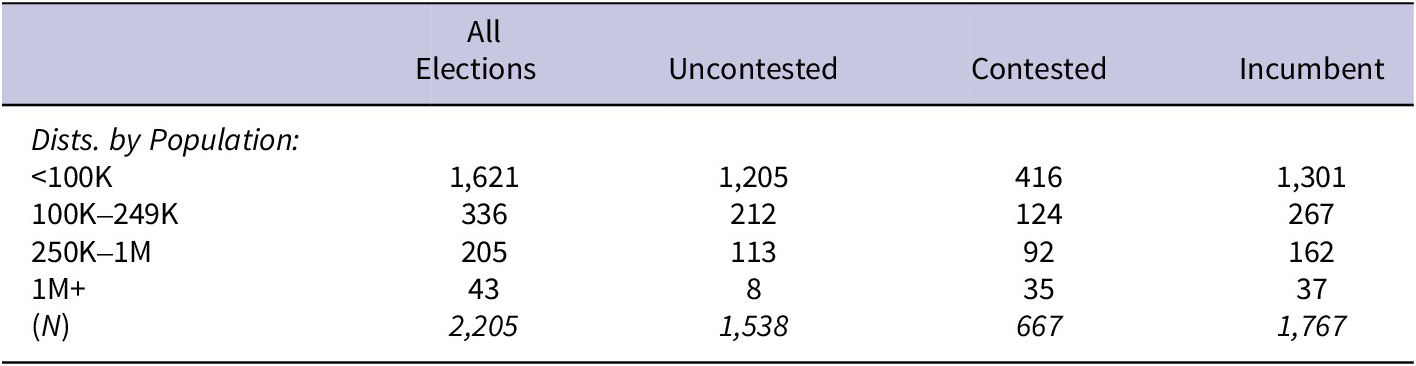
As Table 3 makes clear, prosecutor elections in almost 70% of the districts were uncontested and just over 80% of the district elections included incumbent candidates. Another important aspect that emerges in Table 3 is how candidate contestation and incumbency vary across population levels. Specifically, district population increases correspond with increased electoral contestation and decreased incumbency.
Contestation and Incumbency in Prosecutor Elections, by District Population

Table 3. Long description
The table consists of five columns: Districts by Population, All Elections, Uncontested, Contested, and Incumbent.
* For districts with less than 100 K population: 1,621 total elections, 1,205 uncontested, 416 contested, and 1,301 with an incumbent.
* For districts with 100 K to 249 K population: 336 total elections, 212 uncontested, 124 contested, and 267 with an incumbent.
* For districts with 250 K to 1 M population: 205 total elections, 113 uncontested, 92 contested, and 162 with an incumbent.
* For districts with 1 M plus population: 43 total elections, 8 uncontested, 35 contested, and 37 with an incumbent.
* The final row for N totals shows: 2,205 total elections, 1,538 uncontested, 667 contested, and 1,767 with an incumbent.
Source: Local Prosecutor Campaign Contributions (district-level dataset), 2012–2019, Prosecutors and Politics Project Dataverse, UNC Dataverse (June 23, 2023).
Campaign contributions and contested prosecutor election outcomes
The weight of prior research implies a positive relation between candidate campaign contributions and electoral outcomes generally (e.g., Wang Reference Wang2022; Schuster Reference Schuster2020; Hall Reference Hall2016; Bonneau Reference Bonneau2007; Gerber Reference Gerber1998). This study explores, in part, whether this general finding extends into the local prosecutor election context. To do so, however, requires a focus on the sub-set of prosecutor candidates who participated in contested elections (N = 1,566). When it comes to electoral success, despite robust standard deviations, results in Table 4 imply notable variation in winning and losing candidates’ fundraising prowess. Specifically, the mean total campaign contribution for winning prosecutor candidates exceeds that of losing candidates by just over 60%.
Mean Campaign Contributions in Contested Prosecutor Elections, by Candidate Outcome

Table 4. Long description
The table consists of three columns and four rows. The first column lists the statistical measures, the second column is labeled 1 Winning Candidate in dollars, and the third column is labeled 2 Losing Candidates in dollars.
Row 1, Mean: Winning candidates averaged 95,835 dollars while losing candidates averaged 59,836 dollars.
Row 2, Standard Deviation: Winning candidates have a standard deviation of 268,678 and losing candidates have 174,187.
Row 3, N (Sample Size): There are 667 winning candidates and 899 losing candidates.
The source is cited as Local Prosecutor Campaign Contributions candidate-level dataset, 2012 to 2019, Prosecutors and Politics Project Dataverse, U N C Dataverse, June 23, 2023.
Source: Local Prosecutor Campaign Contributions (candidate-level dataset), 2012–2019, Prosecutors and Politics Project Dataverse, UNC Dataverse (June 23, 2023).
Taken together, results in Tables 2, 3, and 4 generally comport with prior research (e.g., Heise Reference Heise2025; Hessick et al. Reference Hessick2023b; Hessick and Morse Reference Hessick and Morse2020) and suggest that local prosecutor candidates’ reported campaign contribution totals vary across a number of factors, including election types, district population, and electoral outcomes in contested prosecutor elections.
Modeling campaign contributions to prosecutor candidates and contested election outcomes
While the descriptive patterns implied in Tables 2, 3, and 4 do not generally surprise, whether they survive more exacting empirical scrutiny requires additional analyses. The first set of models (Table 5) involves estimations of local prosecutor candidate contributions at the individual candidate level; a second set of models (Table 6) focuses on contributions aggregated across candidates within a district (that is, at the district level). Overall, results from models at both units of analysis (candidate- and district-level) evidence, as expected, how variables behave slightly differently across contested and uncontested prosecutor elections. Finally, results also emphasize the salience of fundraising success on a candidate’s electoral success in contested local prosecutor elections (Table 7).
Zero-Inflated Negative Binomial Regression Models of Campaign Contributions to Prosecutor Candidates, by Election Type (Candidate Level)

Table 5. Long description
The table consists of three columns representing different models: 1 Uncontested, 2 Contested, and 3 Contested with district-level fixed effects. The rows list independent variables followed by coefficients and standard errors in parentheses.
Key variables and results:
* Incumbent candidate (1 = yes): Model 1: -0.22 (0.21); Model 2: 0.07 (0.06); Model 3: 0.33** (0.08).
* Female candidate (1 = yes): Model 1: 0.35 (0.30); Model 2: -0.03 (0.09); Model 3: -0.13 (0.08).
* Democratic candidate (1 = yes): Model 1: 0.66 (0.44); Model 2: 0.20 (0.17); Model 3: 0.41* (0.19).
* Republican candidate (1 = yes): Model 1: -0.09 (0.40); Model 2: 0.17 (0.18); Model 3: 0.55** (0.20).
* Progressive candidate (1 = yes): Model 1: 0.09 (0.29); Model 2: 0.51* (0.21); Model 3: 0.64** (0.20).
* District population (log): Model 1: 0.92** (0.06); Model 2: 0.85** (0.04); Model 3 is not applicable.
* Constant: Model 1: -1.62* (0.78); Model 2: 0.54 (0.53); Model 3: 10.65** (0.20).
Inflate section:
* Incumbent candidate (1 = yes): Model 1: 0.11 (0.24); Model 2: 0.04 (0.19); Model 3: 0.01 (0.27).
* Constant: Model 1: 0.36 (0.31); Model 2: -1.50** (0.19); Model 3: -1.98** (0.19).
Model Statistics:
* District-level fixed effects: Model 1: N; Model 2: N; Model 3: Y.
* A I C: Model 1: 14,022; Model 2: 30,339; Model 3: 29,362.
* B I C: Model 1: 14,102; Model 2: 30,419; Model 3: 29,592.
* Sample size (N): Model 1: 1,545; Model 2: 1,531; Model 3: 1,566.
Notes indicate * p < 0.05 and ** p < 0.01. Models were estimated using the z i n b command in Stata.
Notes: The dependent variable is the total amount of reported campaign contributions to prosecutor candidates. * p <0.05; ** p <0.01. Models were estimated using the “zinb” command in Stata (v.19.5); robust standard errors clustered on states in parentheses.
Source: Local Prosecutor Campaign Contributions (candidate-level dataset), 2012–2019, Prosecutors and Politics Project Dataverse, UNC Dataverse (June 23, 2023).
Zero-Inflated Negative Binomial Regression Models of Campaign Contributions Across Prosecutor Candidates Within a District, by Election Type (District Level)

Table 6. Long description
The table compares two models: (1) Uncontested and (2) Contested. The dependent variable is the total amount of reported campaign contributions to each prosecutor district.
Main Model Variables:
- Incumbent candidate (1 = yes): Uncontested -0.44 (0.24); Contested -0.31** (0.09).
- Progressive cand. election (1 = yes): Uncontested 0.26 (0.20); Contested 0.39* (0.19).
- Multi-county district (1 = yes): Uncontested -0.68** (0.21); Contested -0.24 (0.17).
- Per capita budget (scaled): Uncontested 0.00 (<0.01); Contested 0.00* (<0.01).
- District population (log): Uncontested 0.98** (0.07); Contested 0.93** (0.04).
- Partisan mismatch (1 = yes): Uncontested 0.88* (0.39); Contested 0.24** (0.08).
- Partisan election (1 = yes): Uncontested 0.53 (0.28); Contested 0.16 (0.30).
- St. excludes uncontest. election (1 = yes): Uncontested 0.52 (0.32); Contested 0.52* (0.22).
- Straight ticket option (1 = yes): Uncontested -0.33 (0.21); Contested 0.04 (0.22).
- Constant: Uncontested -1.99* (0.80); Contested 0.26 (0.61).
Inflate Model Variables:
- Incumbent election (1 = yes): Uncontested -0.03 (0.26); Contested 0.18 (0.40).
- Constant: Uncontested 0.48 (0.33); Contested -2.71** (0.33).
Model Fit Statistics:
- A I C: Uncontested 13,772; Contested 14,979.
- B I C: Uncontested 13,841; Contested 15,037.
- N (Sample size): Uncontested 1,521; Contested 652.
Notes: * p < 0.05; ** p < 0.01. Robust standard errors clustered on states are in parentheses.
Notes: The dependent variable is the total amount of reported campaign contributions to each prosecutor district (aggregated across all candidates within each district). * p <0.05; ** p <0.01. Models were estimated using the “znib” command in Stata (v.19.5); robust standard errors clustered on states in parentheses.
Source: Local Prosecutor Campaign Contributions (district-level dataset), 2012–2019, Prosecutors and Politics Project Dataverse, UNC Dataverse (June 23, 2023).
Logistic Regression Model of Contested Prosecutor Election Outcomes (Candidate Level)

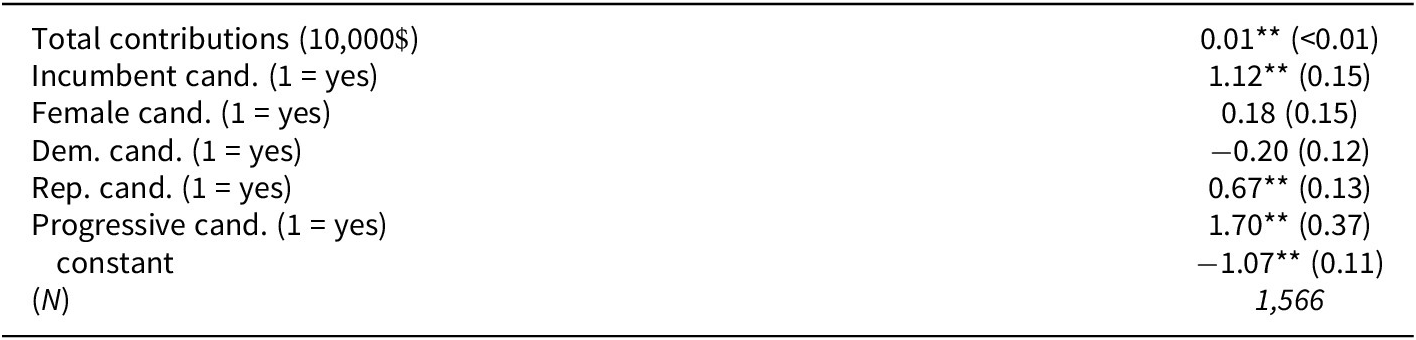
Table 7. Long description
The table consists of two columns. The first column lists the independent variables, and the second column provides the coefficients with standard errors in parentheses.
* Total contributions in 10,000 dollar units: 0.01 double asterisk with a standard error of less than 0.01.
* Incumbent candidate (1 equals yes): 1.12 double asterisk with a standard error of 0.15.
* Female candidate (1 equals yes): 0.18 with a standard error of 0.15.
* Democratic candidate (1 equals yes): minus 0.20 with a standard error of 0.12.
* Republican candidate (1 equals yes): 0.67 double asterisk with a standard error of 0.13.
* Progressive candidate (1 equals yes): 1.70 double asterisk with a standard error of 0.37.
* Constant: minus 1.07 double asterisk with a standard error of 0.11.
* Sample size N: 1,566.
Notes indicate the dependent variable equals 1 if a candidate won. Double asterisks denote p less than 0.01. Models were estimated using the logit command in Stata version 19.5 with robust standard errors clustered on state.
Notes: The dependent variable equals 1 if a candidate won a contested election. * p <0.05; ** p <0.01. Models were estimated using the “logit” command in Stata (v.19.5); robust standard errors clustered on state in parentheses.
Source: Local Prosecutor Campaign Contributions (candidate-level dataset), 2012–2019, Prosecutors and Politics Project Dataverse, UNC Dataverse (June 23, 2023).
Campaign contributions to local prosecutor candidates (candidate-level)
An initial focus on prosecutor campaign fundraising at the candidate level makes sense owing to the considerable fundraising variation observed across the individual candidates. As results in Table 5 suggest, in uncontested elections (Column 1) only the district population and multi-county district variables achieve statistical significance. The persistent systematic influence of district population – specifically, that district population (log) increases correspond with systematic increases in candidate campaign contributions – underscores district population’s salience and comports with prior research (Hessick et al. Reference Hessick2023b).
While Table 5 makes clear that prosecutor candidates systematically raised more money in more populous districts, it is important to keep this finding in context. Specifically, while campaign contributions are comparably higher in higher population districts, including many urban centers, the number of less populous districts greatly exceeds the number of high population districts. Thus, any observed “urban” (or high population) effect on prosecutor campaign contributions is muted somewhat by the comparatively small number of high population districts. Finally, candidates running in districts that drew from multiple counties reported systematically lower campaign contributions totals.
Results for contested elections (Columns 2 and 3) at the candidate level, by contrast, convey a bit more complexity. While the influence of district population persists, findings from the full model (Column 2) emphasize the influence of two additional variables. Specifically, progressive candidates (in contested elections) systematically reported higher campaign contribution totals than their non-progressive counterparts. Similarly, candidates in states that exclude unopposed candidates from appearing on election ballots reported systematically higher campaign contribution totals.
As previously noted, candidate-level results from contested elections need to account for the possibility that a competitive election itself may influence candidates’ (within a district) campaign contribution totals. To account for this possibility, Column 3 reports results that include district-level fixed effects and introduces additional candidate-level variables that warrant note.
Likely contributing to their stunning electoral success rate, incumbent candidates in contested elections systematically raised more campaign contributions than their non-incumbent competitors. Moreover, as these data span local prosecutor elections conducted between 2012 and 2019, which generally map onto a palpable increase in the number of “progressive” prosecutor candidates (Green and Roiphe Reference Green and Roiphe2020; Hessick Reference Hessick2023b; Pfaff Reference Pfaff2023) competing in local prosecutor elections, “progressive” candidates reported systematically higher campaign contribution totals than their non-progressive counterparts. Finally, independent of a candidate’s status as “progressive,” reported campaign contributions to candidates who identified as either republican and democratic systematically exceeded contributions to the 18% of prosecutor candidates who did not run as either a republican or democratic.
Campaign contributions to prosecutor elections (district level)
Overall, a shift in analytic focus from the individual candidate level to the district level does not materially disturb core patterns. This is unsurprising insofar as 70% of the districts involved uncontested prosecutor elections. Consequently, for these 70% of the districts reported fundraising totals at the candidate level, by definition, match fundraising totals aggregated across candidates within a district. Nevertheless, insofar as campaign contribution totals can – and did – vary dramatically across districts in contested prosecutor elections, district-level analyses remain important. Indeed, overall results from district-level analyses of fundraising totals aggregated across candidates within districts, presented in Table 6, emphasize a slightly different mix of factors.
When it comes to variation in campaign contribution totals for uncontested prosecutor elections at the district level, Table 6 (Column 1) illustrates, as anticipated, few changes from candidate-level findings (Table 5, Column 1). Specifically, both the multi-county district and district population variables achieve statistical significance at both the candidate and district level. A district-level focus, however, includes an additional variable, partisan mismatch, that also emerges as salient. The partisan mismatch variable identifies those districts that hold partisan prosecutor elections and where an incumbent prosecutor candidate was not representing the political party that received the majority of votes in the 2016 presidential election. The emergence of these conditions in a district corresponds with a systematic increase in total reported campaign contributions across all prosecutors candidates competing in that district.
Findings from contested prosecutor elections at the district level both comport with and depart from candidate-level findings. What the candidate- and district-level findings share for contested elections includes, for example, the salience of progressive candidates. That is, not only do progressive candidates systematically correspond with increased campaign contributions, but the presence of a progressive candidate in a contested election also corresponds with increased total contributions across all candidates in that district. This overall district-level total campaign contribution total increase (Table 6, Column 2) can be ascribed to a contribution premium realized by progressive candidates (Table 5, Columns 2 and 3), an increase in campaign contributions that flowed to the district’s non-progressive candidates, or some combination of both factors. In addition to the presence of a progressive candidate, candidate- and district-level findings in contested elections also emphasize the salience of district population as well as states that exclude unopposed candidates from even appearing on election ballots.
Comparing candidate- and district-level results also uncovers a complicating wrinkle involving incumbency’s influence on campaign contributions. At the candidate level, incumbent candidates in contested elections systematically raised more campaign contributions than their non-incumbent competitors (Table 5, Column 3). At the district level, however, contested prosecutor elections that included an incumbent candidate correspond with a systematic decrease in total campaign contributions raised across all candidates within that district (Table 6, Column 2).
Closer analysis reveals how this complication may nonetheless cohere. Specifically, when taken together, the candidate- and district-level findings imply that incumbent candidates in contested elections attracted a relatively greater share of that district’s total across all candidates. Stated slightly differently, the contribution premium realized by an incumbent candidate was offset by a campaign contribution penalty inflicted upon the non-incumbent candidates attributable to the presence of an incumbent candidate in a district’s election.
Modeling contested prosecutor election outcomes
While a focus on factors that help explain the variation observed in prosecutor candidates’ ability to attract campaign contributions is important in its own right, a related point involves whether campaign contribution variation correlates with local prosecutor election outcomes. After all, one important reason that likely motivates donors to contribute to a local prosecutor candidate is to help ensure that candidate’s electoral success.
While a prosecutor candidate’s fundraising success can be important for an array of reasons, it is particularly important in the contested election context where, presumably, at least some level of ex ante electoral outcome uncertainty exists. One-half of the 3,123 candidates in the dataset competed in contested elections for the local prosecutor’s office. The 1,566 candidates who competed in these contested prosecutor elections include 667 candidates who prevailed and were elected to serve as local prosecutors. Insofar as this analysis seeks to explore variation across winning and non-winning candidate(s) within each district and, by definition, each district produced a single winning candidate, the model includes only those independent variables that could vary across candidates and within a district.
Results in Table 7 make clear that, consistent with previous descriptive results (Table 4), campaign contributions to the 667 prosecutor candidates who won their contested elections systematically exceeded campaign contributions to those candidates who lost. This result underscores a strong positive relation between a candidate’s fundraising success and the candidate’s favorable electoral outcome in the sub-set of contested prosecutor elections. Notable is that a statistically significant influence exerted by a candidate’s campaign contributions emerges independent of the similarly important influence of candidate incumbency.
While the key independent variable of interest – a candidate’s Total contributions raised – performs as expected, additional results in Table 7 warrant brief discussion. For example, and as expected, incumbent prosecutor candidates systematically outperformed their non-incumbent counterparts. Interestingly, Republican and “progressive” prosecutor candidates also systematically outperformed their respective counterparts.
Interpreting results in Table 7 requires important context as they reflect only the 1,566 prosecutor candidates who competed in the 667 contested elections. As prior results make clear, contested and uncontested prosecutor elections systematically differ in important ways. Consequently, Table 7’s findings include virtually all of the relatively small number of “progressive” prosecutor candidates as well as skew toward the comparatively larger and more urban prosecutor districts.
Incumbency, campaign contributions, and prosecutor election outcomes
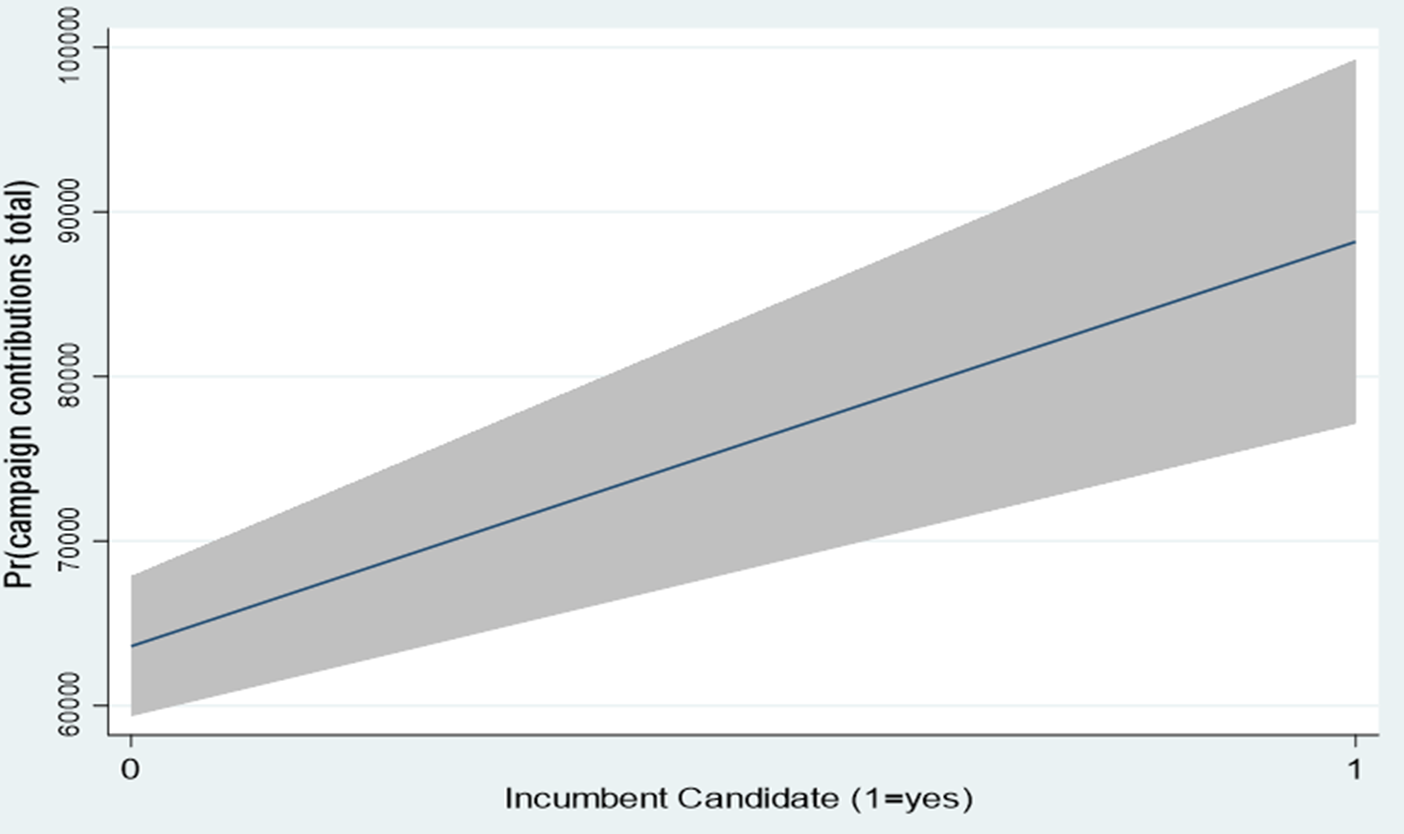
While evidence of candidate incumbency’s influence on campaign contributions in contested elections persists across descriptive and regression analyses, the direction of its influence, as previously noted, varies between the candidate and district levels. To explore this anomaly further, Figures 2 and 3 derive from Tables 5 (Column 3) and 6 (Column 2), respectively, and focus on incumbency’s marginal effects on candidate- and district-level campaign contribution totals in contested elections while keeping all other variables at their means. At the candidate level (Figure 2), what is clear is that incumbent candidates systematically raise more campaign contributions than their non-incumbent candidate counterparts. At the district level (Figure 3), however, total campaign contributions across all candidates within a district were higher when a contested election did not include an incumbent candidate. Taken together, results from marginal effects analyses (Figures 2 and 3) comport with prior regression results (Tables 5 and 6) and reinforce the explanation that the campaign contribution premium realized by incumbent candidates was offset by a contribution penalty inflicted upon the non-incumbent candidates likely attributable, in part, to the presence of an incumbent candidate.
Marginal Effects of Candidate Incumbency on Campaign Contributions to Prosecutor Candidates, Contested Elections (Candidate Level).
Notes: N = 1,566; 95% confidence interval.
Source: Local Prosecutor Campaign Contributions (candidate-level dataset), 2012–2019, Prosecutors and Politics Project Dataverse, UNC Dataverse (June 23, 2023).

Figure 2. Long description
The horizontal X axis is labeled Incumbent Candidate 1 equals yes, with tick marks at 0 and 1. The vertical Y axis is labeled P r campaign contributions total, with values ranging from 60000 to 100000 in increments of 10000.
A solid blue line represents the predicted probability, showing a linear increase from left to right. At X equals 0, the line starts at approximately 63000. At X equals 1, the line ends at approximately 88000.
A shaded gray area surrounds the blue line, representing the 95 percent confidence interval. This band widens as it moves from left to right. At X equals 0, the interval spans from roughly 59000 to 68000. At X equals 1, the interval widens significantly, spanning from approximately 77000 to 99000.
Marginal Effects of a Contested Election Involving an Incumbent on Total Campaign Contributions Across All Candidates Within a District, Contested Elections (District-Level).
Notes: N = 652; 95% confidence interval.
Source: Local Prosecutor Campaign Contributions (district-level dataset), 2012–2019, Prosecutors and Politics Project Dataverse, UNC Dataverse (June 23, 2023).

Despite any potential residual ambiguity relating to candidate incumbency’s influence on campaign contributions in contested elections flowing from Figures 2 and 3, a closer look at incumbency’s influence on prosecutor election outcomes provides additional evidence of incumbency’s outsized role in the local prosecutor election setting. Figure 4 derives from Table 7, focuses on prosecutor election outcomes in contested elections, and assesses the marginal effects of prosecutor candidate incumbency while holding other variables at their means. As Figure 4 makes clear, candidate incumbency’s influence on prosecutor election outcomes in contested elections is palpable and, unsurprisingly, consistent with prior descriptive and regression analyses. Thus, even if incumbency’s influence is nuanced in the campaign contributions context, comparatively far less nuance exists when it comes to contested local prosecutor election outcomes.
Marginal Effects of Candidate Incumbency on Election Win, Contested Elections.
Notes: N = 1,566; 95% confidence interval.
Source: Local Prosecutor Campaign Contributions (candidate-level dataset), 2012–2019, Prosecutors and Politics Project Dataverse, UNC Dataverse (June 23, 2023).

Figure 4. Long description
The horizontal X axis is labeled Incumbent Candidate (1=yes) with tick marks at 0 and 1. The vertical Y axis is labeled P r (election win) with values ranging from .3 to .7 in increments of .1. A solid dark blue line represents the marginal effect, starting at approximately .34 on the Y axis when the X value is 0 and rising linearly to approximately .61 when the X value is 1. A shaded gray area surrounding the line represents the 95% confidence interval. This interval is narrower at the start (approximately .32 to .37) and widens as it moves toward the right (approximately .56 to .67). The upward slope indicates that being an incumbent candidate is associated with a higher probability of winning a contested election.
Adjacent to concerns about candidate incumbency’s influence in the local prosecutor electoral context reside related – though distinct – concerns about campaign contributions’ influence. Hessick (Reference Hessick2024) documents the palpable growth over time in the raw amount of reported campaign contributions in local prosecutor elections. Moreover, results in Table 7 illustrate a strong positive relation between a candidate’s fundraising success and electoral outcome in the sub-set of contested prosecutor elections. As well, descriptive results discussed previously evidence the various ways that campaign contributions to local prosecutor candidates distribute unevenly across candidates. The interaction of these points helps motivate questions about whether increased regulation over local prosecutor candidate fundraising is desirable as a policy matter and, if so, legally feasible.
To enhance transparency, one permissible regulatory lever involves campaign contributions disclosure requirements. Of course, various disclosure requirements already exist and, indeed, the candidate-level campaign contribution data used in this study largely flow from existing campaign contribution disclosure requirements that attach to most candidates for public and elected office, including local prosecutor candidates. Rules mandating campaign contribution disclosure have repeatedly been upheld by the Supreme Court (e.g., Citizens United v. FEC 2010; Buckley v. Valeo 1976).
Efforts to limit or restrict campaign contributions to candidates, including efforts in the elected state judicial candidate context, have consistently confronted various legal barriers. For example, in Caperton v. Massey (2009), the Supreme Court for the first time recognized Due Process concerns arising out of the potential for judicial bias attributable to campaign contributions from a litigant appearing before a judge who was the recipient of financial support from that litigant. Notably, the Court’s opinion as well as the dissents in Caperton implicitly assume an empirical relation between campaign contributions to judicial candidates and their subsequent votes as judges. While the Caperton decision may be narrowly framed as a “recusal” case, the Court’s concerns implicate broader issues flowing from campaign contributions to judicial candidates (which can involve sitting judges) running for election (or re-election) to the bench (Lerner Reference Lerner2013). Additional evidence of the Court’s growing unease with practical implications flowing from campaign contributions to elected judges emerged in a more recent case, Williams-Yulee v. Florida Bar (2015), where the Court upheld Florida Code of Judicial Conduct’s prohibition of state judicial candidates personally soliciting campaign contributions from donors.
Notably, the Court’s Williams-Yulee (2015) decision implies a distinction between judicial and non-judicial elections. Specifically, where campaign contributions to non-judicial candidates raise concerns over the potential for a quid pro quo, contributions to judicial candidates elicit additional concerns involving an appearance of impropriety and judicial integrity. If the Court’s distinction between judicial and non-judicial elections coheres in the context of campaign contribution regulations, precisely where local prosecutors and their elections land on such a continuum is not obvious. That is to say, to the extent that public perceptions of judicial integrity might justify the imposition of comparatively more exacting campaign contribution regulations on judicial elections, similar reasoning may also plausibly attach to local prosecutor candidates and their elections as well.
Conclusion
Insofar as Professors Kang and Shepherd (Reference Kang and Shepherd2013, 1240), among many others, note that “money buys things” in the electoral context, questions about what campaign contributions to local prosecutor candidates might be purchasing warrant close attention. Indeed, public and scholarly attention to local prosecutor candidates, campaign contributions to them, and their elections has increased over time. Much of this increased attention is both explained by, and a function of, increased local prosecutor candidate fundraising. While general concerns about campaign contributions’ possible deleterious effects on democratic processes are well-understood and documented, the salience of such concerns in the elected local prosecutor context remains comparatively under-explored. This is particularly ironic insofar as campaign contributions’ potential influence on prosecutorial discretion can involve potentially life-altering decisions for investigation targets and defendants. Making matters potentially even worse is that many components of prosecutors’ discretionary decisions are often shrouded in secrecy.
When it comes to understanding how reported campaign contribution totals distribute, findings from contested and uncontested election models, as expected, evidence important differences. Notably, however, these differences are generally stable across the candidate- and district-level models. Comparing overall findings from candidate- and district-level models also uncovers one unexpected difference involving a candidate’s (or district election’s) incumbency status. Taken together, findings from this study make clear that while campaign contributions inform prosecutor election outcomes, factors that inform candidate fundraising success vary across contested and uncontested elections as well as across candidate and district levels. These variations, in turn, raise important distributional concerns. The potential distributional concerns emerging from variation in candidate fundraising success in the local prosecutor election context underscore that research on prosecutor candidate fundraising is not merely an academic exercise. After all, related findings from this study also make clear how increases in local prosecutor candidates’ campaign fundraising totals correspond with an increased likelihood of success in contested elections.
In the end, while expanding and extending the empirical literature on prosecutor candidates’ campaign contributions and electoral outcomes provide helpful additional granularity, results from this study do not, however, uncover any obviously efficacious policy levers that respond to various normative and political implications flowing from campaign contribution variation across prosecutor candidates in the United States. Moreover, and complicating matters further, any potential policy levers seeking to regulate the relation between campaign contributions (or incumbency) and local prosecutor candidates will need to navigate among various state and federal constitutional concerns that loom large in this context.
Data availability statement
Replication materials are available at the Journal of Law and Courts Dataverse (https://doi.org/10.7910/DVN/KAKOF8). Source datasets are available at the UNC Prosecutors and Politics Project Dataverse (https://dataverse.unc.edu/dataverse/ppp).
Acknowledgments
An earlier version of this Article was presented at the 2026 Midwest Political Science Association Annual Conference as well as Cornell Law School’s Empirical Legal Studies Colloquium. Thanks as well to Dawn Chutkow, Yun-chien Chang, Michael Morse, Carissa Byrne Hessick, Alexander Love, Jeffrey Yates, Benjamin Bricker, and anonymous referees for their comments on earlier drafts of this Article and/or their generosity regarding access to their datasets, codebooks, and coding.
Financial support
No funding was received for this project.
Competing interests
No conflicts of interest exist.