


I. INTRODUCTION
Biodegradable polymers have attracted more and more interests, since they seem to be good alternatives to petroleum-based polymers, and may be derived from renewable agricultural resources, being easily composted into water and carbon dioxide. Among biodegradable polymers poly(3-hydroxybutyrate) (PHB) plays a special role due its several advantages, its mechanical properties are comparable to those of conventional plastics such as polyethylene and polypropylene, which makes PHB a good candidate to replace the nondegradable conventional plastics in the application of packaging, mulching film, shopping and trash bags, and disposable food containers.Reference Wellen, Rabello, Fechine and Canedo1–Reference Wellen, Rabello, Fechine and Canedo6
PHB is a biocompatible thermoplastic, nowadays it has been used at health care industries as drug releases, prosthesis, and threads for suture. However its low crystallization rate, thermal instability during processing, and easiness to degradation seems to it as a treacherous mechanism attacking its properties, thus precluding the desirable application. An additive which imparts thermal stability and microstructure controls without damaging other characteristics would be very welcome to PHB.Reference Bucci, Tavares and Sell7–Reference Falcone, Agnelli and Faria10
Carbon black (CB) is virtually pure elemental carbon in the form of colloidal particles, it is the predominant reinforcing filler used in rubber compounds, which are required to impart the necessary durability and strength to these products for longer lifetime and greatly improved performance. Application of CB as an antistatic and ultraviolet stabilization agent has provided uses as an additive for fuel caps, pipes for automobiles, and house devices. It is used often in the aerospace industry in elastomers for aircraft vibration control components such as engine mounts. CB is commonly used in many molded and extruded industrial rubber products, such as belts, hoses, gaskets, diaphragms, vibration isolation devices, bushings, air springs, and so on. CB is in the top 50 industrial chemicals manufactured worldwide, based on annual tonnage. From previous works, adding CB to PHB has increased the thermal stability of PHB and promoted its melt and cold crystallization, behaving as a nucleating agent during PHB crystallization.Reference Monteiro11–Reference Del Río, Ojeda and Acosta15
In this work, nonisothermal melt and cold crystallization of PHB in PHB/CB compounds, processed in a laboratory internal mixer, were investigated by means of differential scanning calorimetry (DSC). Besides the scientific importance, nonisothermal crystallization is also valuable for the practical use since they are usually processed under nonisothermal conditions. Three kinetic models, namely, Psuedo-Avrami, Ozawa, and Mo models, were applied to describe the kinetic of crystallization process of PHB in the PHB/CB compounds. Therefore understanding the crystallization kinetics of polymer compounds under nonisothermal conditions is crucial from the scientific and technological prospective in accessing their processing-property relationship.
II. EXPERIMENTAL
A. Materials
Materials were PHB, actually a random copolymer with approximately 4% of 3-hydoxyvalerate units, supplied by PHB Industrial SA (Serrana, Brazil) and CB grade N339 purchased from Negroven (São Paulo, Brazil).
III. METHODS
A. Compounding
PHB compounds containing 0.5, 1, 5, and 10% CB were prepared in a Haake Rheomix 600 laboratory internal mixer (Haake Buchler Instruments, Saddle Brook, New Jersey) fitted with high intensity rotors, with the chamber wall kept at 190 °C and the nominal speed of the rotors was set at 60 rpm for 10 min. Samples of the neat PHB resin were processed under the same conditions for comparison purposes.
B. DSC measurements
Thermal analysis of PHB and PHB/CB compounds was performed in a TA Instruments (New Castle, Delaware) DSC Q20 differential scanning calorimeter, under a nitrogen flow of 50 mL/min, with samples of approximately 5 mg. A thermal cycle in four stages was used: samples were heated from room temperature (approximately 30 °C) to 195 °C, held a constant temperature for 3 min, after which the melt was cooled to 20 °C (cooling stage), and then reheated to 195 °C. Tests were run at constant rates of heating and cooling of 2, 4, 6, 8, 12, 16, 24, and 32 °C/min. Raw data (time-temperature-heat flow) were logged by the DSC at a rate of one point per second.
Four thermal events were identified in most DSC tests, namely, melting during the first heating stage, melt crystallization during cooling, cold crystallization during reheating, and finally, a second melting event. For each crystallization event, the starting and end points of departure from the underlying baseline were visually established in a plot of energy flow (J) versus time (t). The fractional crystallization (or relative crystallinity) x for the event was computed as a function of time by integration:
 $$x\left( t \right) = {1 \over {{E_0}}}\int_{{t_1}}^t {\left| {J\left( {t'} \right) - {J_0}\left( {t'} \right)} \right|{\rm{d}}t'} \quad ,$$
where J 0 is the virtual baseline during the event (straight line in the present case), and E 0 is the total latent heat of phase change:
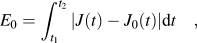 $${E_0} = \int_{{t_1}}^{{t_2}} {\left| {J\left( t \right) - {J_0}\left( t \right)} \right|{\rm{d}}t} \quad ,$$
where t 1 and t 2 are the initial and final times. From which the peak (maximum) and average crystallization rates may be computed. The fractional crystallization may be expressed as a function of temperature (T), knowing the linear relationship between time and temperature during the event:
 $$T = {T_1} + \phi \tau \quad ,$$
where T 1 is the sample temperature at the starting point t 1, τ = t − t 1 is the time measured from the onset of the event, and ϕ = dT/dτ is the (constant) rate of heating or cooling during the event.
A detailed description of the experimental procedure can be found elsewhere.Reference Wellen, Rabello and Canedo12 This contribution is concerned with the correlation between relative crystallinity, time or temperature, and heating/cooling rate during the nonisothermal melt and cold crystallization for PHB and PHB/CB compounds, using three different classical macrokinetic models. Microstructural and microkinetical (mechanistic) interpretation of the results is not considered.
IV. RESULTS AND DISCUSSION
A. Pseudo-Avrami model
AvramiReference Avrami16–Reference Avrami18 developed a very successful macrokinetic model for the isothermal crystallization of polymers, based on sound microkinetic principles. Avrami model correlates the relative crystallinity x in terms of the time τ measured since the start of the event:
 $$x = 1 - \exp \left( { - K{\tau ^n}} \right)\quad .$$
K = K(Τ) and n = n(Τ) are the Avrami parameters—the last one known as the Avrami exponent. Data of nonisothermal crystallization obtained at constant cooling/heating rate may be correlated by an expression formally identical to Avrami Eq. (4):
 $$y = \ln \left( {\ln {1 \over {1 - x}}} \right) = \ln \,K' - n'\ln \,\tau \quad .$$
However, model parameters K′ and n′ are functions of the cooling/heating rate ϕ, not of the temperature, as in Avrami model. We call this empirical correlation model Pseudo-Avrami. Pseudo-Avrami parameters are unrelated to those of the “true” Avrami model; none of the microkinetic interpretations of Avrami parameters are applied to the Pseudo-Avrami parameters. Although Pseudo-Avrami model is widely used in the literature, the standard Ref. Reference Jeziorny19 usually quoted as a source is unsatisfactory; the Pseudo-Avrami model is not “the Avrami model for nonisothermal crystallization”, an honor better bestowed on the Ozawa model.Reference Nakamura, Watanabe, Katayama and Amano20–Reference Nakamura, Watanabe, Amano and Katayama22 Pseudo-Avrami parameters are obtained by linear regression of:
 $$y = \ln \left( {\ln {1 \over {1 - x}}} \right) = \ln \,K' - n'\,\ln \,\tau \quad .$$
Relative crystallinity data were correlated according to Eq. (6) to obtain Pseudo-Avrami parameters. The size of each dataset in the plot depends on the duration of the particular event, containing 300 to 1200 points; the number of datasets per formulation is equal or less than the number of heating/cooling rates tests (eight). Figure 1 shows an example of the Avrami plot y versus ln τ.
Avrami plot (y versus ln τ) for melt crystallization in a PHB/5% CB at three cooling rates (indicted): experimental points (circles) and straight lines (Pseudo-Avrami model) that best fit the data in the main relative crystallinity interval (shown in the right axis).

Tables 1–5 in the Supplementary Information show Pseudo-Avrami parameters and their uncertainties for the melt and cold crystallization events in neat PHB and PHB compounds. Units of the parameter K′ in tables and figures are min−n′; exponent n′ is dimensionless. Figures 2 and 3 show these results in graphical form.
Logarithm of Pseudo-Avrami parameter K′ as function of the heating/cooling rate |ϕ| for melt (a) and cold (b) crystallization. PHB and PHB/CB compounds as indicated.
Pseudo-Avrami exponent n′ as function of the heating/cooling rate |ϕ| for melt (a) and cold (b) crystallization. PHB and PHB/CB compounds as indicated.
Pseudo-Avrami model appears to fit very well the experimental results of each test, as indicated by the very small uncertainty of parameters: 1.5–2% for K′ and 0.4% for the exponent (see Supplementary Information tables).
Pseudo-Avrami parameter K′ increases with the rate of cooling for melt crystallization and with the rate of heating for cold crystallization (Fig. 2). For melt crystallization, a variation of four orders of magnitude (from 4 × 10⁻⁴ to 4) was observed, while values for cold crystallizations are higher (about 30 times higher, especially for low heating rates) and show less variation (two orders of magnitude). Despite the tight fitting in individual tests, K′ values show a fair amount of dispersion and no clearly discernible trend in terms of amount of CB in the sample.
Notice that the units of K′ depend on n′, making problematic quantitative comparisons; we may be comparing K′ = 4 × 10⁻⁴ min−3 to 4 min−2, which is, to say the least, a “peculiar” comparison.
Pseudo-Avrami exponent decreases with the rate of cooling for melt crystallization and is virtually independent of the rate of heating for cold crystallization (Fig. 3). The range of variation for melt crystallization is relatively small (from 2.2 to 3.6, with an average value around 2.8). Similar dispersion of the results and lack of dependence on the CB concentration is observed.
Differentiation of Eq. (5) leads to an expression for the rate of crystallization (differential form of the Pseudo-Avrami model):
 $$c = {{{\rm{d}}x} \over {{\rm{d}}\tau }} = n'{K'^{{1 \mathord{\left/ {\vphantom {1 {n'}}} \right. \kern-\nulldelimiterspace} {n'}}}}\left( {1 - x} \right){\left( {\ln \,{1 \over {1 - x}}} \right)^{{{1 - 1} \mathord{\left/ {\vphantom {{1 - 1} {n'}}} \right. \kern-\nulldelimiterspace} {n'}}}}\quad .$$
Dependence of the exponent with rate of cooling/heating precludes the definition of a kinetic constant. However, considering its limited variability, and using the average value of n′ in that factor of the right hand side of Eq. (7), an approximate kinetic constant may be estimated:
 $$k' \approx n'{K'^{{1 \mathord{\left/ {\vphantom {1 {n'}}} \right. \kern-\nulldelimiterspace} {n'}}}}\quad .$$
Figure 4 shows the almost linear increase of the approximate kinetic constant k′ with the rate of cooling/heating (and similar data dispersion and lack of composition dependence as the Pseudo-Avrami parameter K′). Notice, however, that the approximate kinetic constant is not a function of temperature (as proper kinetic constants are) but of the cooling/heating rate ϕ. In that sense, we may call it a “pseudo kinetic constant”.
Approximate kinetic constant as function of the heating/cooling rate ϕ for melt (a) and cold (b) crystallization. All PHB and PHB/CB compounds tested.
The applicability of an empirical model for a given set of experimental values must be checked by comparing model predictions with the experimental values in question. The difference between predicted and experimental values is a measure of the expected error incurred when the model computations substitute empirical data. This is particularly true with models such as Pseudo-Avrami, in which the model parameters were obtained through manipulation of the original data; a good fit of the Avrami log–log plot and/or a low uncertainty of the parameters estimated from it may suggest that it represents well the experimental data model, but does not prove it.
To proceed with the validation of the Pseudo-Avrami model the predicted value of the relative crystallinity x pre is computed using Eq. (2) with the parameters taken from Tables 1–5 (in the Supplementary Information), and compared with the experimental values x exp measured at the same time.
Figure 5 shows two examples of plots of both x exp (circles) and x pre (lines) versus time τ, to judge visually how well the models fits the experimental results. Figure 6 plots the difference between predicted and experimental values, δ = x pre − x exp, as a function of the relative crystallinity x exp for the same texts illustrated in Fig. 5. Figure 6 allows a quantitative estimate of the differences and indicates how the discrepancies are distributed along the curve.
Experimental values of the relative crystallinity (circles) and values predicted by Pseudo-Avrami model (lines) for the melt crystallization at 12 °C/min cooling rate (a) and cold crystallization at 24 °C/min heating rate (b) as functions of time since the onset of the corresponding crystallization event (PHB and PHB/CB compounds). (Compositions indicated).
Difference between predicted (Pseudo-Avrami) and experimental values of the relative crystallinity for melt (a) and cold crystallization (b) as functions of the relative crystallinity level, for the same systems plotted in Fig. 5.
The uncertainty of the parameters for the cases being considered varies between 0.2 and 0.8%. The mean standard deviation between the experimental and predicted values varies from 0.9% to 2.5% depending of the formulation. None of them tell the whole story. Figure 6 shows that deviations of the order of ±5% are to expected for relative crystallinities around 20 and 80%. This is a more realistic estimate of the errors incurred, more in line with the precision expected in DSC measurements. In that sense, the performance of Pseudo-Avrami model could be considered “reasonable”. The previous analysis assumes that experimental data at the exact cooling rate are available to estimate Pseudo-Avrami parameters. Although parameters for specific formulations can be fitted by polynomial expressions, the large dispersion of the parameters in terms of cooling/heating rate detracts from the predictive capabilities of the model.
B. Ozawa model
OzawaReference Ozawa23 proposed a semiempirical model to correlate nonisothermal crystallization data in polymer system conducted at constant heating/cooling rate. In its integral form, Ozawa model relates the relative crystallinity x measured at constant temperature T and the cooling/heating rate ϕ:
 $$x = 1 - \exp \left( { - \kappa {\phi ^{ - m}}} \right)\quad .$$
κ = κ(T) and m = m(T) are the Ozawa parameters—the last one known as Ozawa exponent. Since nonisothermal crystallization tests are conducted at constant heating/cooling rate, relative crystallinities must be interpolated to obtain x versus ϕ results at constant T. Parameters are obtained by linear regression of:
 $$y = \ln \left( {\ln \,{1 \over {1 - x}}} \right) = \ln \,\kappa - m\,\ln \,\phi \quad .$$
Relative crystallinity, duly interpolated, was correlated according to Eq. (10) to obtain Ozawa parameters. The size of each dataset in the plot is equal to or less than the number of heating/cooling rate tests (eight). The number of datasets per formulation is selected during the interpolation procedure. In the present case temperatures were interpolated in 2.5 °C intervals and between seven and fourteen sets were obtained. Tables 6–10 in the Supplementary Information show Ozawa parameters and their uncertainties for melt and cold crystallization events in neat PHB and PHB compounds, corresponding to all cases for which it was possible to correlate three or more data points. Units of the parameter κ are (°C/min)m; exponent m is dimensionless. Figures 7–9 show some of the results in graphical form.
Logarithm of Ozawa parameter κ (a) and Ozawa exponent m (b) as functions of temperature, for the melt and cold crystallization of neat PHB.
Logarithm of Ozawa parameter κ (a) and Ozawa exponent m (b) as functions of temperature, for the melt and cold crystallization of PHB/1% CB compound.
Logarithm of Ozawa parameter κ (a) and Ozawa exponent m (b) as functions of temperature, for the melt crystallization of PHB/10% CB compound.
Simple inspection of Tables 6–10 (in the Supplementary Information) and Figs. 7–9 suggests that Ozawa macrokinetic model is not an attractive option for correlating nonisothermal crystallization data for PHB and PHB/CB compounds.
Although in some cases it is possible to find narrow temperature intervals for which uncertainties are tolerable, the uncertainty of the parameters is, in too many cases, huge to the point that mean values obtained by regression of the data become unusable. For example, the value ln κ = 9.5 ± 2.8 for melt crystallization at T = 77.5 °C in PHB/1% CB means that Ozawa parameter κ has a mean value of 13,000 (in the appropriate units), but is expected to vary between 800 and 220,000. Obviously, this information is meaningless. Moreover, parameters are extremely sensitive to variations in temperature. Taking all data together, Ozawa parameter κ spans a range of 10 orders of magnitude (from 10−1 to 109) in a temperature interval of 50 °C (from 45 °C to 95 °C). This kind of variation seems unnatural. Ozawa exponent m also shows extreme variability: roughly from 0.5 to 8, a range that appears to be unphysical.
C. Mo model
Mo and othersReference Liu, Mo, Wang and Zhang24,Reference Liu, Mo and Zhang25 proposed a model to correlate nonisothermal crystallization data in polymer system conducted at constant heating/cooling rate, relating the time τ need to attain a given level of relative crystallinity x to the rate ϕ of cooling (melt crystallization) or heating (cold crystallization):
 $$\phi = F{\tau ^{ - \alpha }}\quad ,$$
where F = F(x) and α = α(x) are Mo parameters—the last is the Mo exponent. Results from the integration of DSC, data must be interpolated to obtain ϕ versus τ at constant x. Mo parameters are obtained by linear regression of:
 $$\ln \,\phi = \ln \,F - \alpha \,\ln \,\tau \quad .$$
Although the authors of the model derive Eq. (11), considering Pseudo-Avrami and Ozawa models simultaneously applied to the relative crystallinity data, this procedure may be taken as a motivation. Equation (11) should be taken as the starting point of a new empirical model to correlate nonisothermal crystallization data, independent of previous models of Ozawa e Pseudo-Avrami.
Relative crystallinity, duly interpolated, was correlated according to Eq. (12) to obtain Mo parameters. The size of each dataset in the plot is equal or less than the number of heating/cooling rates tests (eight). The number of datasets per formulation is selected during the interpolation procedure. In the present case nine sets were computed (from 10 to 90% relative crystallinity at 10% intervals). Figure 10 shows an example of Mo plots ln ϕ versus ln τ.
Mo plot (ln ϕ versus ln τ) for melt crystallization in a PHB/5% CB at four relative crystallinity levels (indicted): experimental points (circles) and best-fit straight lines (Mo model).
Tables 11–15 in the Supplementary Information show Mo parameters and their uncertainties for melt and cold crystallization events in neat PHB and PHB compounds, corresponding to all cases for which it was possible to correlate three or more data points. Units of the parameter F are °C/min1−α; exponent α is dimensionless.
Figure 11 shows graphically the dependence of Mo parameters F and α on the relative crystallinity x for the melt crystallization event in PHB and all PHB/CB compounds tested. Figure 12 shows the same information for the cold crystallization event in PHB and its compounds with 0.5 and 1% CB content; lack of sufficient data made it impossible to obtain a reliable correlation for the cold crystallization of system containing 5 and 10% CB.
Logarithm of Mo parameter F (a) and Mo exponent α (b) as functions of relative crystallinity, for the melt crystallization of PHB and PHB/CB compounds.
Logarithm of Mo parameter F (a) and Mo exponent α (b) as functions of relative crystallinity, for the cold crystallization of PHB and PHB compounds with 0.5 and 1% CB.
For neat PHB, Mo parameter F increases with the relative crystallinity, doubling its value (from 9 to 18, in the appropriate units) for melt crystallization and more quadrupling its value (from 5.7 to 23.5) for cold crystallization, when the crystalline fraction increases from 10% to 90%. On the other hand, Mo exponent α shows little variation with relative crystallinity, increasing by 13% (from 0.49 to 0.56) for melt crystallization and decreasing by 4% (from 1.76 to 1.67) for cold crystallization, when the crystalline fraction increases from 10% to 90%. However, Mo exponents are significantly higher (3.5 times higher) for cold crystallization compared with melt crystallization. Uncertainty of the parameters is well controlled, about 3% for parameter F and 4% for exponent α. The uncertainty of the parameters is not as good for the PHB/CB compounds, rising to almost 20% for parameter F during melt crystallization of the 1% CB compound and to more than 40% for the exponent α during cold crystallization of the 0.5% CB compound. However, smooth plots F versus x and α versus x are obtained in all cases; Mo parameters may be precisely fitted by quadratic or cubic polynomials in the relative crystallinity (Figs. 11 and 12).
Parameter F increases with relative crystallinity for all compounds during both melt and cold crystallization, showing steeper increases than for the matrix (about 4.5 times when the crystalline fraction varies from 10% to 90%) during melt crystallization. Parameter F is consistently higher for PHB/CB compounds than for neat PHB during melt crystallization; the difference increasing from about 35% at 10% relative crystallinity to 125% at 90% relative crystallinity. However, parameter F shows a remarkable independence of CB content during melt crystallization (less that 12% differences over the whole range), as shown in Fig. 11(a).
Exponent α shows a discrete increase with relative crystallinity (15–20% for a change relative crystallinity from 10% to 90%) for melt crystallization in PHB/CB compounds; exponent values are than twice for PHB/CB compounds than for neat PHB.
Both, parameter F and exponent α increase with relative crystallinity for PHB/CB compounds during cold crystallization. Relative increases and dependences are less clear than that for melt crystallization (Fig. 12).
An expression for the rate of crystallization may be obtained for a system that follows Eq. (11) with F = F(x) and constant exponent α:
 $$c = {{{\rm{d}}x} \over {{\rm{d}}\tau }} = \alpha {\phi ^{{1 \mathord{\left/ {\vphantom {1 \alpha }} \right. \kern-\nulldelimiterspace} \alpha }}}{\left( {{F^{{1 \mathord{\left/ {\vphantom {1 \alpha }} \right. \kern-\nulldelimiterspace} \alpha }}}\left| {{{{\rm{d}}\,\ln \,F} \over {{\rm{d}}x}}} \right|} \right)^{ - 1}}\quad .$$
The term in parenthesis in right hand side is a function of the relative crystallinity only and may be identified with the kinetics of the crystallization process; the rest is not a function of the relative crystallinity and may be considered the kinetic constant of the process:
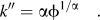 $$k'' = \alpha {\phi ^{{1 \mathord{\left/ {\vphantom {1 \alpha }} \right. \kern-\nulldelimiterspace} \alpha }}}\quad .$$
Since k″ is a function of the heating/cooling rate ϕ (and not of the temperature) it could be considered a “pseudo” kinetic constant. It is, nevertheless, a useful measure of the rate of crystallization and its dependence on the cooling/heating rate at a constant level of relative crystallinity. Taking advantage of the weak dependence of Mo exponent with relative crystallinity, Fig. 13 shows a plot of k″ versus cooling rate ϕ during melt crystallization of PHB in the neat resin and PHB/CB compounds, estimated with the average values of α over the 10–90% relative crystallinity interval.
Approximate kinetic constant as function of cooling rate for the melt crystallization of PHB and PHB/CB compounds.
The final step in modeling process is to check quantitatively the predictive capability of the model. Since relative crystallinity is not an independent variable in the model definition, Eq. (10), the criteria chosen to judge the performance of Mo model is based on the prediction of crystallization times for a given heating/cooling rate and crystallinity level:
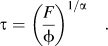 $$\tau = {\left( {{F \over \phi }} \right)^{{1 \mathord{\left/ {\vphantom {1 \alpha }} \right. \kern-\nulldelimiterspace} \alpha }}}\quad .$$
The relative discrepancy between experimental and predicted times:
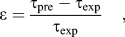 $$\varepsilon = {{{\tau _{{\rm{pre}}}} - {\tau _{{\rm{exp}}}}} \over {{\tau _{{\rm{exp}}}}}}\quad ,$$
is checking a selected variable.
Figure 14 shows the behavior of 100ε for different relative crystallinities for melt and cold crystallization on neat PHB at different heating/cooling rates. Discrepancies between predicted and experimental values are well controlled, except perhaps at the extremes. Discrepancies are higher for PHB/CB compounds, as shown in the example plotted in Fig. 15. Overall, the fitting capability of Mo model may be considered adequate if moderately high deviations, of the order of 10–20% could be tolerated.
Relative discrepancy between predicted (Mo) and experimental values of the time to reach the given values of the relative crystallinity for melt (a) and cold (b) crystallization of neat PHB at different cooling/heating rates (indicated).
Relative discrepancy between predicted (Mo) and experimental values of the time to reach the given values of the relative crystallinity for melt crystallization of PHB/10% CB compound at different cooling rates (indicated).
D. Comparison between models
Ozawa model does not fit the data well, as suggested by the large uncertainties and extreme, unphysical values of the fitting parameters obtained; a serious problem for a model in which the parameters claim a microkinetic interpretation.
Pseudo-Avrami and Mo models fit the experimental data better. The deviation of predicted results from experimental data is very reasonable for the Pseudo-Avrami model (5–10%), less so for Mo model (10–20%). However, the model parameters of Pseudo-Avrami are highly variable and specific for a given system (CB content) and conditions (heating/cooling rate), limiting its use to cases in which experimental data are available for the system/conditions in question, to reliably estimate the parameters. On the other hand, Mo model parameters are well behaved and may be correlated in terms of CB content and heating/cooling rate, allowing use of the model for arbitrary system/conditions (within the rage tested and avoiding extremes).
Ultimately, the success or failure of empirical correlation models depends on its intended use, and the acceptable level of discrepancy between predicted and experimental result that the specific application can tolerate.
V. CONCLUSIONS
Melt and cold nonisothermal crystallization results obtained by DSC were correlated by the three classical macrokinetic models (Pseudo-Avrami, Ozawa, Mo) for a “difficult” system (the structured filler CB dispersed in the highly crystalline and thermally unstable PHB matrix), and the performance of the models assessed quantitatively.
It is shown that uncertainties of the model parameters determined by linear regression of highly modified (distorted) versions of the integral expressions of the models are not good predictors of the ability of the models to reproduce experimental data much less so the visual assessment of the “goodness of fit” in those plots. Quantitative procedures were implemented to evaluate the performance of the models for different levels of relative crystallinity developed.
For the system tested, Pseudo-Avrami and Mo models seem to best reproduce the data. Decision on which one to use depends on the circumstances. If moderately high discrepancies between predicted and experimental results are acceptable, the model attributed to Mo et al. is recommended to correlate experimental nonisothermal crystallinity data for PHB and PHB/CB compounds within the range of heating/cooling rates tested.
Supplementary Material
To view supplementary material for this article, please visit http://dx.doi.org/10.1557/jmr.2016.68
ACKNOWLEDGMENTS
Authors would like to thank Ms. Maria do Bom Conselho Vitorino and Mr. Alceu Black for preparing the compounds, and to PHB Industrial SA (Brazil) for kindly supplying the PHB. RMRW thanks to CNPq/Brazil (MCTI/CNPq N 14/2012—Process Number: 478124/2012-0) and ELC thanks to FACEPE/PE/Brazil for the financial support.



