Introduction
Global warming is gaining significance as a threat to ecosystems since temperature is one of the major abiotic constraints to productivity (Porter et al., Reference Porter, Xie, Challinor, Cochrane, Howden, Iqbal, Lobell, Travasso, Field, Barros, Dokken, Mach, Mastrandrea, Bilir, Chatterjee, Ebi, Estrada, Genova, Girma, Kissel, Levy, MacCracken, Mastrandrea and White2013). Under changing environmental features and increasing world population, crop production has particular importance in order to match the increasing demand for food (Anwar et al., Reference Anwar, Liu, Macadam and Kelly2013). It is documented that climate change has affected the development and productivity of cereals and constitutes a growing concern for food security.
Considering that better understanding of the effects of climate change on phenological development of field crops may help to optimize their management schemes and increase productivity (Wang et al., Reference Wang, Gan, Wang, Niu, Zhao, Yang and Li2008), phenological aspects of agricultural and horticultural crops have been studied extensively in recent decades (Chmielewski et al., Reference Chmielewski, Müller and Bruns2004; Tao et al., Reference Tao, Yokozawa, Xu, Hayashi and Zhang2006, Reference Tao, Zhang and Zhang2012; He et al., Reference He, Asseng, Zhao, Wu, Yang, Zhuang, Jin and Yu2015). Final yield of crops is dependent to a large extent on their developmental rate from emergence to maturity, which determines the timing and duration of phenological phases (Miglietta et al., Reference Miglietta, Tanasescu and Marica1995; Porter and Gawith, Reference Porter and Gawith1999; Wheeler et al., Reference Wheeler, Craufurd, Ellis, Porter and Prasad2000; Porter and Semenov, Reference Porter and Semenov2005; Tao et al., Reference Tao, Yokozawa, Xu, Hayashi and Zhang2006; Olesen et al., Reference Olesen, Børgesen, Elsgaard, Palosuo, Rötter, Skjelvåg, Peltonen-Sainio, Börjesson, Trnka, Ewert, Siebert, Brisson, Eitzinger, van Asselt, Oberforster and van der Fels-Klerx2012; van Bussel et al., Reference van Bussel, Stehfest, Siebert, Müller and Ewert2015). The timing of seasonal activities of plants is a sensitive indicator of climate change impacts because it is influenced largely by meteorological conditions. A large part of previous studies has focused on the effects of climate change on the phenology of natural vegetation but relatively few studies have analysed changes in the phenological development of crops, despite their economic importance. Regardless of improvements in technology and crop breeding, crop production remains highly dependent on climate because climatic variables such as temperature are the main drivers of crop growth. In response to increases in air temperature, phenological events have occurred earlier than in the past (Wang et al., Reference Wang, Gan, Wang, Niu, Zhao, Yang and Li2008; Siebert and Ewert, Reference Siebert and Ewert2012; Xiao et al., Reference Xiao, Tao, Liu, Shi, Wang, Liu, Zhang and Zhu2013) and the growth period of some crops from emergence to maturity have shortened (Tao et al., Reference Tao, Zhang and Zhang2012; He et al., Reference He, Asseng, Zhao, Wu, Yang, Zhuang, Jin and Yu2015). These shortened growth periods have resulted in lower biomass accumulation and decreased yield. On the other hand, some studies have shown that duration of the reproductive phase, critical for yield formation, has lengthened slightly (Xiao et al., Reference Xiao, Tao, Liu, Shi, Wang, Liu, Zhang and Zhu2013; Li et al., Reference Li, Yang, Tian, Pan, Liu and Lu2016). Since changes in the duration of crop development stages affect production, shortening of the growing period under future climatic warming will potentially lead to reduced yield (Harrison and Butterfield, Reference Harrison and Butterfield1996; Rötter et al., Reference Rötter, Palosuo, Pirttioja, Dubrovsky, Salo, Fronzek, Aikasalo, Trnka, Ristolainen and Carter2011; Lobell and Gourdji, Reference Lobell and Gourdji2012; Anwar et al., Reference Anwar, Liu, Farquharson, Macadam, Abadi, Finlayson, Wang and Ramilan2015; Oteros et al., Reference Oteros, García-Mozo, Botey, Mestre and Galán2015), with the largest changes in Northern Europe (Olesen et al., Reference Olesen, Børgesen, Elsgaard, Palosuo, Rötter, Skjelvåg, Peltonen-Sainio, Börjesson, Trnka, Ewert, Siebert, Brisson, Eitzinger, van Asselt, Oberforster and van der Fels-Klerx2012).
Barley is certainly one of the most important cereals in Lithuania as well as in many other countries. Currently, according to the FAO, global annual production of barley grain has reached 148 million tons and is ranked fourth following maize, rice and wheat. More than 0.60 of barley grain is used as animal feed and the other 0.40 for direct human needs and as a component of health foods. Furthermore, barley is considered a perfect model for studies of response to climate change (Trnka et al., Reference Trnka, Dubrovsky and Zalud2004; Dawson et al., Reference Dawson, Russell, Powell, Steffenson, Thomas and Waugh2015). It is generally assumed to be better adapted to northern areas because of its lower heat requirements to reach maturity (Dofine, Reference Dofine1992) and faster rate of development towards maturity in comparison with wheat (Williams, Reference Williams1974). Despite barley production being currently at its greatest values in some countries (e.g. France, Germany and Russia), in recent decades yields have ceased to increase partly due to the impacts of climate change (Lobell and Field, Reference Lobell and Field2007; Dawson et al., Reference Dawson, Russell, Powell, Steffenson, Thomas and Waugh2015). It should be noted that phenological shifts of barley development during the growing period have attracted less attention. Agro-phenological observations are concentrated mainly on autumn-sown crops, particularly winter wheat (Porter and Gawith, Reference Porter and Gawith1999; Sommer et al., Reference Sommer, Glazirina, Yuldashev, Otarov, Ibraeva, Martynova, Bekenov, Kholov, Ibragimov, Kobilov, Karaev, Sultonov, Khasanova, Esanbekov, Mavlyanov, Isaev, Abdurahimov, Ikramov, Shezdyukova and de Pauw2013; He et al., Reference He, Asseng, Zhao, Wu, Yang, Zhuang, Jin and Yu2015), with much less attention paid to spring crops including spring barley (Alzueta et al., Reference Alzueta, Arisnabarreta, Abeledo and Miralles2014; Středová et al., Reference Středová, Stehnová and Škvareninová2017).
For phenological projection, long-term time-series of phenological observations are required for the calibration of a model. The most important parameter generally used is growing degree days (GDD) (McMaster and Wilhelm, Reference McMaster and Wilhelm1997), which can be evaluated from observational data and can then be applied for evaluation of the time when a particular phenological phase manifests during the growing period. Technological and cultivar changes during the investigation period are sources of uncertainty (Tao et al., Reference Tao, Yokozawa, Xu, Hayashi and Zhang2006; Estrella et al., Reference Estrella, Sparks and Menzel2007; Liu et al., Reference Liu, Wang, Yang and Wang2010). A possible way to overcome this limitation is to use data from a region where field observations were taken with minimal changes in agricultural technology and local cultivars. Such field data could facilitate highlighting of crop responses to environmental conditions. However, according to some investigators, phenological changes are caused mainly by climate warming, with management practices and changes of crop varieties influencing field crop phenology to a relatively small extent only (Estrella et al., Reference Estrella, Sparks and Menzel2007; Xiao and Tao, Reference Xiao and Tao2014; Zhang et al., Reference Zhang, Tao, Xiao, Shi, Liu, Zhang, Liu, Wang and Bai2016).
An understanding of crop phenology responses to increasing temperature is very important for crop management adaptation and breeding purposes to mitigate the negative effects of climate change. Aside from that, the data of long-term phenological observations can highlight year to year changes in seasonal events, especially useful for the projection of plant responses to climate warming (Liu et al., Reference Liu, Wang, Yang and Wang2010; Anwar et al., Reference Anwar, Liu, Farquharson, Macadam, Abadi, Finlayson, Wang and Ramilan2015; Kalvāns et al., Reference Kalvāns, Bitāne and Kalvāne2015). The objective of the current study was to investigate long-term (1961–2015) temporal and spatial trends in spring barley phenology and to project climate-warming-related changes in timing and duration of different phenological phases.
Materials and methods
Study sites and phenological data
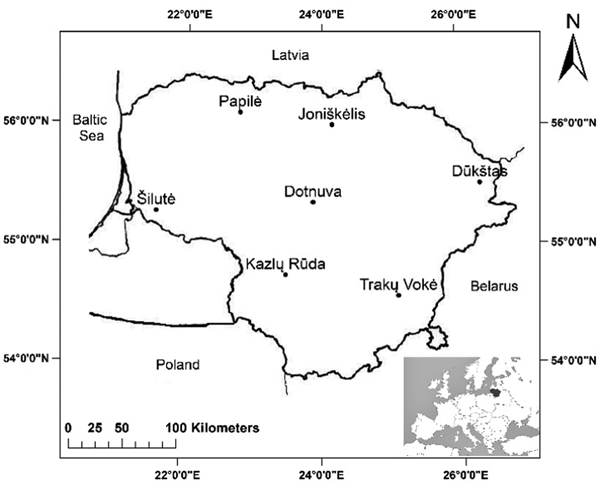
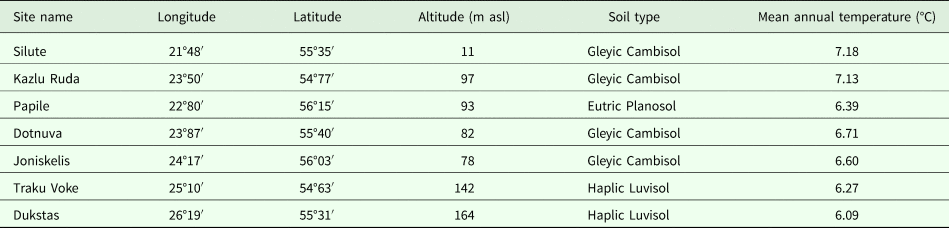
The study was carried out at seven sampling sites located throughout Lithuania (Fig. 1) and extended from 54°63′ N to 56°15′ N and from 21°48′ E to 26°19′ E (Table 1). Lithuania is situated on the coast of the Baltic Sea in the transition zone between a maritime and continental climate. The topography is characterized as glacially flat with morainic hills in the western uplands and eastern highlands. The coastal area is an exception, being allied to the Western European region. The mean annual air temperature ranges from 6.4 °C with total annual precipitation of 650 mm to 7.4 °C with 800 mm, increasing from east to west. The growing season lasts 169 days in the eastern part of the country and 202 days in the western part.
The locations of Lithuanian agrometeorological stations used in the study.

Locations and characteristic of the study sites

The temporal and spatial phenological trends of spring barley (Hordeum vulgare L.) over the period 1961–2015 were analysed using data of the phenological observation network (Voke Branch, Lithuanian Research Centre for Agriculture and Forestry). Over the period investigated two cultivars, Auksiniai II and Auksiniai III were most commonly grown in the study area. The phenological development of barley was recorded at the sample plot of each site by selecting ten plants (four replicates/site). The beginning of the phase was fixed when 10% of the observed plants reached a phase. Phenological observations included such developmental stages as sowing date (growth stage [GS] 00, according to BBCH; Meier, Reference Meier2001), emergence – leaf not completely unfolded (GS 10) and heading – half of the year emerged (GS 55), harvest (GS 100). The germination period was calculated from sowing to emergence, growth period from sowing to harvest, vegetative growth period from sowing to heading and reproductive growth period from heading to harvest.
Linear trends of the onset dates against year were calculated for evaluation of temporal trends. A slope of the trend (coefficient b) indicated an annual shift of investigated phenophase (days/year) and their significance was determined using the F test. A negative coefficient indicates an advancement in days/decade, while positive indicates a delay. The mean daily temperature was calculated during the development stage for each study site over the study period. All statistical analyses were performed with STATISTICA 7 Software.
Climate data
Mean, minimal and maximal daily temperatures were used for phenological analysis, thermal time calculation and phenological model development. These temperature data were obtained from the Meteorological Stations of Lithuanian Hydrometeorological Service situated at or close to the sites of agro-phenological observations (<20 km). In the present work, thermal time (5 °C base temperature) was evaluated using hourly temperatures, which were calculated based on the daily minimum and maximum temperatures. A description of the method used for hourly temperature generation can be found elsewhere (Matzneller et al., Reference Matzneller, Blümel and Chmielewski2014; Juknys et al., Reference Juknys, Kanapickas, Šveikauskaitė and Sujetovienė2016). The method is based on the assumption that the daytime temperature cycle follows a sine curve from sunrise to sunset, and night-time cooling follows a logarithmic decline (Linvill, Reference Linvill1990).
For future climate scenarios, climate projections from five global circulation models (GCMs), were selected from the Coupled Model Inter-comparison Project Phase 5 (CMIP5). The GCMs were the Max Planck Institute for Meteorology Earth System (MPI-ESM-LR), Institute Pierre Simon Laplace, Earth System (IPSL-CM5A-LR), National Centre for Meteorological Research (CNRM CM5), the Hadley Centre Global Environmental Model-Earth System (HadGEM2-AO, HadGEM2-ES). The weather data projections are based on emission scenarios of Representative Concentration Pathways (RCPs), which can be identified by their approximate total radiative forcing in 2100: 2.6, 4.5, 6.0 and 8.5 W/m2, which correspond to scenario notations RCP2.6, RCP4.5, RCP6.0 and RCP8.5, respectively (Hibbard et al., Reference Hibbard, Van Vurren and Edmonds2011). In the current study, temperature data for the two highest-contrasting future climate change scenarios were used: the RCP2.6 scenario is the mildest (optimistic) and the RCP8.5 scenario the most severe (pessimistic), leading to approximately 490 and 1370 ppm in CO2-equivalents by 2100, respectively.
Daily temperature data for the period 2006–2100 were obtained from the Earth System Grid Federation (ESGF) Peer-to-Peer System (https://esgf-node.llnl.gov/projects/esgf-llnl). Temperature data were extracted from the data files, taking the temperature values for the grid points covering all the territory where agro-meteorological sites are distributed. The projected temperatures for each site were derived from the values of temperature at the four nearest GCM grid points using inverse distance interpolation (Xia et al., Reference Xia, Winterhalter and Fabian1999). Projected temperatures were bias-corrected based on the long-term monthly mean observed values (1981–2010) using a linear scaling method (Teutschbein and Seibert, Reference Teutschbein and Seibert2012).
For the analysis of temperature changes, mean monthly temperatures were calculated according to all five GCMs for the RCP2.6 and RCP8.5 scenarios for near (2011–2040), middle (2041–2070) and far (2071–2100) future. Finally, the temperatures of all five GSMs were averaged and compared with respect to the reference period of 1981–2010. Projection of phenological parameters was carried out separately for each GCM model (i.e. daily temperatures were not averaged to avoid the loss of information about daily temperature variability due to averaging). Instead, mean values were calculated for obtained phenological parameters, specifically, the day of occurrence for each phenological phase.
Projection of phenological data
Most phenological models are based on the concept of thermal time (Chuine, Reference Chuine2000; Vitasse et al., Reference Vitasse, François, Delpierre, Dufrêne, Kremer, Chuine and Delzon2011; He et al., Reference He, Asseng, Zhao, Wu, Yang, Zhuang, Jin and Yu2015). It is generally assumed that a specific phenological phase occurs when a certain sum of active temperature above a species-specific threshold (T b) is reached. For phenological analysis in the present work, the amount of accumulated temperature required for the occurrence of the following phenological phases of spring barley was evaluated: sowing, emergence, heading and harvest. The calculation of accumulated temperatures is described in detail in a previous work by Juknys et al. (Reference Juknys, Velička, Kanapickas, Kriaučiūnienė, Masilionytė, Vagusevičienė, Pupalienė, Klepeckas and Sujetovienė2017). In short, the procedure can be summarized as follows.
To account for diurnal temperature variations, hourly temperatures were used for the summation of active temperatures. Mean hourly temperatures were calculated using the method described briefly above. The sum of active temperatures (T*) was as follows:
 $$T{^\ast} = \sum\limits_{t_{\rm 0}}^{t_{{\rm st}}} {\sum\limits_{\,j = 1}^{24} {R(T_j)}} $$
where R(T j) is the rate of active temperature accumulation; T j is the mean hourly temperature; t 0 is the day of the year when the accumulation of temperatures begins; t st is the day when the required amount of active temperatures is reached; and j represents the number of an hour. Although sowing dates are known for the investigation period, obviously they are not known for future dates. To compare accumulated thermal time for the observed period and for future projections, a starting date of 1 February is used throughout for the beginning of temperature accumulation (t 0).
The rate of active temperature accumulation was calculated as follows:
 $$R(T_j) = \left\{ {\matrix{ 0 \cr {T_j-T_{\rm b}} \cr}} \right.\matrix{ {{\rm if} T_j \le T_{\rm b}} \cr {{\rm if} T_j \gt T_{\rm b}} \cr} $$
where T b is a species-specific threshold of minimal physiologically active temperature. Various values of the threshold temperature are suggested as essential for early spring phases of plants (Moreno et al., Reference Moreno, Pedreira, Boote and Alves2014; Kalvāns et al., Reference Kalvāns, Bitāne and Kalvāne2015). According to various studies (Cannell and Smith, Reference Cannell and Smith1983; Juknys et al., Reference Juknys, Velička, Kanapickas, Kriaučiūnienė, Masilionytė, Vagusevičienė, Pupalienė, Klepeckas and Sujetovienė2017; Středová et al., Reference Středová, Stehnová and Škvareninová2017), it is approximately 5 °C for most plants, including barley.
The active temperature (T*) necessary for the occurrence of different phenological phases was evaluated using Eqn (1): first, T* was calculated for all years and then averaged over the observation period. Using the values obtained, the dates of appearance of each phase were estimated (t e) and the root mean square error (RMSE) between observed (to) and estimated (t e) days of the year was calculated:
 $${\rm RMSE} = \sqrt {\displaystyle{{\sum\limits_{i = 1}^N {{(t_{\rm e}-t_{\rm o})}^2}} \over N}} $$
where N represents the total number of observation years and i represents the number of a year for which the observed (t o) and the estimated (t e) days for a particular phenological phase are taken.
For the projection of spring barley phenology, the sum of active temperatures (T*) required for a particular barley phenological phase to appear, derived from observed data, was used as the main parameter and daily temperatures were input parameters. First, hourly temperatures were evaluated in the same manner as for observation years and then the accumulated temperatures were calculated using Eqns (1) and (2). The day of appearance of a particular phenological phase was determined at a point where the sum of active temperature increased to T*, i.e. the value obtained from observation data. In the same manner, the days for sowing, emergence, heading and harvest were projected using temperature data of all five GCMs for each scenario's temperature dataset. Then the means of projected phenological dates were calculated for the near (2011–2040), mid-range (2041–2070) and distant (2071–2100) future. Finally, obtained values were averaged over all five GSMs for both scenarios and used further for the comparison of the changes in spring barley phenology with respect to the observation data.
Results
Historical temperature trends (1961–2015)
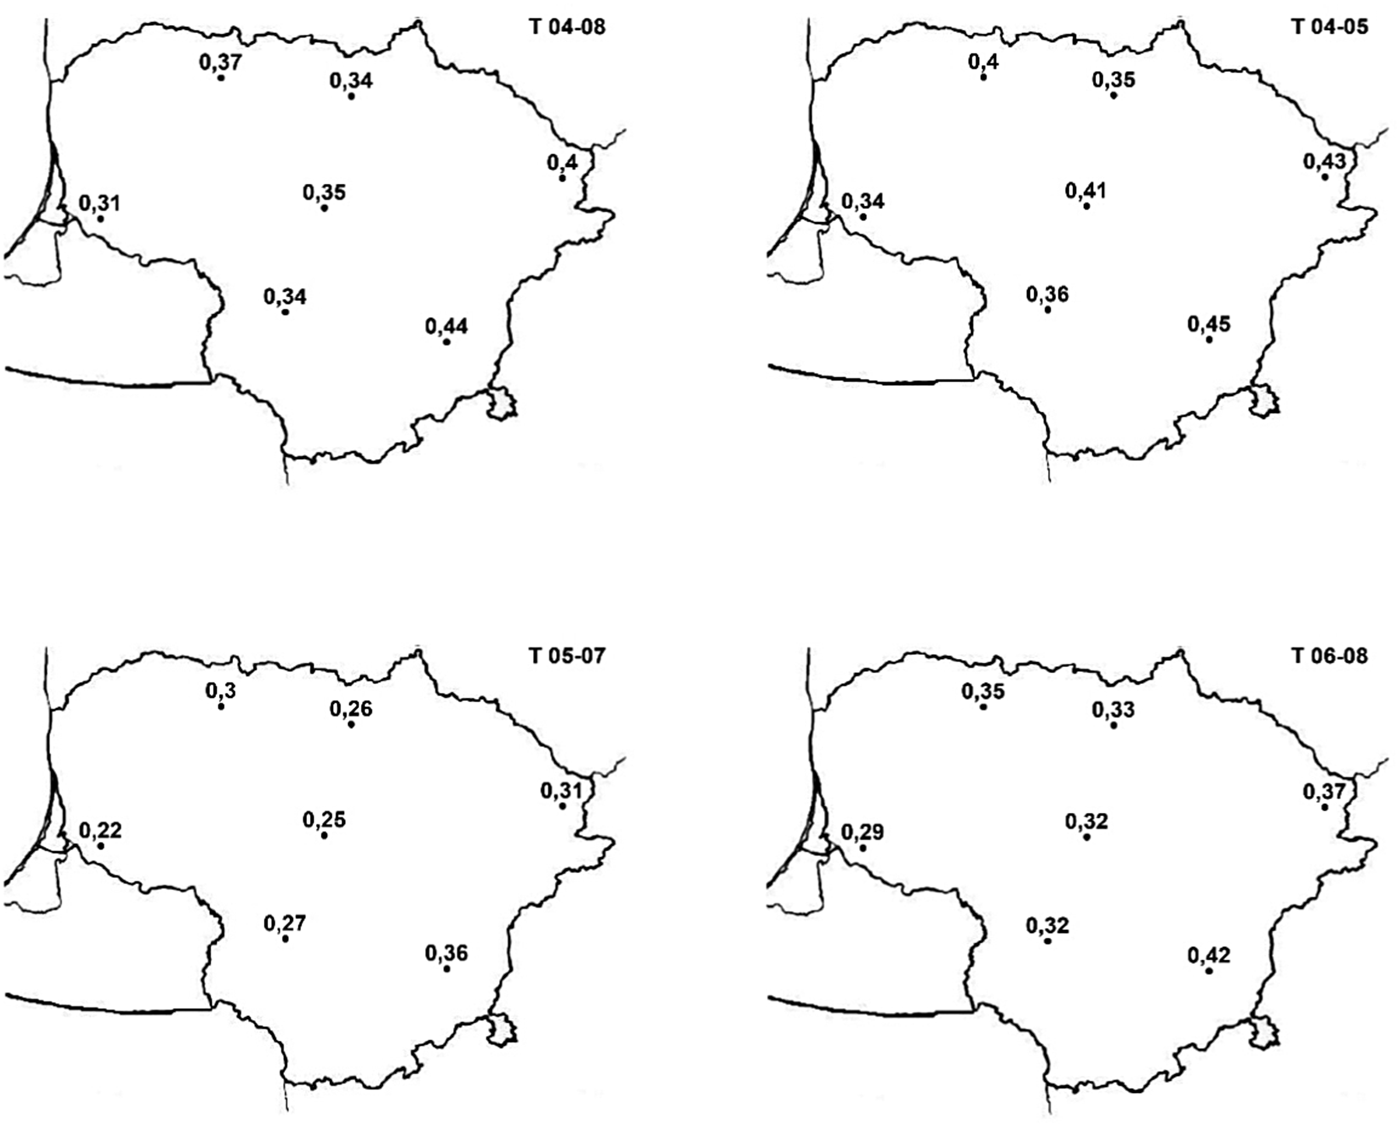
Mean temperature throughout the period when the phenological phases under investigation occurred (April–August) increased significantly during the study period in Lithuania (P < 0.05, Fig. 2). The highest rate of temperature change was specific for months in spring (April–May) when the mean temperature increased by 2.16 °C (0.39 °C/decade). The lowest warming trend was characteristic for the coastal part of the study area, 0.31–0.34 °C/decade (Fig. 2). The eastern area of the country experienced the highest increase in spring temperature (>0.40 °C/decade). This spatial tendency of temperature change was also typical for vegetative (April–May) and reproductive growth (June–August) periods (Fig. 2).
Changes in temperature (°C/decade) during the months of the occurrence of a phenological phase from 1961 to 2015: mean temperature in April–May (T04-05) during the germination period, T04-08 - growth period, T05-07 - vegetative growth period and T06-08 - reproductive growth period. All changes were statistically significant (P < 0.05).

Temporal and spatial trends in phenology of spring barley
The advancement trends were specific for the most-analysed phenological phases of spring barley; the sowing and emergence dates advanced by an average of 1.7 and 2.8 days/decade, respectively (P < 0.05, Table 2). Emergence occurred >2 weeks (15.4 days) earlier at the end of the study period in comparison with the beginning, while sowing dates advanced by almost 10 days. Heading of spring barley advanced by >6 days on average over the observation period, but statistically, significant change was characteristic only for one station (Traku Voke) (R 2 = 0.40, P < 0.05). Contrary to the advancement of all mentioned phases, the harvest dates were delayed by 2.4 days on average per investigated period, though this change was not statistically significant (Table 2).
Changes of mean phenological dates (day of the year) of spring barley during the 1961–2015 period

Correlation coefficient (r), regression slope (days/decade), statistically significant changes between the onset of the phase and year are marked ** (P < 0.01)
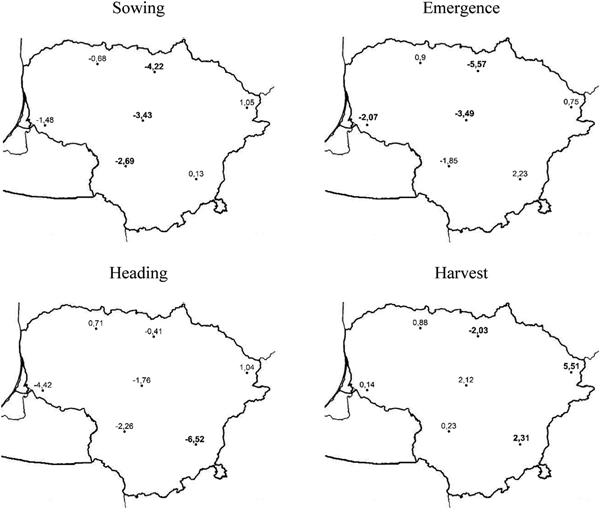
The largest statistically significant (P < 0.05) advancement in sowing and emergence dates were characteristic for the central part of Lithuania (Fig. 3). The timing of both these phases was delayed in the eastern part of the country, 0.13–1.05 days/decade for sowing and 0.75–2.23 days/decade for emergence. The most significant changes in the timing of heading occurred in the southern part of Lithuania, where advancement of this phase ranged from 1.76 to 6.52 days/decade. The timing of harvest was delayed in almost all stations (except Joniskelis) and changes were larger in the eastern part of the country (2.31–5.51 days/decade) than in the western part (0.14–0.88 days/decade) (Fig. 3).
Changes (days/decade) in the timing of phenological phases of spring barley (Hordeum vulgare L.) in Lithuania from 1961 to 2015. Statistically, significant changes are marked in bold (P < 0.05).

The period from sowing until emergence was prolonged by 5.8 days (1.05 days/decade) over the investigated period (Table 2). The vegetative growing period (from sowing to heading) shortened slightly, while the reproductive period (from heading to harvest) was extended by 8.7 days (1.6 days/decade). The significant advancement of sowing and insignificant change in timing of harvest resulted in the extension of the total growing period of spring barley by >12 days (2.2 days/decade) during the study period.
Projected changes in spring barley phenology
Thermal requirements were detected to be in the range of 96.4 GDD for the sowing phase to 1453 GDD for harvest. The lowest values of RMSE were characteristic of the emergence phase (5.9 days), and higher for heading and harvest phases (7.8 and 8.6 days, respectively). However, differences between these RMSE did not exceed 3 days.
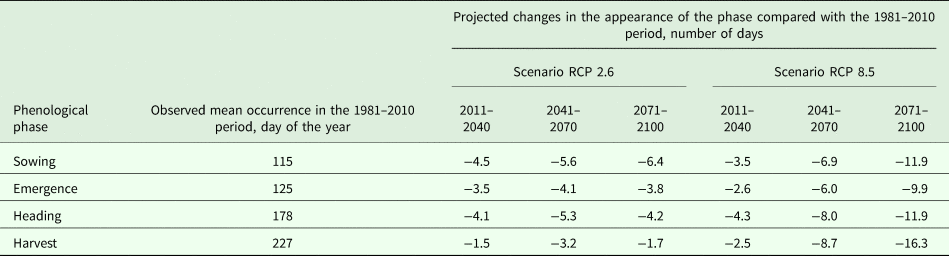
Predictions of changes in the occurrence of investigated phenological phases according to different scenarios are presented in Table 3. The advancement of all phases was foreseen for all projections (i.e. both scenarios and three projected periods). For the near future (2011–2040), rather a similar advancement of investigated phenological phases has been projected according to both climate change scenarios, optimistic (RCP 2.6) and pessimistic (RCP 8.5). In the case of the optimistic scenario, the increase in advancement of phenological development for the middle and far future projections is rather limited compared with the near future projection, and for the phenological phases of emergence, heading and especially harvest even a decrease in advancement has been foreseen for the far future projection compared with the middle future projection. This can be explained by the fact that, according to the RCP 2.6 scenario, global temperatures as well as greenhouse gas emissions increase slightly until the middle of the current century and then stabilize at +2°C for the remainder of the century. The projection data for Lithuania even shows a slight decrease in temperature from the middle to the end of the century. As a consequence, a decrease in advancement has been foreseen for the RCP 2.6 scenario for the far future.
Projected changes in the occurrence of spring barley phenological phases

According to the pessimistic (RCP 8.5) climate change scenario, a rapid increase in the advancement of spring barley phenology is foreseen for the middle and especially for the far future projection, particularly for the harvest phase (Table 3). Advancement of almost 9 days is foreseen for the middle future (2041–2070) and >16 days for the far future (2071–2100) projections. The advancement of other phenological phases is less pronounced; the emergence phase is projected to advance by almost 10 (9.9) days, and the sowing and heading phases by almost 12 (11.9) days for the far future (Table 3).
For middle and far projections according to RCP 8.5, projected advancement in the timing of different phenological phases exceeded RMSE; these projections are statistically significant (Table 3). However, projected advancement of all phenological phases for the RCP 2.6 scenario and near projection for the 8.5 scenario was too small to be considered statistically significant.
Discussion
Analysis of long-term (1961–2015) changes in the phenological development of spring barley has shown an advancement of all investigated phenological phases with the exception of harvest. The dates of sowing and harvest are often termed false phenological phases since annual plants are sown and harvested at a time decided by farmers (Estrella et al., Reference Estrella, Sparks and Menzel2007). However, these decisions are only partially subjective and depend mainly on climate conditions and the state of plants. The remarkably higher temperature in April and May today compared with 55 years ago has led to earlier farmer activity in spring, such as tilling. Consequently, sowing dates have advanced by almost 10 days.
The advancement of the next phenological phase (emergence) is detected to be more pronounced than sowing and to consist of >2 weeks over the investigated 55 years period. Consequently, the period necessary for seed germination has been shortened by almost 6 days. Leaf onset was the phase most affected for the majority of crops grown in Europe (Chmielewski and Rötzer, Reference Chmielewski and Rötzer2001; Ma et al., Reference Ma, Churkina and Trusilova2012; Středová et al., Reference Středová, Stehnová and Škvareninová2017). Data from long-term phenological records of crops and natural vegetation has shown that the occurrence of each spring phenological phase is most dependent on the temperature of the previous months (Wielgolaski, Reference Wielgolaski2003; Estrella et al., Reference Estrella, Sparks and Menzel2007; Romanovskaja and Bakšienė, Reference Romanovskaja and Bakšienė2007, Reference Romanovskaja and Bakšienė2009; Oteros et al., Reference Oteros, García-Mozo, Botey, Mestre and Galán2015; Juknys et al., Reference Juknys, Velička, Kanapickas, Kriaučiūnienė, Masilionytė, Vagusevičienė, Pupalienė, Klepeckas and Sujetovienė2017). Soil warming experiments also confirmed that warming hastened the initial stages of the crop development most (Patil et al., Reference Patil, Laegdsmand, Olesen and Porter2010; Luo, Reference Luo2011). This is in accordance with the results of the current study, which showed that the timing of sowing and emergence were strongly and negatively correlated with changes in temperature of April.
Harvest of spring barley was the only phenological phase detected to be slightly delayed (2.4 days) over the 55-year period studied. Investigations of long-term changes in spring barley phenology performed in South Moravia (Středová et al., Reference Středová, Stehnová and Škvareninová2017) also revealed a delay in the harvest date.
The total growth period of spring barley (from sowing to harvest) was extended by 12 days over the entire period investigated in the current study. This is in an agreement with other studies which have showed that in temperate latitudes, global warming extended the length of growing season due to earlier planting of crops (Olesen and Bindi, Reference Olesen and Bindi2002; Středová et al., Reference Středová, Stehnová and Škvareninová2017) including winter crops (Williams and Abberton, Reference Williams and Abberton2004; García-Mozo et al., Reference García-Mozo, Mestre and Galán2010; Blecharczyk et al., Reference Blecharczyk, Sawinska, Małecka, Sparks and Tryjanowski2016). Because the duration of the period between emergence and harvest is related positively to the length of photosynthetic activity of plants, the extended growing season as a result of increased temperatures during spring and summer may impact crop productivity positively (Wang et al., Reference Wang, Gan, Wang, Niu, Zhao, Yang and Li2008). The opposite results were found in Finland, where increasing temperature reduced growth duration of spring barley, even with adjusted earlier sowing (Rötter et al., Reference Rötter, Palosuo, Pirttioja, Dubrovsky, Salo, Fronzek, Aikasalo, Trnka, Ristolainen and Carter2011). While temperatures above the optimal range have been reported to have negative effects on many crops (Hatfield and Prueger, Reference Hatfield and Prueger2015), the current study results showed that temperatures at the study sites were not above the upper temperature suitable for barley.
Changes in temperature in the future may have different consequences. Simulations of the temperature and timing of phenological stages in the current study have shown that the magnitude and even the direction of change differ significantly from historical changes. The advancement of all phenological phases is projected according to both optimistic and pessimistic climate change scenarios, while harvest delay was detected for the observational period. For the optimistic (RCP 2.6) scenario, the largest advancement for spring phases was found to be similar to the analysed historical period (1961–2015). For the pessimistic (RCP 8.5) scenario, the largest advancements of the harvest phase were projected for the middle and far future. This result can be explained by an earlier investigation period (Juknys et al., Reference Juknys, Velička, Kanapickas, Kriaučiūnienė, Masilionytė, Vagusevičienė, Pupalienė, Klepeckas and Sujetovienė2017) where a significant warming (by >5 °C) was found for July and August at the end of the current century according to the RCP 8.5 scenario, which could be considered the main reason for the essential harvest advancement. It is expected that the positive effects of climate warming on cereal growth will reverse as temperatures exceed the optimum level. It was suggested that an increase in biomass and yield production due to higher temperatures had occurred below a species-specific temperature optimum (Högy et al., Reference Högy, Poll, Marhan, Kandeler and Fangmeier2013). In temperate cereals, optimal mean temperature ranges between 14 and 18°C (Chowdhury and Wardlaw, Reference Chowdhury and Wardlaw1978) and for spring barley, temperatures of about 20–25°C are optimal for growth and development (Hakim et al., Reference Hakim, Hossain, Teixeira Da Silva, Zvolinsky and Khan2012; Hossain et al., Reference Hossain, Teixeira da Silva, Lozovskaya and Zvolinsky2012). Other experiments also showed that the leaf growth rate of barley increased with increasing temperature until an optimum of 20°C was reached and then declined with further increases in temperature (Cao and Moss, Reference Cao and Moss1989; Tamaki et al., Reference Tamaki, Kondo, Itani and Goto2002). It could be argued that the observed delay in harvest date during recent decades was related to higher temperatures but below the optimum. Higher projected temperatures in future could lead to faster development rates, shorter grain filling periods and negative impacts on the quantity and quality of crops harvested (Barnabas et al., Reference Barnabas, Jäger and Feher2008; Hatfield et al., Reference Hatfield, Boote, Kimball, Ziska, Izaurralde, Ort, Thomson and Wolfe2011; Peltonen-Sainio et al., Reference Peltonen-Sainio, Jauhiainen and Hakala2011). Recent studies based on simulation models have shown that cereals will flower and mature earlier in a future warmer world (Harrison and Butterfield, Reference Harrison and Butterfield1996; Rötter et al., Reference Rötter, Palosuo, Kersebaum, Angulo, Bindi, Ewert, Ferrise, Hlavinka, Moriondo, Nendel, Olesen, Patil, Ruget, Takáč and Trnka2012). Projected climate change in high latitudes also will lead to reduced total growth duration of spring barley along with the high risk of significant yield loss (Rötter et al., Reference Rötter, Palosuo, Pirttioja, Dubrovsky, Salo, Fronzek, Aikasalo, Trnka, Ristolainen and Carter2011). These results highlight the importance of research and policy in order to adapt to climate change.
Considering that Lithuania is situated on the Baltic Sea, a presumption was made that the influence of the sea would be obvious for both temperature and phenological changes. A rather obvious gradient in the rate of temperature changes over the last 55 years can be seen with increasing distance from the sea, and approximately 1.3–1.5 times larger increase in temperature has been observed in stations furthest from the sea compared with those closest. However, a spatial trend of changes in the timing of investigated phenological phases is not so evident and regular. The largest and statistically significant advancement in sowing and emergence dates of spring barley were characteristic for the central part of Lithuania, and the timing of both these phases was delayed in the eastern part of the country. Changes in the timing of spring barley harvest along the coastal-continental gradient have been found to be more regular, and the harvest delay is obvious with the increase in distance from the sea.
Quantifying the impact of future climate change on the potential development of the main crops and their productivity for specific locations provides useful insights for policy strategy, rearrangement of agricultural management and future pathways for further research. This is important to achieve proper crop productivity and avoid vulnerability in the future, as global demand for agricultural crop production is expected to increase. Since the length of the growth period is related to crop productivity, the current results suggest that in future new cultivars adapted to a higher temperature will be needed in Lithuania in order to cope with projected climate warming.
Conclusions
The current study shows the projected spatial and temporal trends of spring barley phenology in comparison with the historical period 1961–2015 in Lithuania. Since Lithuania is situated on the cost of Baltic Sea in the transition zone between maritime and continental climate, the rate of temperature increase over the last 55 years was characteristic along with increasing distance from the sea. The spatial trend of the changes in the timing of investigated phenological phases is not so evident and regular. A significant advancement of spring phenology (sowing and emergence) and insignificant delay of harvest dates resulted in the extension of the total vegetation period of spring barley by >12 days over the investigated period (1961–2015). Changes in the occurrence of phenological phases of spring barley are projected to be more pronounced and advancement of all phenological phases including harvest is projected in the future. The historical and projected response of crop phenology to climate change provides important insights into understanding the impact of climate on crop development and productivity. Since the projected increase in temperatures in future will be higher than optimal temperature for barley growth, the findings of the current study highlight the fact that shortened duration of the vegetative growth period under future climate change could have negative consequences on barley productivity.
Acknowledgements
We acknowledge the World Climate Research Programme's Working Group on Coupled Modelling responsible for CMIP, and we thank the climate modelling groups for making available their model output.
Financial support
This study was supported by the Research Council of Lithuania (Grant No. SIT-8/2015).
Conflicts of interest
None
Ethical standards
Not applicable