1 Introduction
Epenthesis is the insertion of a segment that has no correspondent in the relevant lexical, or underlying, form. There are various types of epenthesis that can be defined in terms of either the insertion environment, the features of the epenthesised segment, or both. The focus of this paper is on consonant epenthesis and, more specifically, default consonant epenthesis resulting in markedness reduction (e.g. Prince & Smolensky Reference Prince and Smolensky1993). Intervocalic consonant epenthesis, as in (1) (from MacKay Reference MacKay1999), meets these requirements; it transforms a vowel-initial syllable to a less marked consonant-initial syllable.
(1)


That this operation is a natural phonological process is implicitly built into modern generative theory, either as a high-valued rewrite rule (by the diagnostic of Chomsky & Halle Reference Chomsky and Halle1968), or as a universal constraint against epenthesis – one that is crucially violable. Thus, given exposure to the right kind of linguistic data, the learner should be able to acquire the epenthesis grammar. Determining the necessary conditions for that acquisition, however, is a non-trivial problem.
There are several sources of ambiguity in linguistic analysis. For example, in the alternations provided in (1), the analysis ‘insert a consonant after a low vowel’ predicts the same (correct) outcome as the more general analysis ‘insert a consonant after any vowel’. Also consistent with the available data is the presence of an underlying /Ɂ/ (in the prefix or the stem), which is deleted in the complementary environments. Some of these ambiguities might be resolved with the collection of more data. However, in practice, ambiguity cannot be completely eradicated (for the learner, if not the linguist), because most real-world data are messy and incomplete.
Lexical exceptions have a long history in phonological theory. Yet there is a conspicuous gap in the phonological learning literature regarding the acquisition of forms that represent exceptions to a general pattern (but see Yang Reference Yang2005, Reference Yang2011 for a metric of morphological productivity). This lack becomes clear when we allow for the possibility that there is no regular pattern at all. This paper is an experimental investigation of the ambiguity that is at the heart of linguistic analysis. Specifically, I ask whether learners favour certain analyses over others (epenthesis, deletion or suppletive allomorphy), and what properties of the input push them toward one analysis or another (cf. Moreton & Pater Reference Moreton and Pater2012).Footnote 1
1.1 Overview
The results of twelve artificial grammar learning experiments are reported in this paper. These twelve separate conditions are divided up into three thematic sets, labelled Experiments 1, 2 and 3. In all conditions, the training data to which participants were exposed consisted of a small set of nonce words, and the morphophonological alternations that arose when those words were inflected in the plural. The surface forms were ambiguous with respect to the underlying forms from which they were generated, and thus there are multiple analyses consistent with the data. After training, participants were tested with novel forms that they heard in the singular. They were then prompted to produce the plural. An example of two training pairs is given in (2).
(2)
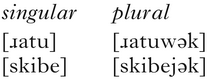
Possible learner analyses consistent with this input follow in (3). Epenthesised segments are in bold.
(3)

Participants might conclude that there is a unique plural suffix, and a process of epenthesis conditioned by vowel context, as depicted in (3a). This analysis competes with the deletion analysis, in which the glide belongs to the word stem, and is deleted in the singular (word-finally), as in (3b). When the potential epenthetic segment is a glide that is homorganic with the stem-final vowel, a third possibility arises, which I will call phonetic epenthesis. This is depicted in (3c), with the superscript glide to distinguish it from phonological epenthesis. The morphological, or suppletive allomorphy, analysis in (3d) assigns the ambiguous glides to the suffix; the correct allomorph must be memorised for each stem.
The analysis chosen by the participants was assessed using novel test items that provided a non-ambiguous environment for perceiving glides. For the example above, these consisted of consonant-final stems like [daɹum]. However, all analyses except suppletive allomorphy predict the same plural form: [daɹumək]. Thus it can only be determined whether learners did or did not adopt the suppletive allomorphy analysis. The phonetic epenthesis analysis will not be available for all conditions, but the deletion analysis will always be a competitor, either making the same predictions as the phonological epenthesis analysis or making no predictions for the relevant test items. Because this holds over all conditions, discussion of the deletion alternative will be reserved for §3.3, where the analytical problem is discussed in more detail.
There are two additional analytical issues that will also be discussed separately, but will be briefly described here. The first is the fact that, under perfect learning of all stem types, the suppletive allomorphy analysis can never be ruled out. This is because it produces the correct allomorphs for all stems. Under imperfect learning, it becomes more difficult to rule out any analysis. If participants produce some forms that are consistent with a rule (of epenthesis, or deletion) and some forms that are not, then all of the above analyses are possible, with the addition of an error term. In some cases it may be possible to make a decision based on the majority pattern (i.e. if there are relatively few inconsistencies). However, there is no general solution to this ambiguity problem, and no formal treatment within theoretical phonology. These issues will be discussed in §5.4.
As we will see from the full set of conditions, in the aggregate participants appeared to adopt either the suppletive allomorphy analysis or the phonetic epenthesis analysis, never the phonological epenthesis analysis. This is the first main finding. The second is that learners showed a strong preference for morphological uniqueness, choosing the analysis that would result in a single plural morpheme. This was observed as a switch in the interpretation of an ambiguous glide from subsegmental to segmental across conditions. The ‘morpheme uniqueness’ pressure, however, was not strong enough to induce learners to adopt a maximally general rule – either deletion or epenthesis. These results suggest that learning true phonological generalisations might be both harder and less common than previously supposed.
The details of the experimental methodology are described in the following section. Beginning in §2.2, the results of each individual condition are given in context. In §3 a global analysis of the results is given, and the body of findings is summarised in §4. A diachronic analysis of consonant epenthesis is given in §5.1 and §5.2, and English intrusive r is discussed as a case study in §5.3. The paper concludes in §5.4 with the implications of these results for synchronic phonology.
2 Experiments
The experiments in this paper use an artificial grammar learning paradigm. For a partial reviews of the phonological artificial grammar learning literature, see Peperkamp et al. (Reference Peperkamp, Calvez, Nadal and Dupoux2006) and Moreton & Pater (Reference Moreton and Pater2012). The use of artificial grammar learning in the study of language change allows the simulation of different stages in the diachronic evolution of a particular linguistic structure (Hudson Kam & Newport Reference Hudson Kam and Newport2009, Culbertson & Legendre Reference Culbertson, Legendre, Bailey and Telig2011). While the methodology does not eliminate native-language bias, informing participants that they will be learning a new language (or a made-up language) has been shown to be effective in achieving learning of non-native patterns. Participants can learn novel words and patterns quickly within this paradigm, and seem to implicitly acquire grammatical rules of which they are consciously unaware.
2.1 Procedure
A total of 234 participants took part in the three sets of experiments (numbers of participants by condition are given in the online supplementary materials).Footnote 2 All were undergraduates participating for course credit in introductory Linguistics courses at the Ohio State University. Participants were seated in front of a computer screen within a sound-attenuated booth. They listened to audio input over headphones, viewed images on the screen and spoke into a microphone when prompted. Continuous audio was recorded in Praat (Boersma & Weenink Reference Boersma and Weenink2016) or Audacity (version 2.1.2)Footnote 3 over the entire experimental session.
2.1.1 Design
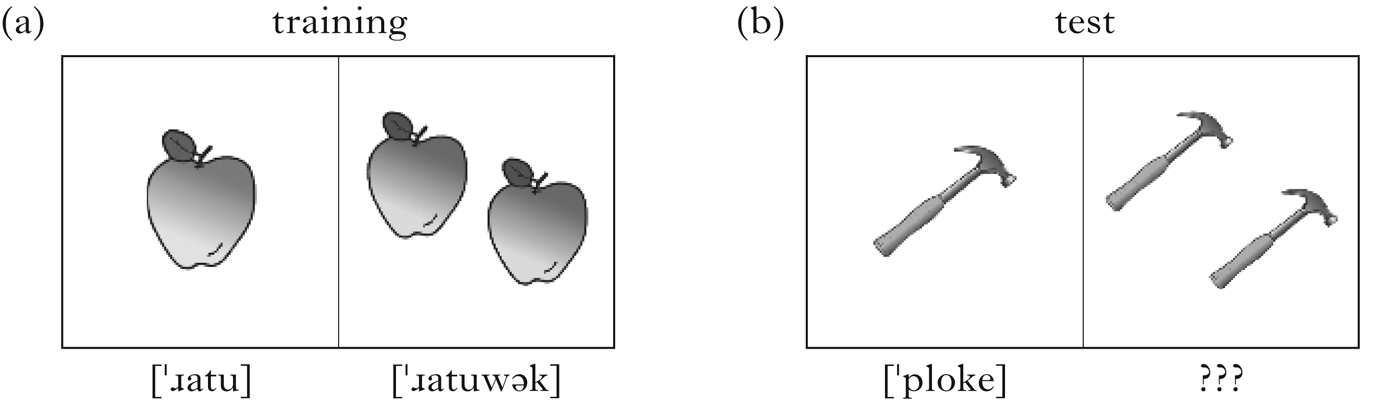
All participants were told that they would be hearing words in a new language, and would later be asked questions about those words. During a passive training stage, participants were exposed to auditory and visual stimuli presented in singular/plural pairs. A picture of a single object (e.g. an apple) accompanied playback of the word for the object in the singular, and a picture of two of the same object (e.g. two apples) accompanied playback of the word in the plural. The singular and plural were clearly related; the plural consisting of the singular plus the addition of a suffix (e.g. [ˈɹatu] and [ˈɹatuwək]), as shown in Fig. 1. At no point were participants alerted to the fact that there would be variation in the form of the plural marker, or asked about alternations. By self-report, participants were often unaware of phonetic differences in the suffix morpheme, and of the alternation ‘rule’ that they were being exposed to.
Training and test paradigm: sequential presentation of singular and plural forms.

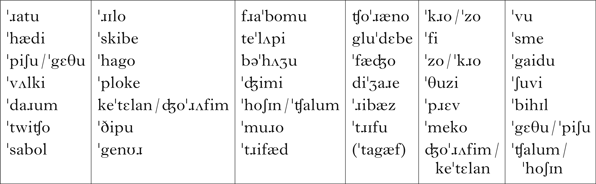
Participants heard 12 or 18 unique singular–plural word pairs during training, depending on experimental condition. This set of words was repeated twice in randomised order, within each of two training blocks. A feedback stage occurred at the end of the first training block, and again after the second training block, immediately preceding the test block. The responses for the feedback trials were recorded but not analysed. During feedback a familiar singular form was heard, and participants were prompted for the plural: ‘Now you say the plural …’. Participants were instructed to speak their response into the microphone. After an interval of five seconds the words ‘The correct answer is …’ appeared on the screen, and the plural form was played over the headphones. The procedure was the same at the test, except the correct answer was not provided; additionally, participants were exposed to singular forms they had never heard before. It should be noted that although there was a distinction between stem types that were familiar or novel (e.g. front vowel-final vs. consonant-final stems), all test words were new words (see Table I for the complete list of stimuli used). In all conditions the test items consisted of all three stem types in equal proportions. There were six unique words of each type: front vowel-final, back vowel-final and consonant-final stems. Each word was repeated twice, in randomised order, giving a total of 36 test items. All participants in a given condition heard the same set of words, associated with the same pictures; the order of presentation, however, was randomised. The entire experiment took roughly half an hour. No participant took part in more than one condition, therefore all comparisons reported are between-subject.
Full list of stimuli across all conditions, both training and test item stems. Items separated by / indicate substitutions: a training item used as a test item, and vice versa, for a particular condition. The item in parentheses was used only in training. See the full list of conditions in the online supplementary materials.

2.1.2 Stimuli
Each experiment utilised a subset of a common pool of auditory stimuli. All stimuli were recorded by a phonetically trained female speaker of American English. Singular and plural words were recorded separately. The full set of singular forms (stems) is given in Table I. All words were stressed on the penultimate syllable of the stem, in both singular and plural forms. All plural forms were of the form singular + Xək, where X was either zero, a glide homorganic with the place of the preceding vowel, a non-homorganic glide, an obstruent ([p t ʧ k]) or a pause/discontinuity, depending on experiment and condition (e.g. [ˈskibeək], [ˈskibejək], [ˈskibewək], [ˈskibekək] and [ˈskibe – ək] respectively; the dash denotes discontinuous stimuli, as discussed below).
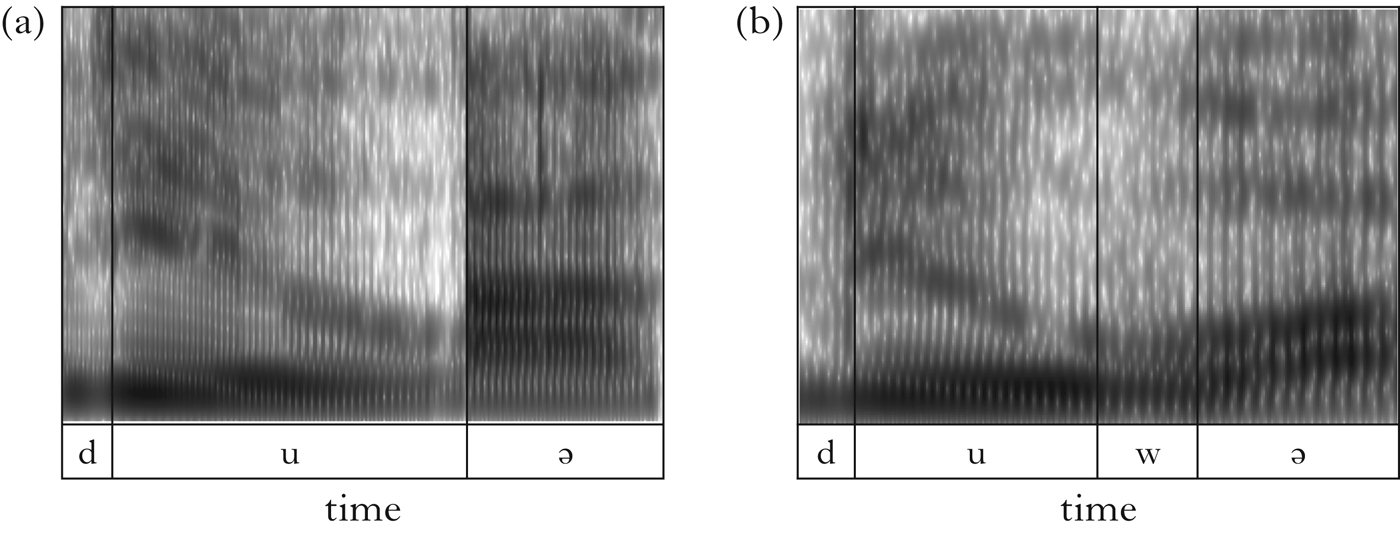
It is difficult, if not impossible, to avoid producing a glide-like transition between adjacent vowels of a certain type. It is similarly problematic to distinguish between glides in onset position and onsetless vowels in unstressed syllables. For example, productions of [ɹatuwək] and [ɹatuək] were auditorily and spectrographically highly similar. For this reason, a set of spliced stimuli were created to ensure the absence of glide-like material. The token [gaidu – ək], for example, was created by recording a single utterance with a long pause: [gaidu ək], then splicing out the pause, as well as the very beginning of the final vowel, to minimise glottalisation, as shown in Fig. 2a. The resulting stimuli exhibited a discontinuity in the spectrogram, and were rather unnatural sounding. However, the results show that such tokens were plausible enough to be categorised by listeners as reflexes of underlying VV sequences. Participants developed various strategies for reproducing these unnatural words: altering vowel quality, introducing glottal stops or significantly drawing out their articulations.
Spectrograms of example stimuli: (a) [gaidu - ək] (spliced, with transitions removed); (b) [gaiduwək] (unspliced, natural production).

All data analysed in this paper were coded only for the unambiguous presence of a consonantal segment. That is, no attempt was made to disambiguate forms such as /ɹatuwək/ and /ɹatuək/ in participants’ productions. Responses that were ambiguous were coded as being consistent with a VV production. In most cases, however, the segments were unambiguous. All consonant-final stems could be clearly distinguished in inflected forms (e.g. [daɹumwək] vs. [daɹumək]). The same was true of vowel-final stems with following heterorganic glides or obstruents. Therefore, inter-transcriber reliability was not tested.
2.2 Experiment 1: learning biases
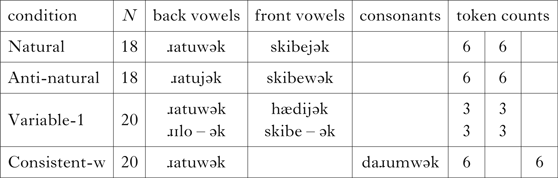
The first set of conditions was designed to determine whether learners would adopt an epenthesis analysis under consistent, but incomplete, data. Table II provides examples of the singular and plural training stimuli for each condition. Learners were trained on two out of the three stem types. The third type provided a test of learner generalisation. In the first two conditions the training input was completely consistent with a phonological epenthesis analysis. In the third, the pattern was partially consistent; and in the fourth it was not consistent. The predictions for novel forms under each of the possible analyses in (3a, c, d) will be given by condition below.
Experiment 1 (learning biases). For each condition, number of participants, example training stimuli and token counts (unique stems) for each stem type are given.

2.2.1 The natural and anti-natural epenthesis conditions
In the first two conditions participants heard only vowel-final stems during training. These consisted of six unique back vowel-final stems (three each ending in /o/ and /u/), and six unique front vowel-final stems (three each ending in /e/ and /i/). The singular forms were the same in both conditions. In the Natural condition, the plural suffix began with a glide homorganic with the stem-final vowel. In the Anti-natural condition, plurals contained glides with the opposite backness specification of the stem-final vowel; I refer to these as ‘anti-homorganic’. In both conditions, training stimuli were consistent with an epenthesis analysis involving the insertion of either [w] or [j] between stem-final and suffix-initial vowels. However, the stimuli were also consistent with other analyses. Given this ambiguity, it was expected that different participants would adopt different analyses, but that biases for one or more of the analyses would emerge.
The relevant test items were of the novel consonant-final stem type. These items unambiguously show the presence or absence of a pre-suffix glide. If participants learned a phonological epenthesis pattern, then they should inflect consonant-final stems without a glide. This is also the predicted result for the phonetic epenthesis analysis; see (4). If participants instead inferred that there were two allomorphs, then they would be forced to guess the proper inflection of consonant-final stems. I will adopt the hypothesis that participants would produce both allomorphs in equal proportions under the suppletive allomorphy analysis.
(4)

2.2.2 Results
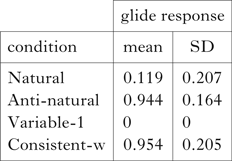
Average rates of glide production on novel stem types are given in Table III. The low rate of glide responses in the Natural condition seems to rule out the suppletive allomorphy analysis, but is consistent with both the phonetic and the phonological epenthesis analyses. Conversely, the result in the Anti-natural condition is consistent with the suppletive allomorphy analysis, but not with phonological epenthesis (the phonetic analysis is not available, as the glides are anti-homorganic with the stem vowel). The two glides were entirely predictable by phonological context, the epenthesis rule was expressible in terms of natural classes ([±back]) and all training forms conformed to CV syllable structure. However, participants failed to learn the Anti-natural pattern as phonological epenthesis. This result suggests that they also failed to do so under similar conditions in the Natural condition. If so, the likely conclusion is that participants in the Natural condition analysed the glide as subsegmental – the result of coarticulation. Additional evidence for this conclusion will be presented in the following sections.
Experiment 1: average proportion of glide responses for novel stem types.

2.2.3 The segmental vs. subsegmental condition
A third condition was designed in order to bias participants towards a segmental analysis of the surface glides, and in so doing, corroborate the phonetic analysis of the Natural condition data. The ‘Variable-1’ condition differed from the previous two in that two types of inflected forms were heard: phonetically natural tokens (identical to the stimuli from the Natural condition), as well as spliced tokens from which all traces of excrescent glides were removed, resulting in VV sequences (see §2.1.2). A subset of stems appeared with the phonetic glide, and a different subset appeared with the spliced plurals. The suffix allomorph was not predictable by stem type, but an individual stem was always inflected in the same way (both within and across participants). It was hypothesised that comparison of the spliced and unspliced tokens would force a segmental interpretation of the latter. This would result in participants learning three (partially predictable) plural allomorphs: /-wək/, /-jək/ and /-ək/.
2.2.4 Results
As the results in Table III demonstrate, this hypothesis was not confirmed. Participants produced no glides on consonant-final stems whatsoever. Despite the clear acoustic differences between the two types of training items, participants seemed to treat them as variants of the same underlying form. This interpretation is supported by a separate orthographic version of the Variable-1 condition. Participants heard auditory stimuli as before, but were instructed to write their responses, giving their best guess as to the spelling. Not a single consonant-final or back vowel-final stem was written with a glide in the plural.Footnote 4 For the trained form [ɹatuwək], for example, typical responses included ratuuck, ratuak and ratoouk (there were two participants who used <’> for all test items, e.g. ratu'ak). These results imply that participants were strongly biased towards the subsegmental interpretation of ambiguous phones in both the Natural and Variable-1 conditions.
2.2.5 The morphological uniqueness condition
Because the Variable-1 condition failed to elicit a segmental glide analysis, a further condition was designed for that purpose. In the Consistent-w condition, participants were trained on unambiguous /w/’s in the plural forms of consonant-final stems. Back vowel-final stem plurals were identical to those used in the Natural condition, and were ambiguous with respect to whether they contained a segmental or a subsegmental [w]. Front vowel-final stems were held out during training (see Table II). The Phonetic Bias Hypothesis in (5a) predicts that participants will analyse the glide in forms like [ɹatuwək] as subsegmental. Thus participants should learn two allomorphs of the plural suffix: /-ək/ and /-wək/. Further, if participants learn that /-ək/ occurs with vowel-final stems, then there should be no /-wək/ at all with front vowel-final stems. However, the presence of the segmental glide in forms like [daɹumwək] may increase the likelihood that participants will analyse the ambiguous forms as containing a segmental glide. This analysis would result in a single surface form for the plural suffix. If an imperative exists to limit the allomorphs of a given morpheme, then the use of /-wək/ with all stem types is predicted. This is the Morphological Uniqueness Hypothesis in (5b).Footnote 5
(5)

The predicted outcomes for items of the novel front vowel-final stem type under the two hypotheses are given in (6).
(6)

2.2.6 Results
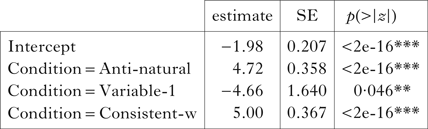
As Table III shows, participants in the Consistent-w condition produced /-wək/ on 95% of front vowel-final stems, indicating that they had largely learned a single form of the plural. A Bayesian logistic regression model of the proportion of glide response by condition found that both the Anti-natural and Consistent-w conditions were significantly different from the Natural condition (reference level), but not from each other, as shown in Table IV. The proportion of glide responses for the Variable-1 condition was significantly lower than in the Natural condition (each participant was treated as a single measurement of glide response over all items from the novel stem type).Footnote 6 This confirms the prediction of the Morphological Uniqueness Hypothesis. The presence of the segmental /w/ completely reverses the majority subsegmental analysis observed in the Natural condition.
Experiment 1: Bayesian logistic regression: average proportion of glide responses for novel stem types by condition. The reference level is the Natural condition. A single measure of average glide response was calculated for each participant. No random effects were included.

2.2.7 Interim summary
In the Anti-natural condition, participants seem to have learned two glide-initial allomorphs for the plural suffix (e.g. [daɹumwək] or [daɹumjək]). The auditorily distinct tokens in the Variable-1 condition, however, resulted in a uniform subsegmental analysis. This is plausible in a model in which listeners have phonetic expectations based on their experience with spoken language (e.g. Fowler Reference Fowler1984, Whalen Reference Whalen1984). Specifically, the fact that the two acoustically distinct plural forms could be classified together is attributable to speaker knowledge that carefully articulated VV sequences result in an intrusive pause or glottal stop, whereas rapid or colloquial speech often produces phonetic gliding between two vowels (otherwise termed ‘intrusive’, ‘linking’, ‘excrescent’ or ‘transitional’ segments; e.g. Browman & Goldstein Reference Browman, Goldstein, Kingston and Beckman1990, Gick Reference Gick1999). The results of the Consistent-w condition can be explained by a morphological uniqueness bias that is stronger than a subsegmental phonetic bias. However, the results of the Natural condition are also explainable by the morphological uniqueness bias alone. Therefore, these conditions alone cannot tell us what bias, if any, participants have for a subsegmental vs. segmental interpretation of ambiguous glides.
2.3 Experiment 2: evidence and allomorphs
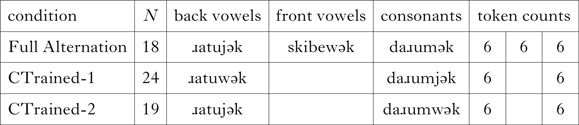
The results of Experiment 1 do not provide support for either the phonological epenthesis analysis or the segmental analysis of ambiguous glides. Experiment 2 tests new training conditions, with the goal of pushing learners towards either of those analyses. In the Full Alternation condition, the training stimuli represent completely consistent and exhaustive evidence (within the world of the experiment) for a process of dissimilatory epenthesis (see Table V). This pattern, however, is also consistent with a deletion analysis in which underlyingly glide-initial suffixes (/-wək, -jək/) lose their onsets after stem-final consonants.Footnote 7 If participants learned the conditioning environments for the three surface alternants perfectly, it cannot be determined which analysis they adopted. Errors, however, can provide insight into what was actually learned.
Experiment 2 (evidence and allomorphs). For each condition, number of participants, example training stimuli and token counts (unique stems) for each stem type are given.

The CTrained-1 and CTrained-2 conditions in Table V were designed to test two factors: the salience of the natural class as a conditioning environment, and the effect of unrelated segmental glides on the analysis of ambiguous glides. It was hypothesised that the difference between consonant-final and vowel-final stems would be highly salient to learners, and that being exposed to the distinction during training would lead to high-accuracy learning. This is the CV Hypothesis in (7a). The transfer rate is defined as the percentage of cross-category errors, i.e. errors in which participants used vowel-final allomorphs with consonant-final stems, and vice versa. Under the CV Hypothesis, transfer rate is expected to be low.
(7)

The CV Hypothesis predicts higher accuracy in the CTrained-1 and CTrained-2 conditions than in conditions like the Anti-natural condition, where consonant-final stems were held out during training. It was also hypothesised that the presence of any unambiguous glide during training might increase the rate of the segmental analysis for the ambiguous glide; this is the Attractor Hypothesis in (7b).
There are numerous possibilities for what ‘same type’ might refer to, but for our purposes segments will be considered to be of the same type if they are both glides. The Attractor Hypothesis then predicts higher rates of [skibewək] response types in the CTrained-1 condition than in conditions like the Natural and Variable-1. Neither CTrained-1 nor CTrained-2, however, is consistent with a single-morpheme analysis. It was therefore predicted that participants would learn a minimum of two allomorphs in each of those conditions.
2.3.1 Results
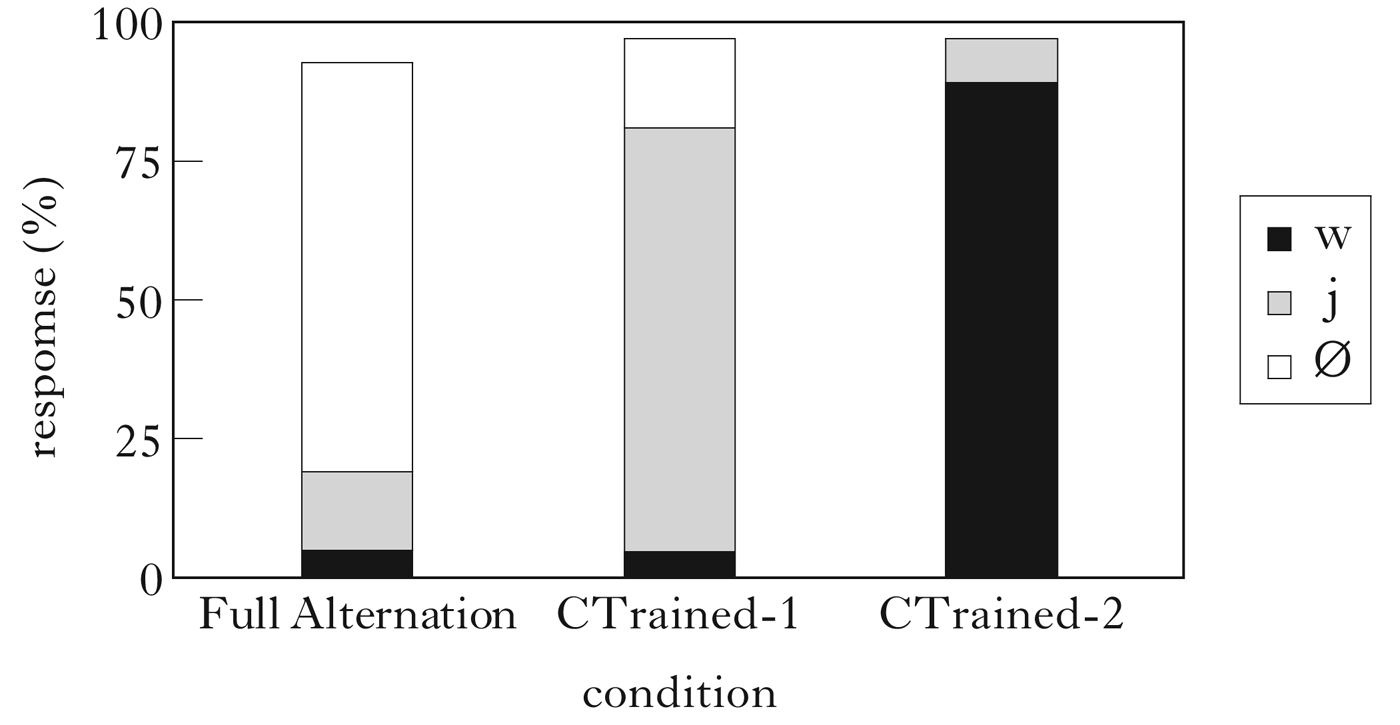
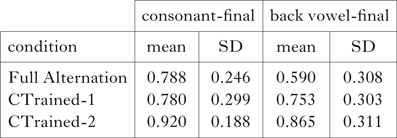
Figure 3 shows the proportion of responses by allomorph on consonant-final stems for each of the three conditions in Experiment 2.Footnote 8 In all three conditions participants heard consonant-final stems during training, and therefore largely responded accurately: /-ək/ in the Full Alternation condition, /-jək/ in the CTrained-1 condition and /-wək/ in the CTrained-2 condition. In all conditions, however, consonant-final stems were sometimes produced with vowel-final allomorphs. In the CTrained-1 condition, 4.7% of responses for consonant-final stems contained [wək] (segmental), while 16.2% of responses contained [ək] (subsegmental). Front-vowel final stems (which were held out during training) had an 8.4% [wək] response rate.Footnote 9 These rates are actually lower than the segmental response rate on consonant-final stems in the Natural condition (see Table III). These subsegmental to segmental response rates fail to support the Attractor Hypothesis.
Experiment 2: average response rate by allomorph for consonant-final stems.

Despite expectations, response accuracy on trained stem types (consonant-final and back vowel-final taken together) in the Full Alternation condition was lower than in conditions where one stem type was held out during training. Table VI shows that this effect is carried by the back vowel-final stems, while accuracy on consonant-final stems in the Full Alternation condition is comparable to the CTrained-1 condition. This means that learners were less consistent on back vowel-final stems when three different allomorphs, paired with three different stem types, were heard during training.
Experiment 2: accuracy by stem type.

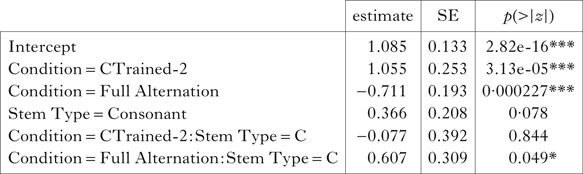
A logistic regression model with accuracy as the dependent variable, and fixed effects for condition (with CTrained-1 as the reference level), stem type (with back vowel as the reference level) and the interaction between the two, is shown in Table VII. Total percentage correct was calculated for each participant, separately for consonant-final stems and back vowel-final stems. There was a main effect of condition: accuracy decreased significantly from CTrained-2 through CTrained-1 to the Full Alternation condition. Stem type failed to reach significance, but there was a significant interaction between stem type and condition. The decrease in accuracy in the Full Alternation condition was due to the back vowel-final stems. In other words, accuracy on consonant-final stems in the Full Alternation condition was significantly higher than predicted by the model without the interaction term.
Logistic regression: accuracy (one measure per participant) as a function of condition, stem type and the interaction between condition and stem type. Condition reference level=CTrained-1; Stem Type reference level=Back Vowel. No random effects were included.

It is possible to explain the three-way difference in accuracy in terms of interference from competitor allomorphs during training, with error rate increasing with the number of allomorphs. The Full Alternation condition contains three unambiguous allomorphs, and the CTrained-2 condition contains two. They are the conditions with lowest and highest accuracy respectively. The CTrained-1 condition, intermediate in accuracy, can also be characterised as containing something more than two allomorphs, but not quite as many as three, due to the ambiguity of the surface glide. The CV Hypothesis predicts that accuracy on vowel-final stems would be affected more than on consonant-final stems. Front vowel-final allomorphs are expected to transfer more to back vowel-final stems than to consonant-final (the Full Alternation condition), and ambiguous allomorphs are associated with back vowel-final stems, contributing variability to that stem class (the CTrained-1 condition).
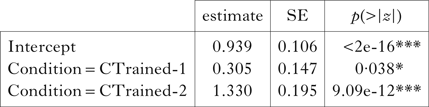
In order to fully test the CV Hypothesis, however, conditions in which participants were trained on both consonant-final and vowel-final stems must be compared to conditions in which consonant-final stems were novel. The Anti-natural condition was chosen for this comparison, because training consisted of two equally frequent and fully predictable allomorphs, neither of which was ambiguous. Overall accuracy in the Anti-natural condition was 71.7%. The results of a logistic regression with accuracy as the dependent variable in Table VIII show that participants achieved significantly higher accuracy in both of the CTrained conditions. Even though there were still transfer errors between vowel-final and consonant-final stems, there were significantly fewer than those that occurred between vowel-final stem types in the Anti-natural condition; in this case the CV Hypothesis was confirmed.
Logistic regression: accuracy as a function of condition for all trained stem types combined. The reference level is the Anti-natural condition. No random effects were included.

A specific type of participant error should be mentioned at this point, as it is relevant for determining accuracy. In some instances participants produced consonant-final forms that lacked stem-final consonants (e.g. the plural of [daɹum] as [daɹuwək]). We can't know if participants would also have dropped the consonant in the singular, as they were never asked to produce those forms. However, it was inferred that the errors arose from an occasional failure to perceive stem-final consonants. For this reason, responses like this were coded as vowel-final, rather than consonant-final. The effect was to reduce the number of consonant-final test items, and increase the number of vowel-final items. If the errors were restricted to test items then the results would be relatively unaffected. However, it is reasonable to suppose that participants also misheard a comparable number of consonant-final stems during training. This is relevant only to the Full Alternation, CTrained-1 and CTrained-2 conditions. The effect in those conditions would have been to introduce inconsistency in the vowel-final allomorphs. There were not a large number of these errors, but they were heavily skewed toward back, rather than front, vowels. That is, stems like [genʊɹ] and [sabol] were more likely to be heard as vowel-final than stems like [ketεlan] and [hoʃɪn]. There were a total of ten such responses, distributed over six participants, in the Full Alternation condition (accounting for 5% of all responses), a total of eleven, distributed over six participants, in the CTrained-1 condition (5% of all responses), and a total of 20, distributed over twelve participants, in the CTrained-2 condition (7% of all responses). These errors may be partially responsible for the fact that accuracy on back vowel-final stems was lower than on consonant-final stems in these three conditions. However, accuracy was still higher in the CTrained conditions than the Anti-natural, and the CTrained-2 condition, with the most errors, had the highest accuracy.
2.3.2 Interim summary
The presence of unambiguous /j/ on consonant-final stems in the CTrained-1 condition did not lead to a higher rate of segmental analysis for ambiguous [w]. Therefore, no support was found for the Attractor Hypothesis. If the additional data in the Full Alternation condition biased learners towards an epenthesis analysis, then accuracy should have been high. But overall accuracy was lower than in conditions in which participants were trained on only one of the vowel-final stem types. Error rates were significantly higher when those errors occurred across front/back categories than when they occurred across the consonant/vowel categories, supporting the CV Hypothesis to a certain extent. Accuracy on back vowel-final stems was consistently lower than accuracy on consonant-final stems in all three conditions. This may be due to a higher error rate across vowel-final stems than between vowel-final and consonant-final stems. It may also be due in part to errors during training in which certain consonant-final stem types were misperceived as vowel-final (thus increasing the variability of the vowel-final class of stems; see §2.4).
2.4 Experiment 3: generalisation
It has often been argued that learners show strong biases towards generalising linguistic data in ‘natural’ ways: extending patterns only to forms that belong to the same natural class in terms of phonological features, or to a class of segments standing in an implicational relationship (e.g. Wilson Reference Wilson2006, Berent et al. Reference Berent, Lennertz, Smolensky and Vaknin-Nusbaum2009). It has also been argued that learners are predisposed to augment, or adapt, linguistic input that is non-optimal in some way (e.g. Bickerton Reference Bickerton1984). More generally, there is reason to believe that there may be a point of memory load beyond which the cognitive system begins to regularise its input (Memory Load Hypothesis) (e.g. Estes Reference Estes1972). There is also support for the hypothesis that the most frequent pattern or element in a language learning paradigm will be ‘boosted’, such that it becomes the only pattern or element (e.g. Hudson Kam & Newport Reference Hudson Kam and Newport2005, Culbertson & Legendre Reference Culbertson, Legendre, Bailey and Telig2011). It is possible, therefore, that inconsistent learning data might actually lead to more consistent response patterns, and, as a result, to patterns that are closer to a default epenthesis rule. Experiment 3 explores how non-uniformity, variability and irregularity during training affect pattern learning.
2.4.1 The frequency conditions
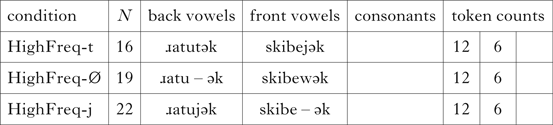
Back vowel-final stems occur twice as often as front vowel-final stems in the three HighFreq conditions in Table IX (by both type and token count). Because allomorphs are predictable and consistent by vowel type, back vowel-final allomorphs also occur twice as often. In all conditions the novel stems are of the consonant-final type. Based on previous results, it is expected that learners will use all trained allomorphs to some degree on consonant-final stems. Frequency matching – participants using allomorphs in proportion to their training frequency – is the null hypothesis for these conditions. The alternative hypothesis (Frequency Boosting) is that the higher-frequency allomorph will be selected disproportionally – boosted beyond its training frequency.
Experiment 3 (generalisation). For each condition, number of participants, example training stimuli and token counts (unique stems) for each stem type are given.

2.4.2 Results: continuous measures
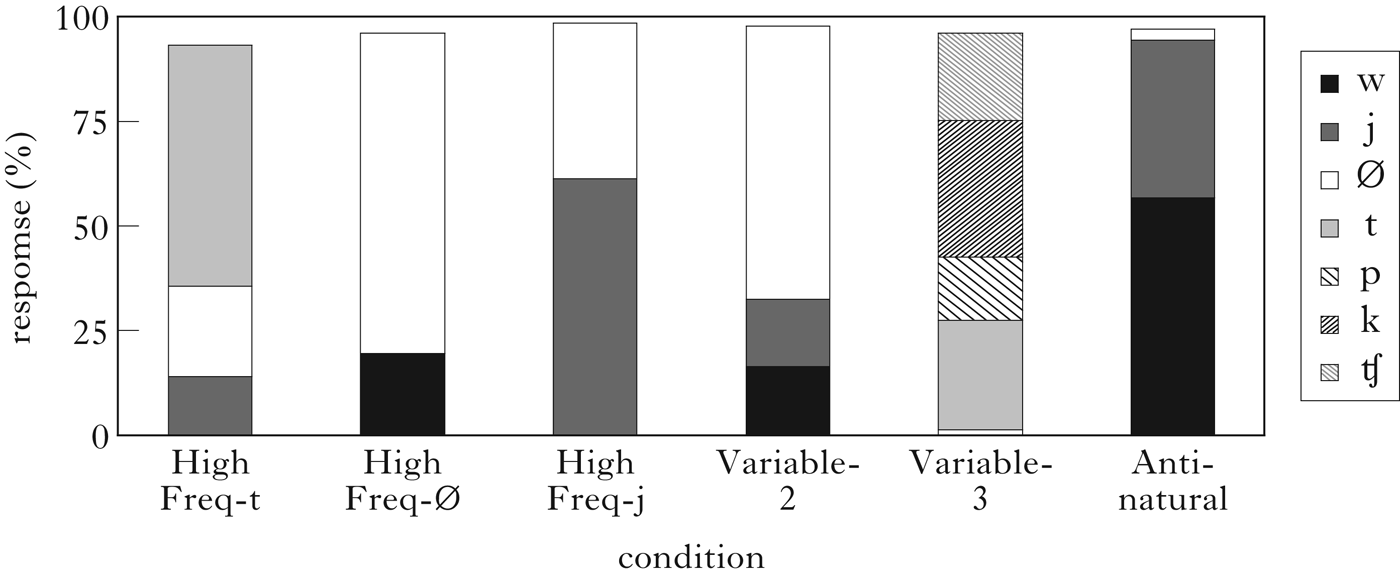
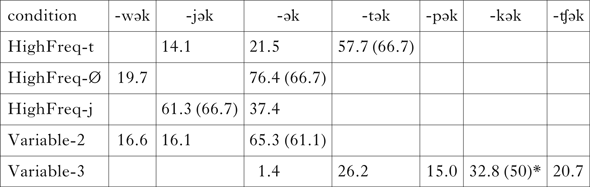
As expected, the more frequent allomorph was selected more often than the less frequent allomorph(s), although never exclusively, as can be seen in the first three bars of Fig. 4. A one-sided Wilcoxon signed rank test (α=0.05) shows that the high-frequency allomorph was not selected significantly more often than its baseline frequency in any of the conditions (separate test by condition; 67% baseline in all cases); see Table X. These results support the frequency-matching null hypothesis.
Experiment 3: average response rate by allomorph for consonant-final stems.

Experiment 3: mean response rates (%) by allomorph for consonant-final stems. Expected response rates, based on training levels, are given in parentheses. Significance is indicated by *.

2.4.3 Results: categorical measures
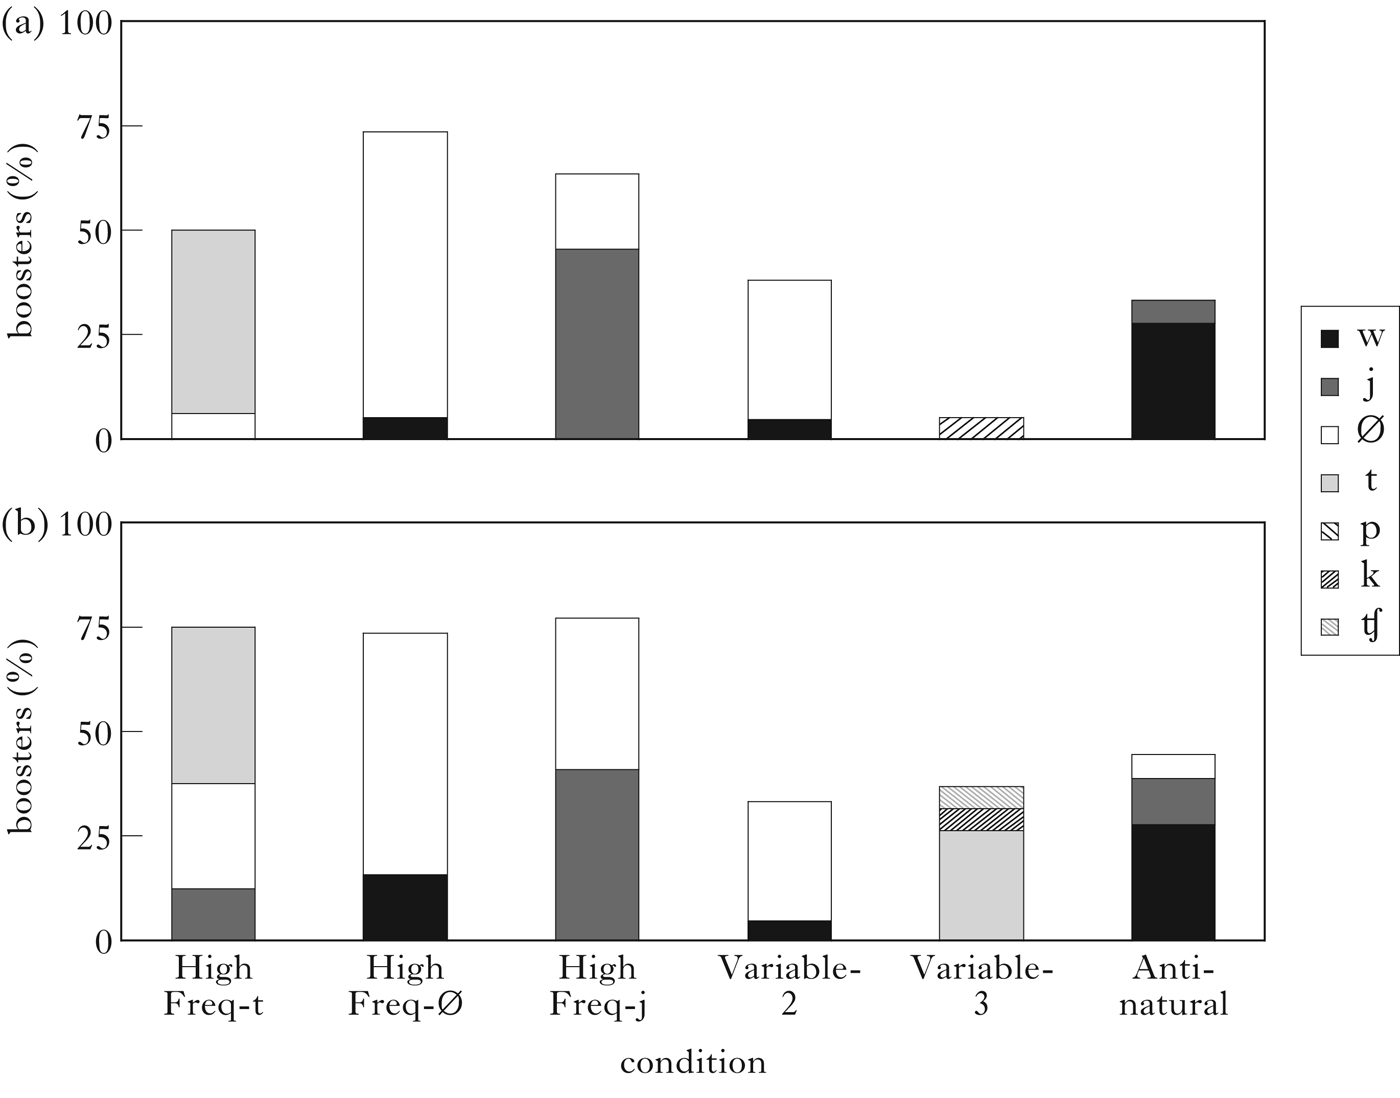
Although frequency-boosting behaviour was not observed in the aggregate, it may be the case that some participants frequency-matched, while others frequency-boosted. In order to quantify individual behaviour with respect to the Frequency-boosting Hypothesis, two different metrics are introduced and compared in this section. The first metric (B1) captures the definition of boosting as categorical behaviour. Although it was very rare for any participant to choose the same allomorph 100% of the time, many participants reached a high level of consistency. In Fig. 5a boosting is defined as selecting the same allomorph on at least 80% of consonant-final test items.Footnote 10 The Anti-natural condition, with equal numbers of both vowel types and both allomorphs, and a non-overlapping distribution (see Table II), is included to provide a comparison level.
(a) Boosting metric 1: a given allomorph was chosen for at least % of test items; (b) boosting metric 2: a given allomorph was chosen at levels significantly greater than baseline frequency (one-sided Wilcoxon signed rank test; α=0.05).

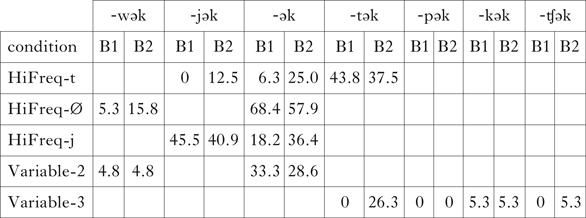
The second boosting metric (B2) requires only that a given allomorph be used at frequencies significantly greater than baseline. Figure 5b shows the percentage of participants who meet the second boosting criterion, based on a one-sided Wilcoxon signed rank test (α=0.05). The most frequently used allomorph was determined by participant, and responses using that allomorph were coded as hits; all other responses were misses. The percentage of boosters in each condition, and under each metric, is given in Table XI.
Experiment 3: consonant-final stems. Percentage of participants, by condition, and by allomorph, who were judged to be boosters under B1 and B2 respectively (see §2.4.3).

By both metrics, the high-frequency allomorph was most likely to be boosted. However, minority allomorphs were also occasionally boosted. The three HighFreq conditions show overall boosting levels above the baseline of the Anti-natural condition. In the HighFreq-Ø and HighFreq-j conditions the continuous measure corresponds closely to the proportion under B1, but less so in the HighFreq-t condition. The second boosting measure shows similar behaviour for the HighFreq-Ø and HighFreq-j conditions, although the minority allomorph makes up a larger share of the total. In the HighFreq-t condition the /-jək/ allomorph is boosted under B2, but not B1.
2.4.4 The variability conditions
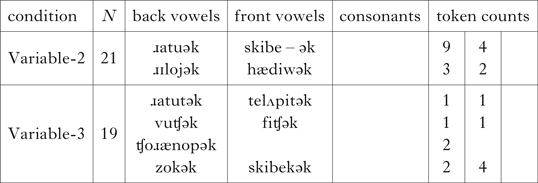
The results show that a frequency asymmetry can lead to boosting for individual participants. The Memory Load Hypothesis predicts that the more allomorphs there are, the more trouble learners will have tracking their environments, and the more likely they will be to default to a single allomorph. A variant on this hypothesis predicts that the greater the variability in the pattern – more allomorphs within a single stem type – the more likely boosting will be. This will be called the Consistency Hypothesis. The Variable conditions in Table XII contain multiple allomorphs: some are more frequent than others, some are unpredictable with respect to stem type, and some stem types are unpredictable with respect to allomorph.
Experiment 3 (generalisation). For each condition, number of participants, example training stimuli and token counts (unique stems) for each stem type are given.

2.4.5 Results
As with the previous set of conditions, there is no evidence for boosting on average. In fact, in the Variable-3 condition [kək] is actually produced at rates significantly lower than baseline (as determined by a two-sided Wilcoxon signed rank test); see Table X. Under boosting metric B1, the categorical and continuous measures diverge considerably. As shown in Fig. 5a, only the most frequent allomorph is boosted (at low levels) in the Variable-3 condition, and only the two most frequent in the Variable-2 condition (i.e. there is no individual participant who ever boosts [jək], despite comparable continuous response rates). Under boosting metric B2 (Fig. 5b), the Variable-2 condition shows similar relative proportions of boosted allomorphs, but the total boosting proportion is now slightly below baseline. The Variable-3 condition, on the other hand, is now much closer to baseline than under B1, and three of the allomorphs undergo boosting, rather than only the most frequent. Furthermore, the highest proportion of boosting occurs for one of the minority allomorphs, [tək], not the higher-frequency [kək].
2.4.6 Interim summary
The results from this set of experiments fail to support the Consistency Hypothesis. The more variants were introduced, and the more unpredictable the distribution, the less likely participants were to boost any single allomorph.Footnote 11 This effect may be observable in the HighFreq-t condition as well, seen most clearly under B1. Of the three HighFreq conditions, HighFreq-t is the only one that can be interpreted as containing more than two allomorphs. As was argued in §2.3.1, the decrease in accuracy from CTrained-2 to CTrained-1 can also be attributed to this difference. In almost all cases, increased numbers of allomorphs are confounded with decreased consistency. The results from the Full Alternation condition (§2.3.1) can be taken to argue against the general Memory Load Hypothesis. However, if learners treat both back and front vowels as members of the same category, then inconsistency is also increased in this condition.
Although boosting behaviour was not found in general, there were individuals who boosted even when the allomorph distribution was uniform (as in the Anti-natural condition), and those numbers rose when one allomorph occurred more frequently than the others. The two boosting measures agree on these general trends. B1, however, classifies fewer participants as boosters in almost all conditions – it is generally a more conservative measure. On the other hand, boosting of minority allomorphs in almost all conditions is higher under B2. Both measures reflect an apparent bias against the /-kək/ allomorph, as seen in the Variable-3 condition. The failure of the /-jək/ allomorph to be boosted under either measure in the Variable-2 condition may also reflect a bias.
3 Aggregate results
In this section results from conditions across the three sets of experiments are compared. These are broken down into three analyses. The first revisits the question of whether there is a preference for the subsegmental or the segmental analysis of ambiguous stimuli. The second identifies a subset of participants whose responses constitute what is defined as a ‘pre-epenthesis’ pattern. The third assesses the evidence for and against the deletion analysis.
3.1 Biases
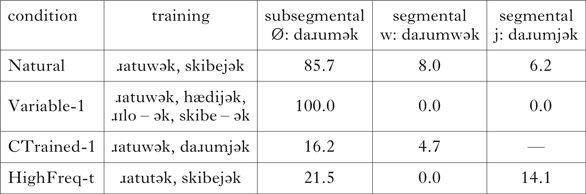
In both the Natural and Variable-1 conditions there appeared to be an almost categorical preference for the subsegmental interpretation of ambiguous glides. However, this potential phonetic bias was confounded by a demonstrated preference for adopting a unique morpheme realisation. Morphological uniqueness does not apply in either the CTrained-1 or HighFreq-t conditions (there are two unambiguous allomorphs). Crucially, both conditions also provide an unambiguous testing environment. Consonant-final stems clearly show whether a segmental glide is present or not. Furthermore, any observed segmental glides have only one possible source: the segmental analysis of the ambiguous training forms. The training distributions for the two conditions are repeated in Table XIII for ease of reference.
Consonant-final stems: mean percentages of segmental vs. subsegmental analyses by condition.

In the HighFreq-t condition, front vowel-final stems, and thus ambiguous allomorphs, are less frequent. Therefore, the number of both segmental and subsegmental responses consistent with [j] are expected to be low relative to [tək] responses. However, the variable of interest is the number of [jək] responses relative to the number of [ək] responses. In the CTrained-1 condition, the overall response rate is expected to be even lower, because any non-[jək] responses with consonant-final stems are actually errors. However, it is still possible to compare the number of [wək] responses to the number of [ək] responses.
As Table XIII shows, subsegmental responses outnumbered segmental responses in both the CTrained-1 and HighFreq-t conditions. This difference is significant under a two-sided binomial test (α=0.05) (76/111 subsegmental responses in total; p < 0.0002, although the HighFreq-t condition by itself fails to reach significance, with 39/63 subsegmental responses; p=0.08). These results support the Phonetic Bias Hypothesis. The relatively high rate of segmental response in the HighFreq-t condition also provides a potential explanation for the low levels of boosting in that condition compared to the HighFreq-Ø and HighFreq-j conditions (Fig. 5). If the effect of higher rates of segmental response is to increase pattern variability, then lower generalisation rates are expected (§2.4.4). In fact, the boosting levels for the HighFreq-t condition are closer to those found in the Variable-2 condition.
3.2 Individual pre-epenthesisers
The experiments of this paper as a whole do not support the conclusion that a rule of phonological epenthesis of any kind has been learned. They thus provide largely negative evidence regarding the diachronic trajectory of such a synchronic pattern. However, there was a small subset of individuals across conditions whose response patterns were not inconsistent with an epenthesis analysis. ‘Pre-epenthesis’ patterns were defined in the following way: consistent use of the allomorph [ək] with consonant-final stems (≥80% of responses), and consistent use of an [Xək] allomorph with vowel-final stems (where X ≠ 0). These patterns have the potential, over time and possibly over generations of learners, to become a productive rule of intervocalic consonant epenthesis. In Table XIV, the number of participants who met these criteria are listed by condition, along with the pattern their responses conform to.
Proportion of pre-epenthesisers by condition. Grey cells indicate stem types held out during training.

In the Natural, Variable-1, CTrained-1 and HighFreq-t conditions, a pre-epenthesis outcome would require a segmental analysis of the ambiguous [ɹatuwək]/[skibejək]-type items. As Table XIII shows, the rate of segmental analysis was very low for those conditions. In addition, evidence for a segmental analysis comes from exactly those consonant-final stems that are required to surface with the bare allomorph. As a result, no pre-epenthesis patterns are found across those four conditions. In the Consistent-w condition, the segmental analysis is the majority one. However, all forms are inflected in the same way, providing no alternation evidence that could lead to an epenthesis analysis. In the Anti-natural and the Variable-3 conditions, the bare allomorph /-ək/ was never heard during training, and consequently does not surface consistently with consonant-final stems at test.Footnote 12
In both the HighFreq-j and HighFreq-Ø Conditions, there were participants who consistently produced [ək] on consonant-final stems.Footnote 13 In the HighFreq-Ø condition, eight of those participants were also pre-epenthesisers (with all but one of them consistently using [wək] with front vowel-final stems). The surface-response pattern as a whole was analysable as intervocalic /w/-epenthesis.Footnote 14 In the HighFreq-j condition, only four of the consonant-final boosters produced a pre-epenthesis pattern.Footnote 15
In the HighFreq-t condition, a number of participants consistently produced [ək] with consonant-final stems. However, none of those produced [tək] consistently with front vowel-final stems, and only one did so with back vowel-final stems. In the Variable-2 condition, no participants reached consistency with all stem types. However, there were participants who were consistent on front vowel-final stems (two using [wək], seven using either [ək] or [jək]), back vowel-final stems (seven using either [ək] or [wək]) or consonant-final stems (six using [ək]), or a combination of two stem types (eight participants in total). In the Full Alternation condition, participants had to consistently maintain the consonant–vowel boundary in order to produce a pre-epenthesis pattern. Only two participants met this criterion.
3.3 Analytic ambiguity
Many of the training conditions in this paper were equally consistent with an epenthesis or a deletion analysis. In the example in (8a), the [t] in [ɹatutək] could have been generated from a rule of intervocalic [t]-epenthesis; however, a rule of word-final /t/-deletion would also account for the full set of forms (as would a rule of postconsonantal /t/-deletion, if the /t/ is analysed as belonging to the suffix morpheme). The majority of the evidence shows that participants chose neither epenthesis nor deletion, appearing instead to learn the plural as a set of (partially conditioned) allomorphs. A reviewer suggests that this outcome might have been due to lack of evidence distinguishing between deletion and epenthesis. If learners had heard forms that biased them towards an epenthesis analysis, they might have learned an epenthesis rule. Biasing data could be provided by a form that doesn't alternate, such as that in (8b). Such a form presumably favours the epenthesis analysis, because the root /pakut/ (and any other similar forms) would have to be marked as exceptional under a deletion analysis.
(8)

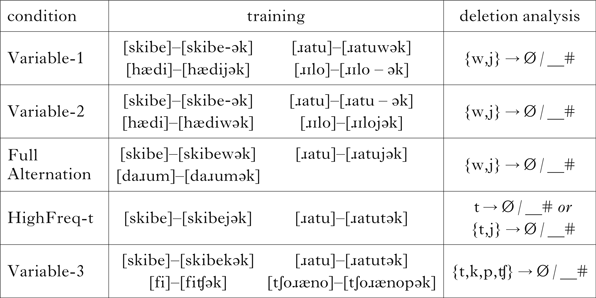
In fact, consonant-final stems that fail to alternate, like [daɹum]/[daɹumək], can be considered to offer exactly this kind of biasing evidence. The bias in this case would be against an analysis in which all stem-final consonants are deleted on the surface. In addition, several of the conditions discussed in this paper can be analysed as favouring a deletion analysis. Those conditions are collected together in Table XV. Example training data pairs are repeated for ease of reference. The final column gives the specific favoured analysis for that condition.
Set of deletion-biasing conditions, with example training stimuli, and specific deletion analysis. (Suffix-final [k] is an exception to the rule for the Variable-3 condition.)

In all conditions the training data are biased towards the deletion analysis, but not always for the same reasons. For example, under the segmental analysis of the surface glides in the Variable-1 and Variable-2 conditions, the epenthesis analysis would require exceptions, so the glide-deletion analysis should be preferred. The Full Alternation condition should favour glide deletion, because the epenthesis analysis requires two segments. But it should also favour deletion over suppletive allomorphy, because deletion satisfies morphological uniqueness. Deletion should also be favoured in the HighFreq-t condition. Under the subsegmental analysis epenthesis would be unpredictable, and under the segmental analysis two epenthetic segments would be required. The epenthesis analysis for the Variable-3 condition would require multiple, phonologically unpredictable epenthetic segments, so deletion should also be preferred in this condition. And in both the HighFreq-t and Variable-3 conditions, deletion should also be preferred over suppletive allomorphy, for reasons of morphological uniqueness.
In all conditions the plural morpheme would be realised exclusively as [ək] under the deletion analysis: thus [daɹum]/[daɹumək]. The HighFreq-t and Variable-3 conditions provide the clearest evidence against this outcome. The majority of consonant-final stems in the HighFreq-t condition (57.7%) were inflected with [tək]; while the majority in the Variable-3 condition (32.8%) occurred with [kək] (§2.4.2). Additionally, all trained allomorphs appeared on at least some consonant-final stems. Not only do these results argue strongly against the deletion analysis, they also argue strongly for the suppletive allomorphy analysis as the preferred, or default, analysis. Morphological uniqueness should prefer deletion or epenthesis over an analysis that requires two to four allomorphs. Thus, even when both the training data and the bias towards morphological uniqueness favour a particular generative analysis, participants behave as if they have learned a set of semi-predictable allomorphs. In the Variable-1 condition, the results are not inconsistent with a glide-deletion analysis. However, the orthographic version of this condition (§2.2.3) argues strongly against this interpretation.
The evidence from the remaining conditions in this section is less clear-cut. The transfer observed between vowel-final stem types in the Variable-2 and Full Alternation conditions could be attributed to errors in recalling the stem-final consonant. In the case of consonant-final stems, productions like [daɹumwək] could be attributed to a stem-final consonant cluster (/daɹumw/). Additionally, the errors described at the end of §2.3.1 could actually be the result of ‘repairing’ consonant-final inputs to conform to a deletion rule (rather than the result of failing to perceive coda consonants in unstressed final syllables). None of this evidence, however, is particularly strong. Furthermore, I take the failure to learn a deletion (or epenthesis) analysis in the HighFreq-t and Variable-3 conditions as a strong argument against a deletion analysis in any of the remaining conditions. This is not definitive, of course. And, in fact, because of the ambiguity inherent in phonological analysis, it is not possible to completely rule out other analyses. The issue of analytic ambiguity within phonological theory more generally will be taken up in the final section of this paper.
4 Summary of all results
The results from the first set of conditions showed a strong bias against surface allomorphy. When the training data allowed, the majority of participants opted for an analysis in which the plural suffix was invariant. In the Natural and Variable-1 conditions, this meant analysing ambiguous surface forms such as [ɹatuwək] as underlyingly /ɹatu+ək/, with an ‘excrescent’ glide, rather than /ɹatu+wək/, with a segmental glide. In the Consistent-w condition, it meant the opposite: analysing [ɹatuwək] as /ɹatu+wək/, rendering it consistent with forms like [daɹumwək]. While individual variation was the norm in these experiments, a pressure for morphological uniqueness imposed a level of consistency both within and across participants not seen under any other conditions.
While morphological uniqueness was confounded with a potential phonetic bias (towards the subsegmental interpretation of ambiguous glides) in the Natural and Variable-1 conditions, such a bias could be inferred from the pattern of errors in the CTrained-1 and HighFreq-t conditions. In the two conditions combined, 69% of relevant responses were subsegmental.
There was little to no evidence for either an epenthesis or deletion analysis in any of the experiments. In general, participant behaviour was much more consistent with what would be expected from (imperfect) memorisation of a set of allomorph-stem associations – a ‘conjugation’ analysis (Hale Reference Hale and Sebeok1973). In fact, the multiple-allomorph analysis seems actually to be preferred, rather than being an analysis of last resort. Even when morphological uniqueness could be satisfied by adopting a deletion or epenthesis analysis, participants showed no evidence of having learned such a rule.
In terms of accuracy and consistency, learners were actually worse in the full training condition than in the conditions where one stem type was held out during training. The more allomorphs they heard during training – regardless of how predictable their distribution was – the worse they did. What this means, besides the fact that participants were not learning an epenthesis rule, is that they were also failing to exploit the available natural classes as predictors of allomorph identity. In the non-variable conditions, allomorphs were predictable by stem types, definable as [+consonantal] vs. [―consonantal], and [+front] vs. [+back] (or some other comparable configuration of features).Footnote 16 Although consistency across the [±consonantal] natural class was higher, it was not high enough to produce epenthesis-consistent results. This is surprising under the expectation of a psychologically robust distinction between consonants and vowels. For example, speech errors seem to respect the consonant/vowel distinction: consonants swapping only with other consonants, and vowels with other vowels (e.g. MacKay Reference MacKay1970, Shattuck-Hufnagel Reference Shattuck-Hufnagel1986). However, most such errors reported are between word-initial consonants, or consonants in onset position. Data on errors with vowels appears to be restricted largely to primary stressed position (often in monosyllabic words). Natural class categories based not only on word-final position, but also on segments in unstressed syllables, are likely to be less salient to listeners. Furthermore, generalisations involving consonants may require different contexts than those involving vowels, and may depend strongly on the type of process being generalised (Finley Reference Finley, Carlson, Hoelscher and Shipley2011). See also Goldrick (Reference Goldrick2004) and Kapatsinski (Reference Kapatsinski2010) for similar cross-category transfer in artificial grammar learning experiments.
On average, frequency-matching behaviour was observed in conditions with multiple allomorphs. However, categorical measures revealed that some participants ‘boosted’: using a single allomorph almost exclusively in their inflection of consonant-final stems. And there were more of these boosters in conditions with non-uniform frequency distributions. It may be that certain individuals have a general predilection for boosting, with approximately 33% of participants boosting one or the other of two allomorphs in the baseline Anti-natural condition. However, contrary to the Consistency Hypothesis, there were fewer boosters in conditions with more variants and less predictability.
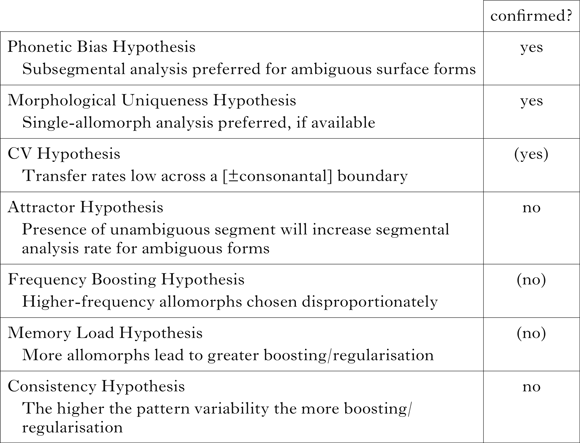
All hypotheses tested in this paper are given in Table XVI, with information as to whether their status is confirmed. The parentheses for the CV Hypothesis indicate that a difference was found, but it was smaller than expected. The parentheses for the Frequency Boosting Hypothesis indicate that there was no effect found in aggregate data, but categorical measures showed a boosting effect. Parentheses for the Memory Load Hypothesis indicate that the data to directly test this hypothesis were limited.
Summary of findings by hypothesis.

The full set of results also suggests that there may be individual differences in the likelihood of adopting one analysis or another (assuming the observed differences are stable over time). Individual differences provide a way for phonologisation routes which are unlikely on average to arise: scenarios in which ‘phonemicisers’ and ‘boosters’ are also innovators, acting to spread a change to the rest of the population (cf. Milroy & Milroy Reference Milroy and Milroy1985, as well as a growing literature on individual differences and the role they may play in sound change; e.g. Dimov et al. Reference Dimov, Katseff, Johnson, Solé and Recasens2012, Yu Reference Yu and Yu2013). Certain individual participants, those who boost but also maintain category boundaries, can be categorised as producing a pattern that could become epenthetic over time. Successive incremental changes over this type of input may provide a path to phonologisation (cf. Kirby Reference Kirby2001).
5 Discussion and conclusions
The focus of this paper has been on intervocalic consonant epenthesis. We began with an example of one type, what could be called the default epenthesis pattern, in which the same segment is inserted in all relevant contexts regardless of other featural differences. There is a second type, which has been termed assimilative epenthesis (cf. de Lacy Reference de Lacy2006), in which the epenthetic segment shares features with one or both of its flanking vowels.Footnote 17 In the next two sections I will sketch different diachronic trajectories for the two different types, and will argue that there are certain stages that are necessary in the emergence of both as productive synchronic patterns. In light of the experimental results just presented, the conclusion will be that such patterns are difficult to learn and unlikely to be induced from ambiguous data. §5.3 will test those conclusions against a specific case study for which we have considerable diachronic and synchronic data: English intrusive r. The paper will end with more general implications of this work for synchronic phonological theory.
5.1 Epenthesis from coarticulation
Synchronically, assimilative epenthesis can be analysed as a process of default epenthesis, followed by assimilation to one or more vocalic features. Diachronically, however, the pattern is taken to derive from the natural coarticulation of neighbouring vowels, yielding segments such as glides, certain fricatives and, in some cases, glottals (see Blevins Reference Blevins and Good2008) that can be described as either articulatorily or perceptually minimal (e.g. Clements & Hume Reference Clements, Hume and Goldsmith1995, Steriade Reference Steriade, Hanson and Inkelas2009). An example of an assimilative epenthesis pattern in Balangao, from Shetler (Reference Shetler1976), is given in (9). In this language the front glide [j] is inserted after high front vowels, and the back glide [w] is inserted after back vowels. The low vowel /a/ does not participate, undergoing coalescence in hiatus contexts.
(9)

There are a number of different permutations of this general pattern that have been described. For example, a three-way split between [j] after front vowels, [w] after back vowels and [Ɂ] after /a/ occurs in Malay. In Cupeño, epenthesis in the imperative plural inserts [j] after /i/, but either [w] or [h] after /u/, whereas, in Abujhmaria, it is the second vowel that conditions the epenthetic segment, and /a/ sometimes patterns with front, and sometimes with back vowels (see Morley Reference Morley2015: Appendix for details on these and other examples). While these patterns likely have the same phonetic origin, the fact that they differ by conditioning context and by epenthetic segment argues that they have entered the phonology in the different languages in different ways. Furthermore, if a distinction can be made between phonetic and phonological patterns of assimilative epenthesis, there must be a mechanism by which subsegmental sounds (e.g. glides automatically produced in the transition between two vowels) can become segmental. In several of the experiments reported here, deliberately ambiguous stimuli were used in order to determine what factors might affect learners’ interpretation of such glides in one direction or another. A bias was found for the subsegmental analysis, but this bias was completely reversed by the strong preference for an invariant realisation of the suffix allomorph. It is not clear how the morphological uniqueness bias could lead to a phonological epenthesis pattern, given that it requires the absence of alternations. However, there may be a route by which an epenthesis-consistent pattern could be achieved after phonologisation of one or more intervocalic glides. This is a potential avenue for future work. A second requirement for the phonologisation of coarticulation-based epenthesis is pattern generalisation. While an excrescent high back glide following a high back vowel may happen naturally, it is less likely for a high back glide following a mid or low back vowel. Generalisation is required either at the phonetic or at the phonological stage, and probably at both. Phonological generalisation is also required for non-assimilative epenthesis and, in fact, any categorical pattern that arises out of continuous change.
5.2 Epenthesis from deletion
Default (non-assimilative) epenthesis is typically analysed as arising from ‘rule inversion’ (Vennemann Reference Vennemann1972), in which learners reanalyse the results of historic deletion (of a consonant in certain environments) as due to synchronic epenthesis (of that consonant in the complementary environments). This scenario is illustrated in (10). In (a), a hypothetical stem morpheme is shown inflected, first with a consonant-initial suffix, and then with a vowel-initial suffix. There are no phonological alternations. At some later time, (b), a stem-final consonant is lost in preconsonantal position – a common historical change. This affects the first inflected form, but not the second. In the final stage, (c), the learner is faced with an ambiguous [t]~Ø alternation. Reanalysis, if it occurs, involves the choice of /pami/ as the new underlying form, and [t] is epenthesised when the stem is followed by a vowel-initial suffix.
(10)

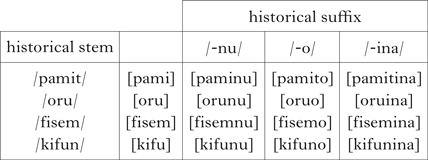
This process seems relatively straightforward at first glance. But it has been shown that there are several necessary conditions that must hold for rule inversion to result in synchronic epenthesis. Table XVII, adapted from Morley (Reference Morley2012), illustrates the specific case of C~Ø alternations at the stem–suffix boundary. For the reanalysis in (10c) to be adopted, it is critical that learners analyse the second suffix as vowel-initial. Definitive evidence for this would come from non-alternating forms. This, in turn, requires that not all consonant-final roots undergo deletion – such words are represented by the form [fisem] in this example. However, while [pamito] can be analysed as the product of [t]-epenthesis between a root-final vowel and a suffix-initial vowel, the process is not consistent. No epenthesis occurs in [oruo] (or with any other historically vowel-final root). Furthermore, unless only /t/’s delete, forms like [kifuno] will result, requiring additional ‘epenthetic’ segments – in this case [n].
Hypothetical precursor epenthesis system, showing surface forms after loss of prefinal and preconsonantal coronals.

The point here is that patterns resulting from historical changes will not be consistent and unambiguous. Two types of generalisation are required to transform the synchronic pattern from Table XVII into default epenthesis. The first is generalisation across vowel-final stems, for a given suffix. For the case of [t]-epenthesis, all [kifuno] type forms must be changed to [kifuto]. And all [oruo] type forms must be changed to [oruto]. Furthermore, this levelling must occur only within synchronic vowel-final roots, and not cross over to consonant-final ones. Transfer will introduce forms such as [fisemto], which would undermine the epenthesis analysis. The second is generalisation across all vowel-initial suffixes, such that the variant chosen with /-o/ is the same variant chosen with /-ina/, etc.
In the experiments reported here, learners often frequency-match, they transfer across consonant–vowel boundaries and they tend to learn sets of allomorphs. These results suggest that default synchronic epenthesis may emerge only rarely, requiring a convergence of non-typical types of learners and specific historical conditions. This conclusion is supported by at least one typological survey of intervocalic consonant epenthesis (Morley Reference Morley2015). However, more work in this area is needed. In the first place, a method of sampling is required that can provide a good approximation for the actual rate of occurrence of epenthesis cross-linguistically. Then the proper baseline must be determined in order to assess whether the obtained counts are lower than expected, i.e. lower than comparable phonological processes. This would require a much more explicit theory of how generative theory maps to typology than currently exists. However, the enterprise runs into problems much earlier. There is no universal diagnostic for establishing whether a given observed pattern is an instance of synchronic epenthesis rather than an instance of something else, such as deletion (see Lombardi Reference Lombardi2002, de Lacy Reference de Lacy2006, Morley Reference Morley2015). And for many sources, ‘epenthesis’ is used merely as a descriptive label, rather than as a hypothesis about the generating grammar. Thus it is uncertain how many cases of true epenthesis are attested. If synchronic epenthesis is exceptional, as predicted, then individual cases of synchronic epenthesis can offer considerable insight into the exact conditions necessary for their emergence.
5.3 Intrusive r
English intrusive r represents a particularly well-known case of what is generally analysed as consonant epenthesis. The phenomenon has been documented from at least the middle of the 19th century in the United Kingdom (see e.g. Jones Reference Jones1956), and there have been numerous analyses of the pattern within generative theory. In fact, there has been, and continues to be, disagreement about the proper phonological analysis of intrusive r. What is known is that a number of dialects of English in Britain, the United States, New Zealand and elsewhere experienced loss of r at some point in their history;Footnote 18 this occurred preconsonantally both within and across words, as well as prepausally (e.g. [bɑɹ#bəloʊ] bar below > [bɑbəloʊ]). However, these non-rhotic varieties maintained r in intervocalic environments (where it is known as ‘linking r’), resulting in alternations such as [bɑbəloʊ] ~ [bɑɹəbʌv] bar above. A further subset of these dialects also developed what is known as ‘intrusive r’: an r that subsequently appeared in contexts in which it was historically absent, but which were congruent with the existing r~Ø alternation, e.g. [sɑɹælɪs] saw Alice vs. [sɑbɑb] saw Bob.
Most accounts also agree on the following facts: that both linking and intrusive r, if they appear, appear only following non-high vowels, a set which always includes [ə] and diphthongs ending in [ə], and may often include mid or low back vowels such as [ɑ] and [ɔ]. Furthermore, there do not appear to be any cases of intrusive r without accompanying linking r. There are cases, however, of linking r without intrusive r (e.g. conservative RP, as reported by Durand Reference Durand1997), and of non-rhotic dialects which have neither, having lost r in all environments (e.g. some varieties of Southern U.S. English, as reported by Wells Reference Wells1982). While linking r is sometimes analysed as underlying, intrusive r is more often analysed as the result of epenthesis. The fact that innovated r’s appear after vowels which are phonetically reduced, in unfamiliar place or person names, and with words that do not contain orthographic r, comprise the most common arguments for why these r’s cannot be underlying (see, for example, McCarthy Reference McCarthy1993 and Rubach Reference Rubach2000).
A synchronic account of the r~Ø alternation that makes no reference to historical forms posits either a general rule of r-deletion or a general rule of r-insertion. The typical argument against the deletion analysis is also orthographic, resting on the assumption that no literate speaker of English could possess, for example, an underlying form /kɑməɹ/ for comma (e.g. Foulkes Reference Foulkes1997). Johansson's (Reference Johansson1973) account seems to represent the dominant view: that historic r-deletion eventually led to rule inversion, as speakers lost track of which words were historically r-final. However, this rule inversion also requires a change in underlying representations that contradicts orthography. It is unclear why /kɑ/ would be an acceptable underlying form for car (despite the fact that there obviously is an ‘r’ in car), while /kɑməɹ/ for comma would not.
Furthermore, most phonological analyses of intrusive r deal exclusively with r-sandhi (innovated r at word or morpheme boundaries), or even just r-liaison (at word boundaries only), but r may also be inserted within monomorphemic words, such as [dɑɹtəɹ] daughter (Jackson Reference Jackson1830), as well as word-finally, even when there is no pause, or no following vowel-initial word (see e.g. Wells Reference Wells1982). These ‘hyper-rhotic’ dialects are attributed to the stigmatisation of r-deletion. Speakers are aware that they ‘drop r’s’ with respect to other, possibly more standard, dialects, and make an effort to ‘add them back in’. However, this analysis implies a process of r-deletion that speakers are attempting to undo, and Harris (Reference Harris1994) takes the overgeneralisation as evidence that r has become underlying in those words (e.g. [əmbɹεlə] > [əmbɹεləɹ]).
The case for an epenthesis rather than a deletion analysis is thus far from unassailable. Epenthetic r would also be restricted to occur after only non-high vowels, and would be gradiently conditioned by other vowel qualities, occurring more frequently with certain vowels, and in certain words. In some cases, epenthetic r would result in more marked forms (preconsonantally and in certain word-final environments). Nevertheless, whether English intrusive r should be considered a case of default epenthesis or not, the pattern does illustrate an apparently uncommon, but necessary, type of learner generalisation. The explanation for why such generalisation occurred may be found in the phonetics of rhotic segments (see for discussion Broadbent Reference Broadbent1991 and Gick Reference Gick1999).
5.4 Synchronic phonology
Although current phonological theory has little to say about the likelihood of different phonological rules, or repairs, the implicit assumption is often that all phonological operations are equally accessible to learners. However, this may not be the case, and the determination of likelihood may depend very strongly on the diachronic origins of those patterns. Epenthesis may be much less common than other phonological rules. Or it may be the case that many phonological rules are relatively uncommon (cf. the ‘too many solutions’ problem; Wilson Reference Wilson2000, Myers Reference Myers2002). On closer examination, many apparently categorical phonological rules have been seen to show variability, both conditioned and unconditioned. Whatever the source of that variability, the end result is an explosion of possible analyses that are equally consistent with the data.
It was the apparent difficulty of the learning problem that motivated a large part of Chomsky's work in both syntax and phonology (e.g. Chomsky Reference Chomsky1965). The assumption of the degraded nature of the learner's input (filtered through performance), and the incompleteness of the evidence available to infant learners, led to the conclusion that certain properties of grammar must be innate. However, the resultant learning theory offered no guidelines for classifying inconsistent, or ‘exceptional’ forms. This remains true of linguistic theory generally. Because of this, there exists no clear diagnostic for determining the best analysis of a given set of linguistic data (how many exceptions is too many?; at what point does an exception change into decisive evidence for an alternative analysis?).
While no one would deny that languages change over time, and that synchronic grammars must be the result of an accumulation of diachronic changes, the far-reaching ramifications of these facts are seldom explored to their full extent. Consider once again the examples from §3.3, [ɹatu]/[ɹatutək] and [daɹum]/[daɹumək], which are meant to represent a fully ambiguous scenario, consistent with both [t]-epenthesis and /t/-deletion. The additional forms [pakut]/[pakutək] presumably tip the scales towards an epenthesis analysis. But what kind of test items could provide definitive proof that learners have adopted this analysis? The epenthesis analysis would result in novel consonant-final singular forms retaining their final consonant in the plural. Novel vowel-final forms would acquire a [t] in the plural. But the same results are expected for a suppletive allomorphy analysis, in which the allomorph /-tək/ is generalised to these forms. We could reverse the testing conditions, providing plurals and asking for singulars. But forms with /t/ are inherently ambiguous, and listeners would have to guess under any analysis. In fact, the deletion analysis is still a possibility as well, if forms like [pakut]/[pakutək] can be treated as exceptions. All else being equal, the analysis without exceptions is, of course, the preferred one. But when dealing with real language data, it is rare to find any exceptionless patterns.
The conclusions in this paper are possible because there is so much supporting evidence against the generative analyses. Had the results been less unbalanced, it would have been nearly impossible to completely rule out the epenthesis or the deletion analysis. Performance errors and lexical exceptions are to be expected, and, in practice, linguists seem to adopt implicit and intuitive criteria for deciding when forms are to be classified as exceptions, as opposed to providing evidence for an alternative analysis. The problem is the lack of a transparent standard for this criterion, and by extension, for selecting one linguistic analysis over another. This creates a serious falsifiability problem within linguistics, and hinders attempts to answer larger questions about language universals (see Morley Reference Morley2015 for in-depth discussion of this issue).
This paper represents part of a larger project investigating the existence of universal principles in phonological consonant epenthesis. As has just been argued, however, the undertaking goes far beyond a single phonological pattern. The true scope of the question encompasses the learning problem (this paper), diachronic change (Morley Reference Morley2012) and typological methodology (Morley Reference Morley2015). The conclusions at this point are the following: there is little evidence that phonological (vs. phonetic) epenthesis is an accessible analysis to a learner engaged in morphological learning, and the necessary conditions under which default synchronic epenthesis could arise are very constrained. Default epenthesis is predicted to be rare, and typological evidence has been shown to be consistent with this prediction. Additionally, a general mechanism of rule inversion is unlikely to supply a simple and direct path to a categorical phonological grammar. More generally, I believe we must alter some of our core assumptions about both the nature of synchronic grammars and the trajectory of historic change, in order to link the two within a coherent theory of phonological competence. Exceptions must be explicitly defined, and incorporated into models of learning. The burden of proof should be shifted onto the generative analysis, with suppletion or memorised stem–allomorph pairs as the null hypothesis. We must also devise an experimental criterion for rejecting that null hypothesis. Most importantly, we need a true theory of diachronic change, in which the beginning and end states, and all the states in between, are direct correspondents to states defined within synchronic theory.