


Introduction
Species richness and abundances are central parameters for ecology, crucial for measuring biodiversity and species composition of any given site (Magurran, Reference Magurran2004). Such information is paramount to understand community interactions because composition and diversity influence relationships among species and their interactions with the surrounding landscape (Morin, Reference Morin and Morin2011). Richness and composition data can also support conservation decisions to defray threats to habitats and landscapes that species use (Robinson, Reference Robinson2006).
Changes in natural landscapes can affect species diversity, benefiting or harming some groups according to their relationships with these environments and landscape structure (Fahrig, Reference Fahrig2003; Gardner et al., Reference Gardner, Barlow and Peres2007). These modifications may interfere dramatically in various aspects of an organism’s biology, such as interspecific interactions and distribution patterns (Magrach et al., Reference Magrach, Laurance, Larrinaga and Santamaria2014). Landscape fragmentation, along with topographic complexity and proportion of forested area can, for example, increase richness of birds adapted to altered environments and decrease endemic species within the forest (Davies et al., Reference Davies, Orme, Storch, Olson, Thomas, Ross, Ding, Rasmussen, Bennett, Owens, Blackburn and Gaston2007; Martinez-Morales, Reference Martinez-Morales2005), and the same has been shown for lizards and amphibians (Cabrera-Guzmán and Reynoso, Reference Cabrera-Guzmán and Reynoso2012; Leavitt and Fitzgerald, Reference Leavitt and Fitzgerald2013). Furthermore, the conversion of forest areas into agriculture landscapes can significantly alter the structure and dynamics of a lizard community (D’Cruze and Kumar, Reference D’Cruze and Kumar2011), and when this happens within elevation gradients, they may affect species richness in different groups (Qian, Reference Qian2010). Similarly, habitat loss promoted by anthropic alterations decreases diversity of amphibians by limiting the persistence of species that depend on different habitat types in larval stages, for example (Becker et al., Reference Becker, Fonseca, Haddad, Batista and Prado2007; Becker et al., Reference Becker, Fonseca, Haddad and Prado2010), but also due to influences in species interactions in general (Fagan et al., Reference Fagan, Cantrell and Cosner1999).
Habitat changes inherent to degradation caused by human activities can significantly influence diversity through changes in species richness and abundance patterns (D’Cruze and Kumar, Reference D’Cruze and Kumar2011; Nogueira et al., Reference Nogueira, Valdujo and França2005; Vitt et al., Reference Vitt, Colli, Caldwell, Mesquita, Garda and Franca2007; Zeng et al., Reference Zeng, Bi, Li, Chen, Pike, Gao and Du2014). This is in fact the main cause of biodiversity loss worldwide (Sala et al., Reference Sala, Chapin, Armesto, Berlow, Bloomfield, Dirzo, Huber-Sanwald, Huenneke, Jackson, Kinzig, Leemans, Lodge, Mooney, Oesterheld, Poff, Sykes, Walker, Walker and Wall2000), and therefore understanding the impact of such changes is critical for conservation strategies. Habitat variables, for example, may be more important to explain species distribution than species phylogenetic relationships (Garda et al., Reference Garda, Wiederhecker, Gainsbury, Costa, Pyron, Vieira, Werneck and Colli2013). In addition, habitat heterogeneity can also contribute to explain patterns of species richness, abundances, and composition, whether due to a high diversity of vegetation types (Nogueira et al., Reference Nogueira, Valdujo and França2005) and/or through structural factors of the environment itself (Vitt et al., Reference Vitt, Colli, Caldwell, Mesquita, Garda and Franca2007).
Lizards have been used as ecological models in studies that tested and proposed theories on population, community, and foraging ecology (Pianka and Vitt, Reference Pianka and Vitt2003; Vitt and Pianka, Reference Vitt and Pianka1994). However, research on the responses of this group to changes in landscape and habitat structure is limited in comparison to other terrestrial vertebrates (Gardner et al., Reference Gardner, Barlow and Peres2007). Habitat variables such as quantity of fallen logs, burrows, litter, rocky outcrops, vegetation cover, and density were shown to affect the occurrence of certain species and hence richness and abundances of lizard in each community (Garda et al., Reference Garda, Wiederhecker, Gainsbury, Costa, Pyron, Vieira, Werneck and Colli2013; Michael et al., Reference Michael, Cunningham and Lindenmayer2008; Nogueira et al., Reference Nogueira, Valdujo and França2005; Vitt et al., Reference Vitt, Colli, Caldwell, Mesquita, Garda and Franca2007). Indeed, these habitat variables provide refuges, reproductive and foraging sites, and places for thermoregulation. Also, as in other terrestrial vertebrate groups (Davies et al., Reference Davies, Orme, Storch, Olson, Thomas, Ross, Ding, Rasmussen, Bennett, Owens, Blackburn and Gaston2007; Martinez-Morales, Reference Martinez-Morales2005), landscape characteristics such as topographic complexity, altitude, and canopy cover can influence richness and abundance parameters (Qian, Reference Qian2010). However, such effects can vary among biomes, and the variables most influencing lizard richness and abundances in Amazonia (Garda et al., Reference Garda, Wiederhecker, Gainsbury, Costa, Pyron, Vieira, Werneck and Colli2013) do not influence communities in more open areas, such as the Cerrado (Nogueira et al., Reference Nogueira, Valdujo and França2005) and in Caatinga (Cavalcanti et al., Reference Cavalcanti, Garda, Costa, Savaugere, Pessoa, Colli, Lion and Mesquita2023; Werneck et al., Reference Werneck, Colli and Vitt2009).
Research on lizard diversity consistently highlights the importance of topographic heterogeneity and environmental complexity. Pianka (Reference Pianka1967) identified spatial heterogeneity, particularly in vegetation, as a crucial factor determining lizard species diversity in North American deserts. This finding is supported by more recent global studies, which demonstrate positive effects of topographic complexity on lizard species richness across various clades (Skeels et al., Reference Skeels, Esquerré and Cardillo2020). Environmental factors such as temperature and productivity also play significant roles in shaping lizard assemblages (Skeels et al., Reference Skeels, Esquerré and Cardillo2020). Ashman (Reference Ashman, Bragg, Doughty, Hutchinson, Bank, Matzke, Oliver and Moritz2018) found that rock-dwelling lizards in topographically complex areas tend to have smaller geographic ranges compared to widespread generalist species. While ecological opportunity can drive diversification, evidence suggests that environmental heterogeneity and refugial dynamics may be more important in elevating lineage diversity (Ashman et al., Reference Ashman, Bragg, Doughty, Hutchinson, Bank, Matzke, Oliver and Moritz2018). These studies collectively emphasize the complex interplay between topography, environmental factors, and ecological traits in determining lizard diversity patterns.
The Caatinga is a seasonally dry tropical forest typical of the semiarid region of northeastern Brazil, with average annual rainfall of 240–900 mm, occurring mostly over three months a year, but highly unpredictable (Santos et al., Reference Santos, Leal, Almeida-Cortez, Fernandes and Tabarelli2011). The Caatinga Region harbours several vegetation types, such as deciduous dry forests, highland rocky outcrops, Cerrado savannas, and humid enclaves (Araujo et al., Reference Araujo, Garda, Girão e Silva, Nascimento, Mariano and Silva2022). It is one of the most threatened biomes in Brazil, where deforestation and fragmentation induced by agriculture and firewood extraction are the main causes of landscape alteration (Antongiovanni et al., Reference Antongiovanni, Venticinque and Fonseca2018; Fonseca et al., Reference Fonseca, Antogiovanni, Matsumoto, Bernard, Venticinque, Da Silva, Leal and Tabarelli2017; Leal et al., Reference Leal, José Maria Cardoso da, Tabarelli and Lacher2005; Silva et al., Reference Silva, Barbosa, Leal, Tabarelli, Silva, Leal and Tabarelli2017). Despite this, the Caatinga vegetation presents a great variety of physiognomies throughout its distribution, which accounts for a high environmental heterogeneity (Araujo et al., Reference Araujo, Garda, Girão e Silva, Nascimento, Mariano and Silva2022; de Queiroz et al., Reference de Queiroz, Cardoso, Fernandes and Moro2017; Fernandes et al., Reference Fernandes, Cardoso, Pennington and de Queiroz2022). This fact, combined with diverse climatic conditions along its distribution, allows high vertebrate diversity and endemism (Fernandes and Queiroz, Reference Fernandes and Queiroz2018; Garda et al., Reference Garda, Lion, Lima, Mesquita, Araujo and Napoli2018).
Squamates are one of the most diverse tetrapod groups with some of the highest rates of endemism in the biome (Garda et al., Reference Garda, Lion, Lima, Mesquita, Araujo and Napoli2018; Guedes et al., Reference Guedes, Nogueira and Marques2014a; Uchôa et al., Reference Uchôa, Delfim, Mesquita, Colli, Garda and Guedes2022). The Caatinga lizard fauna is richer and more endemic than previously thought, with 93 species identified, 53% of which are endemic, mainly associated with unique habitats like paleoclimatic dunes (Mesquita et al., Reference Mesquita, Costa, Garda, Delfim, Silva, Leal and Tabarelli2017; Uchôa et al., Reference Uchôa, Delfim, Mesquita, Colli, Garda and Guedes2022). The highest species richness occurs in the biome’s marginal areas, while nuclear regions show lower diversity (Mesquita et al., Reference Mesquita, Costa, Garda, Delfim, Silva, Leal and Tabarelli2017). However, significant gaps in the knowledge of lizards within the Caatinga biome remain, as half of the area, or 70% of its municipalities, lacks lizard sampling (Uchôa et al., Reference Uchôa, Delfim, Mesquita, Colli, Garda and Guedes2022).
Climatic conditions have been implicated in the patterns of species richness in this environment for this group (de Oliveira and Diniz-Filho, Reference de Oliveira and Diniz-Filho2010), although this relationship has not been fully tested after the significant refinement of species distribution data recently published (Guedes et al., Reference Guedes, Nogueira and Marques2014a; Uchôa et al., Reference Uchôa, Delfim, Mesquita, Colli, Garda and Guedes2022). Environmental heterogeneity significantly influences lizard communities in seasonally dry forests like the Caatinga. More heterogeneous environments with diverse plant structures support higher lizard richness and abundance due to increased microhabitat availability (da Silva et al., Reference da Silva, Medeiros, Andrade Lima, de Sousa, Abrantes, de Lima, Leite and Kokubum2020). Factors such as canopy cover, temperature, understory density, and vegetation characteristics positively affect lizard occurrence (da Silva et al., Reference da Silva, Medeiros, Andrade Lima, de Sousa, Abrantes, de Lima, Leite and Kokubum2020).
Conversely, the main factors increasing extinction risks for Squamata worldwide are agriculture and the use of natural biological resources (like wood extraction, Bohm et al., Reference Bohm, Collen, Baillie, Bowles, Chanson, Cox, Hammerson, Hoffmann, Livingstone, Ram, Rhodin, Stuart, van Dijk, Young, Afuang, Aghasyan, Garcia, Aguilar, Ajtic, Akarsu, Alencar, Allison, Ananjeva, Anderson, Andren, Ariano-Sanchez, Arredondo, Auliya, Austin, Avci, Baker, Barreto-Lima, Barrio-Amoros, Basu, Bates, Batistella, Bauer, Bennett, Bohme, Broadley, Brown, Burgess, Captain, Carreira, Castaneda, Castro, Catenazzi, Cedeno-Vazquez, Chapple, Cheylan, Cisneros-Heredia, Cogalniceanu, Cogger, Corti, Costa, Couper, Courtney, Crnobrnja-Isailovic, Crochet, Crother, Cruz, Daltry, Daniels, Das, de Silva, Diesmos, Dirksen, Doan, Dodd, Doody, Dorcas, de Barros, Egan, El Mouden, Embert, Espinoza, Fallabrino, Feng, Feng, Fitzgerald, Flores-Villela, Franca, Frost, Gadsden, Gamble, Ganesh, Garcia, Garcia-Perez, Gatus, Gaulke, Geniez, Georges, Gerlach, Goldberg, Gonzalez, Gower, Grant, Greenbaum, Grieco, Guo, Hamilton, Hare, Hedges, Heideman, Hilton-Taylor, Hitchmough, Hollingsworth, Hutchinson, Ineich, Iverson, Jaksic, Jenkins, Joger, Jose, Kaska, Kaya, Keogh, Kohler, Kuchling, Kumlutas, Kwet, La Marca, Lamar, Lane, Lardner, Latta, Latta, Lau, Lavin, Lawson, LeBreton, Lehr, Limpus, Lipczynski, Lobo, Lopez-Luna, Luiselli, Lukoschek, Lundberg, Lymberakis, Macey, Magnusson, Mahler, Malhotra, Mariaux, Maritz, Marques, Marquez, Martins, Masterson, Mateo, Mathew, Mathews, Mayer, McCranie, Measey, Mendoza-Quijano, Menegon, Metrailler, Milton, Montgomery, Morato, Mott, Munoz-Alonso, Murphy, Nguyen, Nilson, Nogueira, Nunez, Orlov, Ota, Ottenwalder, Papenfuss, Pasachnik, Passos, Pauwels, Perez-Buitrago, Perez-Mellado, Pianka, Pleguezuelos, Pollock, Ponce-Campos, Powell, Pupin, Diaz, Radder, Ramer, Rasmussen, Raxworthy, Reynolds, Richman, Rico, Riservato, Rivas, da Rocha, Rodel, Schettino, Roosenburg, Ross, Sadek, Sanders, Santos-Barrera, Schleich, Schmidt, Schmitz, Sharifi, Shea, Shi, Shine, Sindaco, Slimani, Somaweera, Spawls, Stafford, Stuebing, Sweet, Sy, Temple, Tognelli, Tolley, Tolson, Tuniyev, Tuniyev, Uzum, van Buurt, Van Sluys, Velasco, Vences, Vesely, Vinke, Vinke, Vogel, Vogrin, Vogt, Wearn, Werner, Whiting, Wiewandt, Wilkinson, Wilson, Wren, Zamin, Zhou and Zug2013), which are also the main threats to Caatinga (Antongiovanni et al., Reference Antongiovanni, Venticinque, Matsumoto and Fonseca2020; Melo, Reference Melo, Silva, Leal and Tabarelli2017). Furthermore, habitat loss, combined with climate change, is among the main threats to biodiversity worldwide. The unique and extreme climatic conditions of the Caatinga, combined with its high biodiversity, make this ecosystem extremely vulnerable to climate change (de Oliveira et al., Reference de Oliveira, Araújo, Rangel, Alagador and Diniz-Filho2012; de Oliveira and Diniz-Filho, Reference de Oliveira and Diniz-Filho2010), like other desertic and xeric biomes (Li et al., Reference Li, Wu, Liu, Zhang and Li2018). Indeed, it has recently been considered the Brazilian biome most threatened by climate change (Maksic et al., Reference Maksic, Venancio, Shimizu, Chiessi, Piacsek, Sampaio, Cruz and Alexandre2022; Torres et al., Reference Torres, Lapola, Gamarra, Silva, Leal and Tabarelli2017).
This work aims to evaluate the influence of landscape and habitat variables on lizard assemblages in the Caatinga. We specifically address the following questions: (i) Do microhabitat variables influence parameters of richness and diversity of lizard species in the Caatinga? (ii) Will changes in the Caatinga landscape, in its vast majority inherent to human actions (Melo, Reference Melo, Silva, Leal and Tabarelli2017), negatively affect these same parameters for lizards? As these changes have been shown to be the main causes of biodiversity loss in this group (Bohm et al., Reference Bohm, Collen, Baillie, Bowles, Chanson, Cox, Hammerson, Hoffmann, Livingstone, Ram, Rhodin, Stuart, van Dijk, Young, Afuang, Aghasyan, Garcia, Aguilar, Ajtic, Akarsu, Alencar, Allison, Ananjeva, Anderson, Andren, Ariano-Sanchez, Arredondo, Auliya, Austin, Avci, Baker, Barreto-Lima, Barrio-Amoros, Basu, Bates, Batistella, Bauer, Bennett, Bohme, Broadley, Brown, Burgess, Captain, Carreira, Castaneda, Castro, Catenazzi, Cedeno-Vazquez, Chapple, Cheylan, Cisneros-Heredia, Cogalniceanu, Cogger, Corti, Costa, Couper, Courtney, Crnobrnja-Isailovic, Crochet, Crother, Cruz, Daltry, Daniels, Das, de Silva, Diesmos, Dirksen, Doan, Dodd, Doody, Dorcas, de Barros, Egan, El Mouden, Embert, Espinoza, Fallabrino, Feng, Feng, Fitzgerald, Flores-Villela, Franca, Frost, Gadsden, Gamble, Ganesh, Garcia, Garcia-Perez, Gatus, Gaulke, Geniez, Georges, Gerlach, Goldberg, Gonzalez, Gower, Grant, Greenbaum, Grieco, Guo, Hamilton, Hare, Hedges, Heideman, Hilton-Taylor, Hitchmough, Hollingsworth, Hutchinson, Ineich, Iverson, Jaksic, Jenkins, Joger, Jose, Kaska, Kaya, Keogh, Kohler, Kuchling, Kumlutas, Kwet, La Marca, Lamar, Lane, Lardner, Latta, Latta, Lau, Lavin, Lawson, LeBreton, Lehr, Limpus, Lipczynski, Lobo, Lopez-Luna, Luiselli, Lukoschek, Lundberg, Lymberakis, Macey, Magnusson, Mahler, Malhotra, Mariaux, Maritz, Marques, Marquez, Martins, Masterson, Mateo, Mathew, Mathews, Mayer, McCranie, Measey, Mendoza-Quijano, Menegon, Metrailler, Milton, Montgomery, Morato, Mott, Munoz-Alonso, Murphy, Nguyen, Nilson, Nogueira, Nunez, Orlov, Ota, Ottenwalder, Papenfuss, Pasachnik, Passos, Pauwels, Perez-Buitrago, Perez-Mellado, Pianka, Pleguezuelos, Pollock, Ponce-Campos, Powell, Pupin, Diaz, Radder, Ramer, Rasmussen, Raxworthy, Reynolds, Richman, Rico, Riservato, Rivas, da Rocha, Rodel, Schettino, Roosenburg, Ross, Sadek, Sanders, Santos-Barrera, Schleich, Schmidt, Schmitz, Sharifi, Shea, Shi, Shine, Sindaco, Slimani, Somaweera, Spawls, Stafford, Stuebing, Sweet, Sy, Temple, Tognelli, Tolley, Tolson, Tuniyev, Tuniyev, Uzum, van Buurt, Van Sluys, Velasco, Vences, Vesely, Vinke, Vinke, Vogel, Vogrin, Vogt, Wearn, Werner, Whiting, Wiewandt, Wilkinson, Wilson, Wren, Zamin, Zhou and Zug2013), we expect to contrast its relative importance with microhabitat aspects.
Materials and methods
Study area
The work was conducted between April and August 2014 in seven Caatinga areas located in the state of Rio Grande do Norte, in northeastern Brazil, which were on average 57 km apart (Figure 1).
Transects distributed in the seven sampling areas in Rio Grande do Norte state, in relation to (A) altitude and (B) Caatinga remnants and its ecoregions: (1) Cerro Corá, (2) Lajes, (3) Caiçara do Norte, (4) Santana do Matos, (5) Serrinha dos Pintos, (6) Martins, and (7) Felipe Guerra.
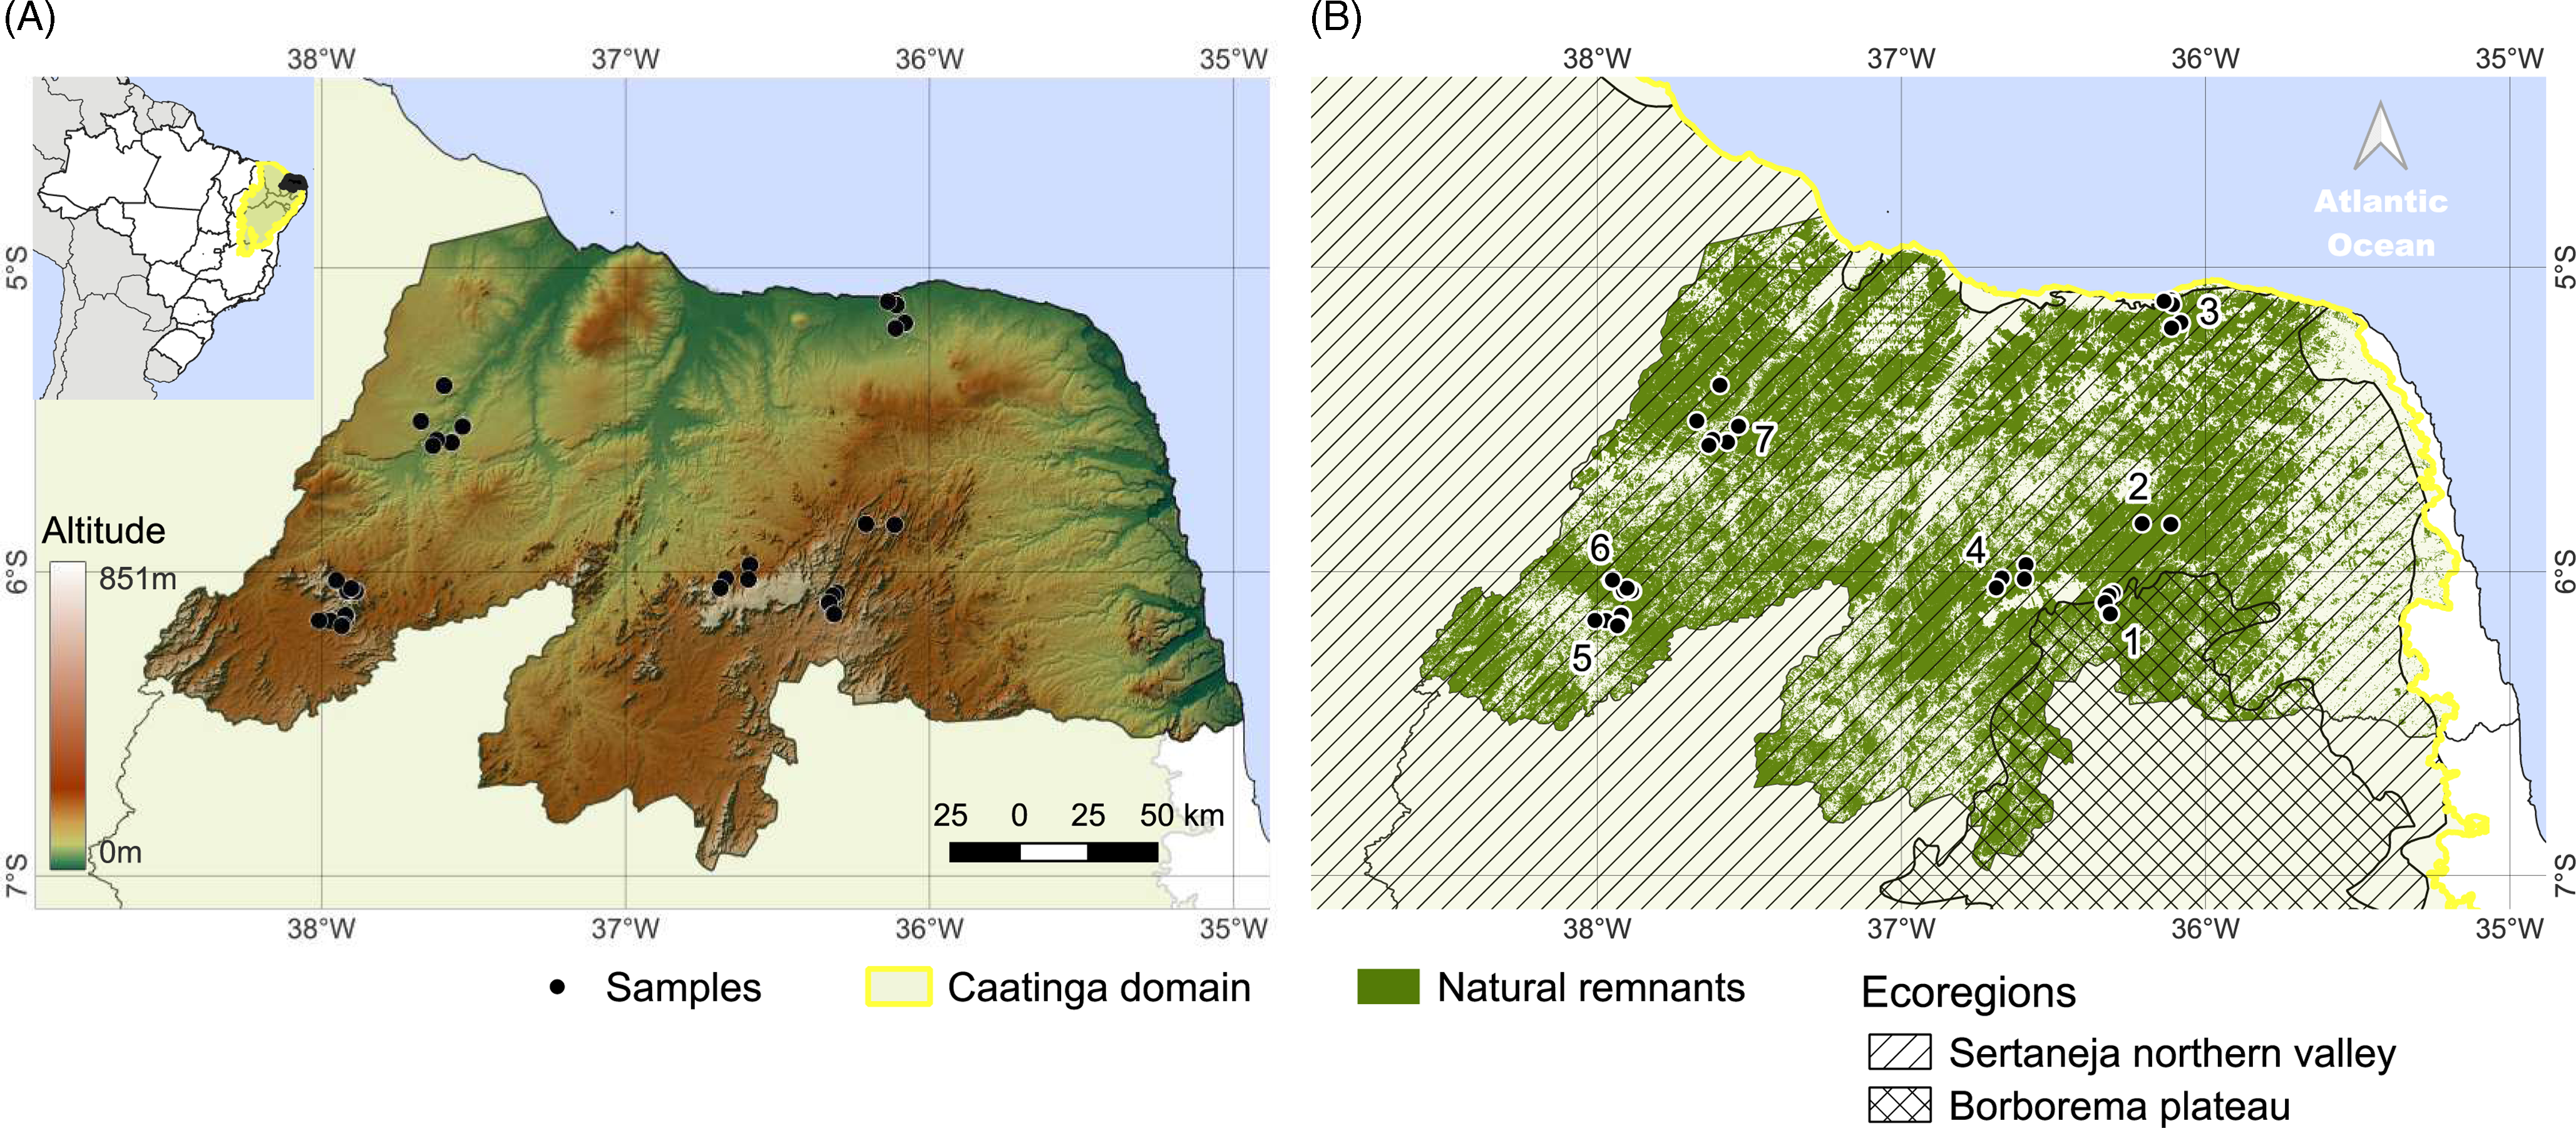
These areas show short, unpredictable periods of rainfall and great dry periods (Prado, Reference Prado, Leal, Tabarelli and Silva2003). Geomorphologically, it presents shallow and stony soils, with many rocky outcrops and peculiar reliefs with interplanaltic regions (Ab’Saber, Reference Ab’Saber1977), as well as peaks of altitudes varying between 500 and 800 m in Northern Sertaneja Depression ecoregion and 150 and 850 m on the Borborema Plateau, northeastern portion of the Caatinga biome (Figure 1) (Velloso et al., Reference Velloso, Sampaio and Pareyn2002).
Sampling
The sampling was based on visual encounter surveys (Crump and Scott, Reference Crump, Scott, Heyer, Donnelly, McDiarmid, Hayek and Foster1994). We used 150-metre-long transects, which were each standardly surveyed for one hour. Each transect was at least 200 m apart to avoid possible false replication of the same individual. In each of the seven sampled areas, between two and nine transects were randomly distributed, totalling 46 transects. This methodology is already widely used in research on herpetofauna in tropical rainforests (Amazon rainforest) and has been shown to be more efficient than other traditional methods, such as pitfalls and funnel traps, for certain species (Doan, Reference Doan2003; Rödel and Ernst, Reference Rödel and Ernst2004). However, for seasonally dry forests, such as the Caatinga, this method has not yet been used. Species were recorded when observed on the trail or at a distance up to 15 m perpendicular to the transect line for both sides and within the standardized period.
Samplings were conducted in the period between 07:00 and 13:00 hours, always through two transects per day. Individuals were not collected, only recorded when observed. On each transect, at the end of the one-hour observation period, active searches were made with a rake along three 3 × 4 m plots, which were located every 50 m on the trail. This complementary method was carried out to increase the chances of identifying fossorial and semi-fossorial habit species and leaf litter specialists.
Predictor variables
We characterized landscape structure of each area in ArcGIS® using the Caatinga databases available (MMA, 2011), measuring the following three variables: (1) percentage of Caatinga, corresponding vegetation cover in a 1000 m radius buffer around the transect starting point; we also characterized landscape structure in terms of topographic elements in each of the seven areas; (2) altitude, corresponding to elevation, in metres, of the transect point obtained from the Shuttle Radar Data Topographic Mission of 90 m and 1 m horizontal and vertical resolutions, respectively; and (3) topographic complexity, measured as the standard deviation of the altitude of pixels present in a 1000 m radius buffer around the transect starting point (raw data for the landscape predictors are presented in Supplemental Table S1).
Furthermore, for each transect, we characterized microhabitat using six variables: (1) amount of leaf litter (cm), measured as litter depth at five sampling points within a 0.5 × 0.5 m quadrat every 50 m along the trail; (2) number of fallen logs, as the number of logs (>5 cm diameter) on the ground along the transect up to 5 m on each side of the transect; (3) number of burrows, up to 5 m on each side of the transect; (4) number of rocks, as the number of rock outcrops distant up to 10 m on each side of the transect. For this variable, as there were transects on top of large limestone outcrops, where ground is just rock, a ranking of classes was created, ranging from 0 to 4, as follows: 0 – no rock, 1 – little rock (less than two outcrops counted), 2 – intermediate (between three and four outcrops counted), 3 – a lot of rock (more than five outcrops counted), and 4 – ‘lajedo’ (above eight outcrops, the maximum number before considering the area a ‘lajedo’); (5) plant density, as the number of trees with DAS (diameter at soil height) ≥ 5cm within a 10 × 20 m plot; and finally, (6) herbaceous plant cover, consisting on a visual estimate of the percentage of vegetation cover at ground level in a plot of 10 × 20 m, varying at intervals of 10%. Such variables were listed for their biological importance for reptiles for being essential for thermoregulation, reproduction, and as a refuge from predators, for example. Mean and standard deviation values from predictors used in representing each sampled area are in Supplemental Table 3. Before the analyses, all variables were transformed into Z scores, thus eliminating any statistical bias related to differences between their measurement units.
Statistical analyses
Species richness and diversity
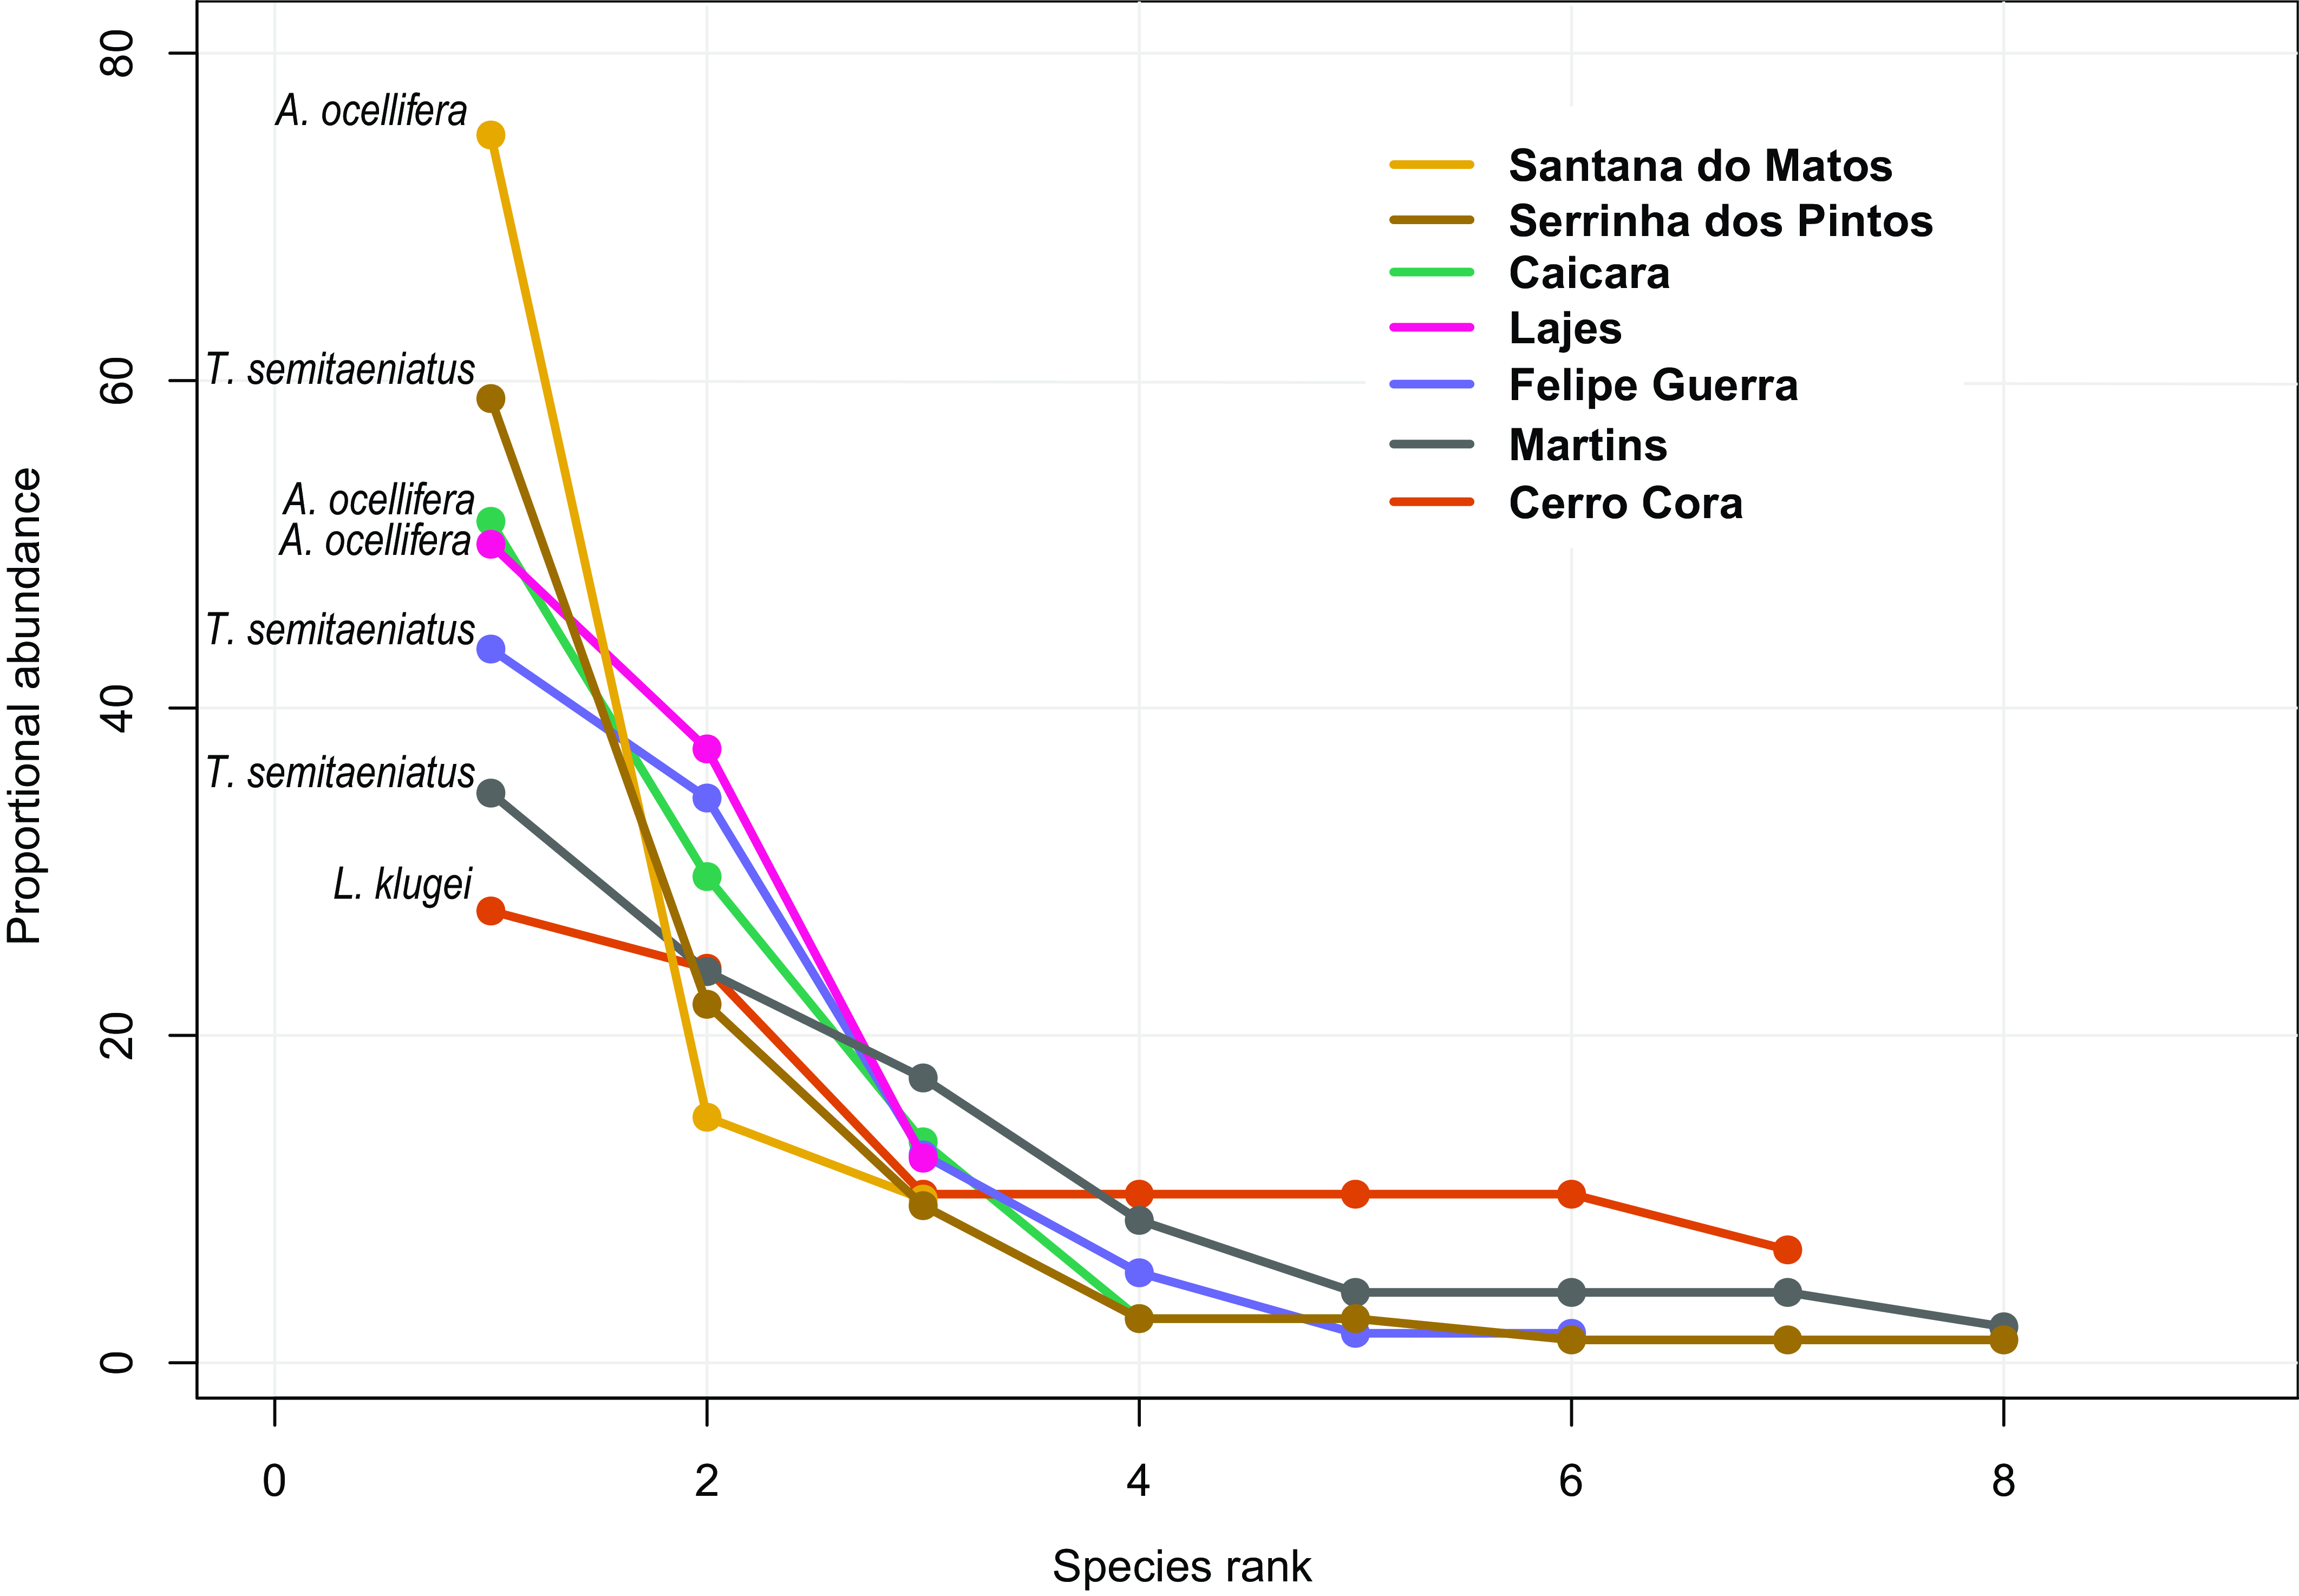
We constructed rank abundance curves to represent the proportional abundance of species in each area (Figure 2). We used the ‘BiodiversityR’ R package (Kindt and Coe, Reference Kindt and Coe2005). Rank abundance curves also help clarify community structure in sampled areas.
Rank abundance curves for lizards sampled in the seven areas. Abundances are proportional abundances (species abundance/total area abundance). We present species names from the most abundant species (rank 1) in each area.
To test the influence of the three landscape predictors (percentage of Caatinga, landscape complexity, and mean altitude) and the six microhabitat predictors (amount of leaf litter, number of fallen logs, number of burrows, number of rocks, plant density, and herbaceous plant cover) on lizard richness and diversity, we used multiple linear regressions. For richness, the logarithm with base 10 of species richness plus one for each transect was considered the dependent variable. To contrast predictors’ relative strength, we standardized them (Z scores), using the R base function ‘scale’. For species diversity, we used Hill numbers order q = 1, which corresponds to the exponential of Shannon’s entropy index (Jost, Reference Jost2006) as the dependent variable. We used the function ‘hill_taxa’ in the R package ‘hillR’ to estimate Hill numbers (Li, Reference Li2018).
Two of the 46 transects were extreme outliers in terms of the percentage of remaining Caatinga. Therefore, we remove these transects from multiple linear models predicting species richness, diversity, and species probability of occurrence. We then checked correlations between predictor variables using a Pearson correlation matrix in the corrplot R library (Wei and Simko, Reference Wei and Simko2021). The highest correlation was between topographic complexity (named as Rugosity in models) and altitude (rPearson = 0.67), followed by number of trees and altitude (rPearson = 0.40). All other predictors had low correlation coefficients (Supplemental Figure S1).
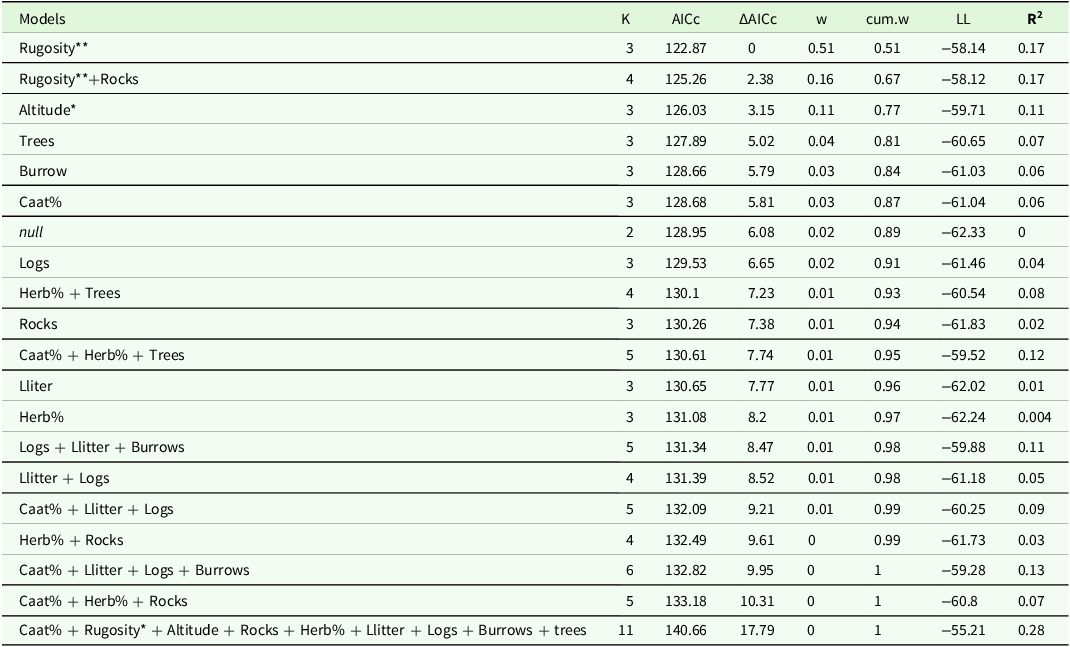
Then, we defined all models a priori, according to their importance for the species’ biology and, therefore, representing biological hypotheses. In total, 19 models were built to predict separately species richness and diversity (Tables 1 and 2): simple models, composed of only one variable, and multiple models, with two or more variables combined, and a null model with no variable. We ranked models using the second-order Akaike information criterion (AICc), which favours more parsimonious models through maximum likelihood penalized by the number of variables used in the model’s composition (Burnham and Anderson, Reference Burnham and Anderson2002). Models were also ranked by ΔAICc (the difference between AICc of the best model and other models) and wAICc, which represents the proportional weight of each model, that is, how representative the contribution of a model is. These values were used to identify and select models that contributed the most to explain lizard species richness, with those with ΔAICc less than or equal to two (ΔAICc ≤ 2) considered substantially supported. We used the ‘AICcmodavg’ R package to perform this model selection (Mazerolle, Reference Mazerolle2023).
Candidate models constructed according to biological importance for species richness in the multiple linear regression. Models are ordered by Akaike weights. Acronyms stands for: K – number of parameters in the model; AICc – second-order Akaike criterion; ΔAICc – difference between the lowest and the other values of the Akaike; w and cum.w – are, respectively, Akaike model weight and cumulative weight; LL – model log-likelihood. Predictors were: Rugosity – topographic complexity, measured as the standard deviation of the altitude of pixels present in a 1000 m radius buffer around the transect starting point; Altitude – elevation, in metres; Caat% – percentage of Caatinga, corresponding vegetation cover in a 1000 m radius buffer around the transect starting point; Lliter – amount of leaf litter (cm); Logs – number of fallen logs; Burrows – number of burrows; Rocks – the number of rocky outcrops; Trees – plant density, as the number of trees; Herb% – herbaceous plant cover
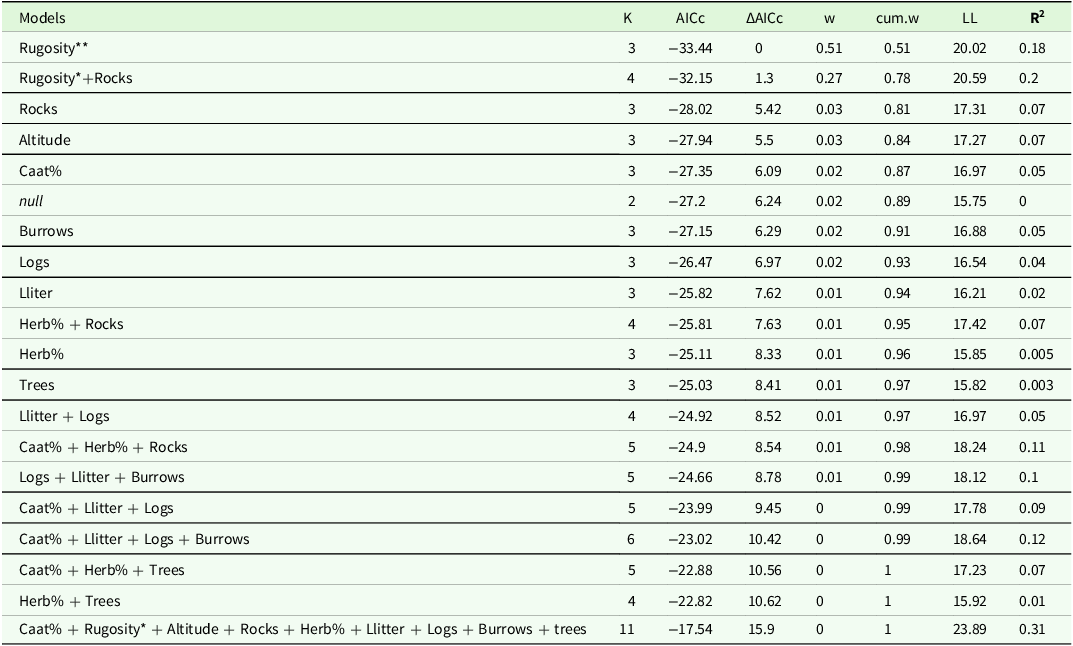
** 0.001< P <0.01; *0.01< P <0.05.
Candidate models constructed according to biological importance for species diversity, measured as Hill numbers order q = 1, in the multiple linear regressions. Models are ordered by Akaike weights. Acronyms are the same as in Table 1
** 0.001< P <0.01; *0.01< P <0.05.
Probability of occurrence
To test the influence of landscape structure and microhabitat variables on each species occurrence, we used logistic regressions. In this approach, we considered only the seven species that occurred in five or more of the 44 sampled transects. We first constructed a global model including all three landscape predictors and all six microhabitat predictors. We then considered all possible combinations of predictor variables (512 models) to account for potential species-specific responses. Subsequently, we generated the averaged model considering the accepted models (ΔAICc ≤ 2), using the MuMIn R package (Barton, Reference Barton2024). To evaluate predictors’ relative influence on species occurrences, we contrasted predictors’ coefficients and adjusted errors and their relative importance (normalized sum of Akaike weights in accepted models). Residuals from all linear models (predicting species richness, diversity, and probability of occurrence) were checked for normality and homoscedasticity using the ‘DHARMa’ R package (Hartig, Reference Hartig2022). We also confirmed the absence of spatial autocorrelation in all accepted models’ residuals using the function ‘Moran.I’ from the ‘ape’ R package (Paradis and Schliep, Reference Paradis and Schliep2019).
Results
We recorded 271 individuals belonging to 10 species of lizards (Supplemental Table S2) over a period of three months of fieldwork: 259 sighted along transects and 12 during active searches. The most abundant species were Tropidurus semitaeniatus with 86 individuals, followed by Ameivula ocellifera with 70 and Tropidurus hispidus with 49 individuals. We covered 6,900 m of Caatinga in 46 hours of observations on trails and 690 minutes of active searches in 27,600 m2 of Caatinga.
Species proportional abundances
Tropidurus semitaeniatus was the most abundant species in Serrinha dos Pintos, Felipe Guerra, and Martins, while Ameivula ocellifera was the most abundant in Santana dos Matos, Caiçara, and Lajes (Figure 2). Lygodactylus klugei was the most abundant species in Cerro Cora. This area presented greater evenness in species abundances when compared with the other sampled locations.
Species richness and diversity
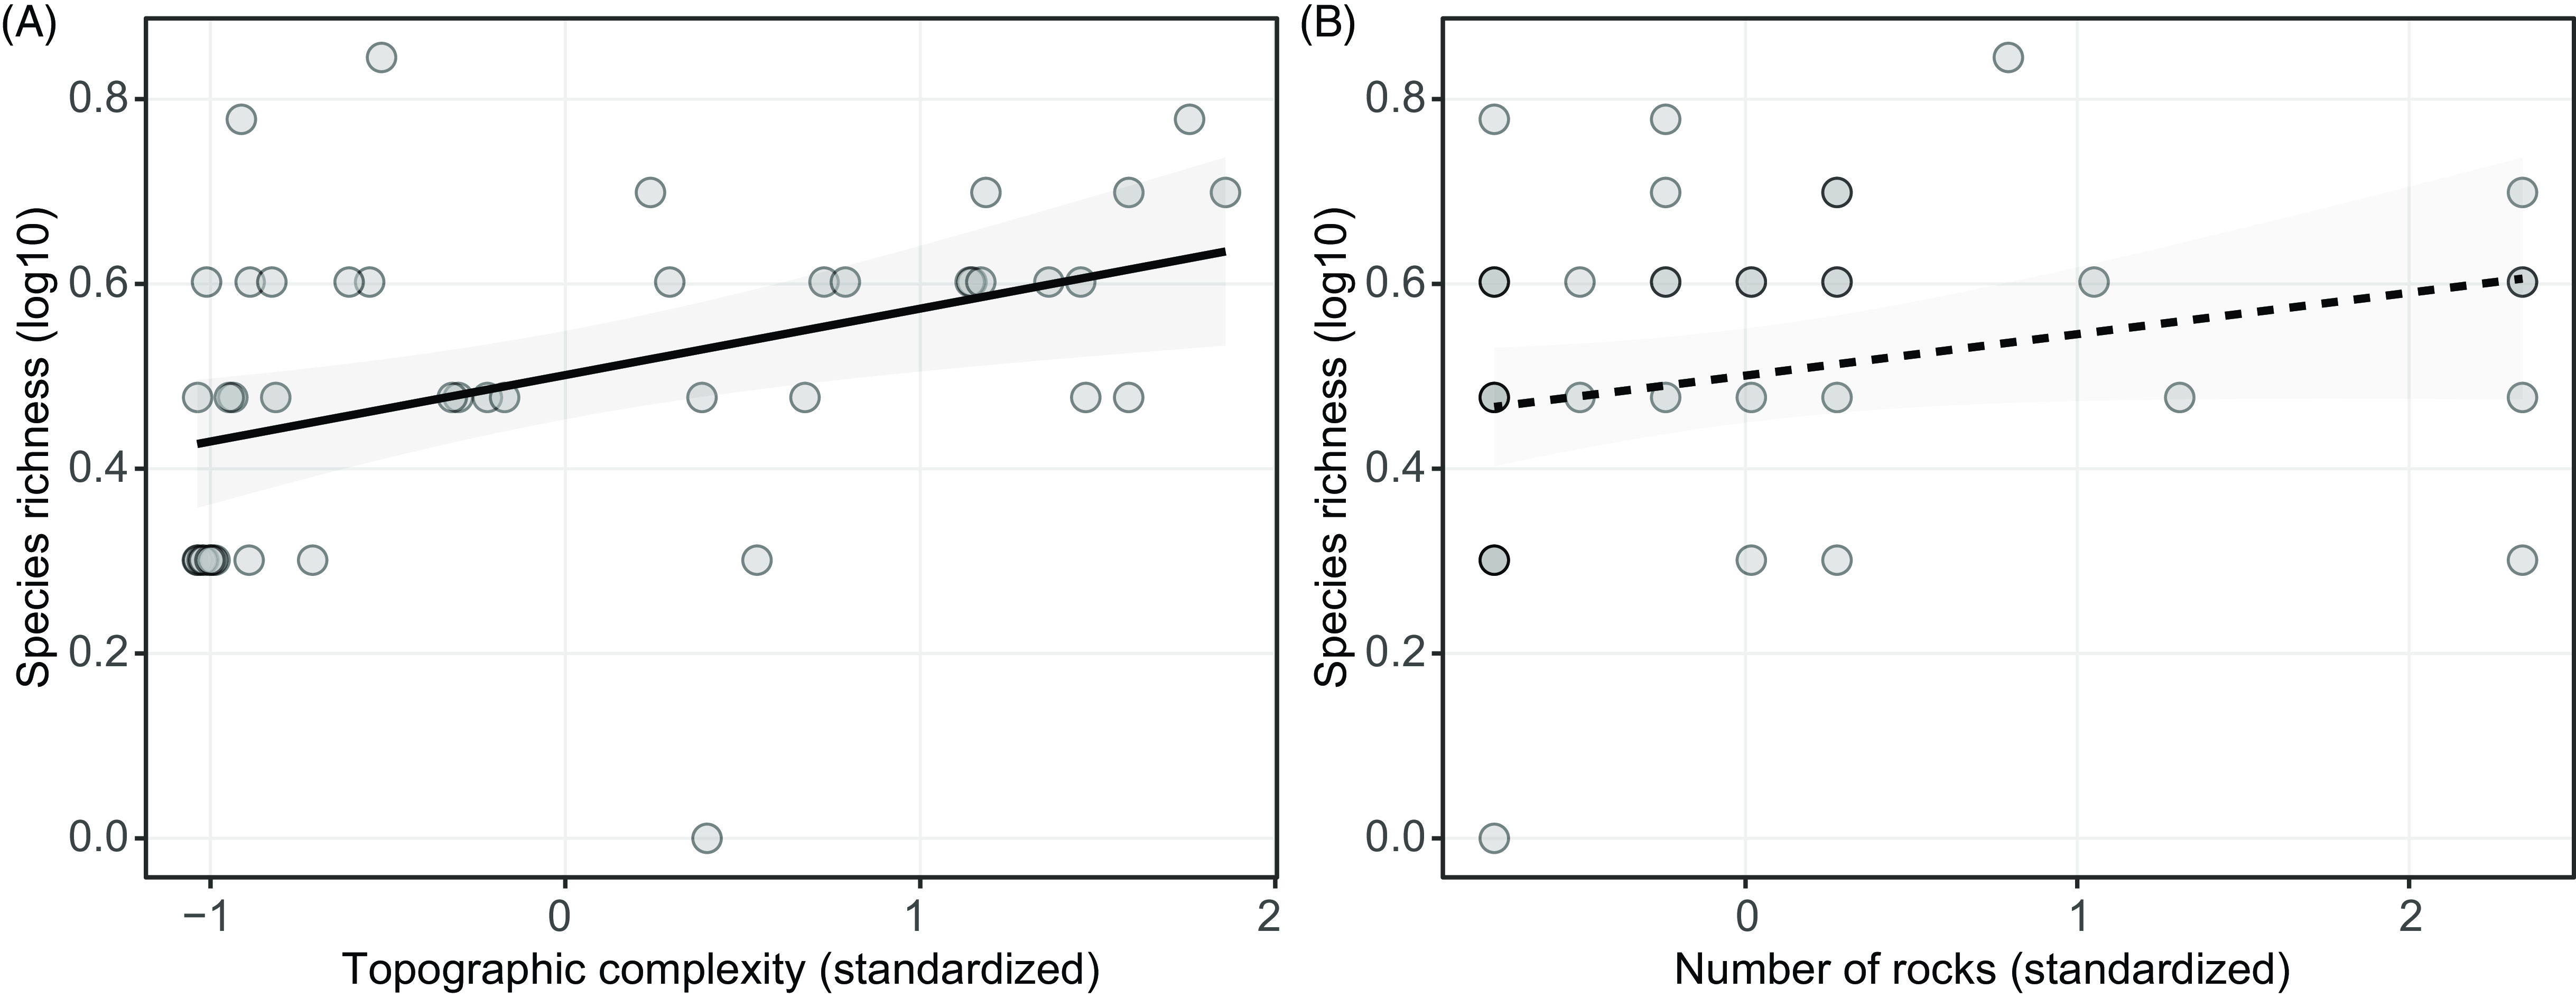
Among the 19 models constructed to predict richness, two presented ΔAICc values lower than two (Table 1; Figure 3), demonstrating substantial support to explain richness variation between transects. The first model contained a single variable, topographic complexity. The second accepted model contained topographic complexity plus the number of rocks. Together, these models accounted for 78% of the cumulative Akaike weight: topographic complexity (wAICc = 0.51) and topographic complexity plus number of rocks (wAICc = 0.27). Both predictors had positive coefficients (Figure 3), which indicates that lizard species richness was higher with increasing topographic complexity (coefficient = 0.072 ± 0.024; P = 0.004; R2 = 0.18) and with the number of rocky outcrops present in the habitat (coefficient = 0. 045 ± 0.025; P = 0.086; R2 = 0.07).
Relationship between species richness and (A) topographic complexity, measured in a buffer of 1 km surrounding each transect (coefficient = 0.072 ± 0.024; P = 0.004; R2 = 0.18), and (B) with the number of rocky outcrops present in the local habitat (simple model: coefficient = 0.045 ± 0.025; P = 0.086; R2 = 0.07). The dashed line represents a marginally significant coefficient.
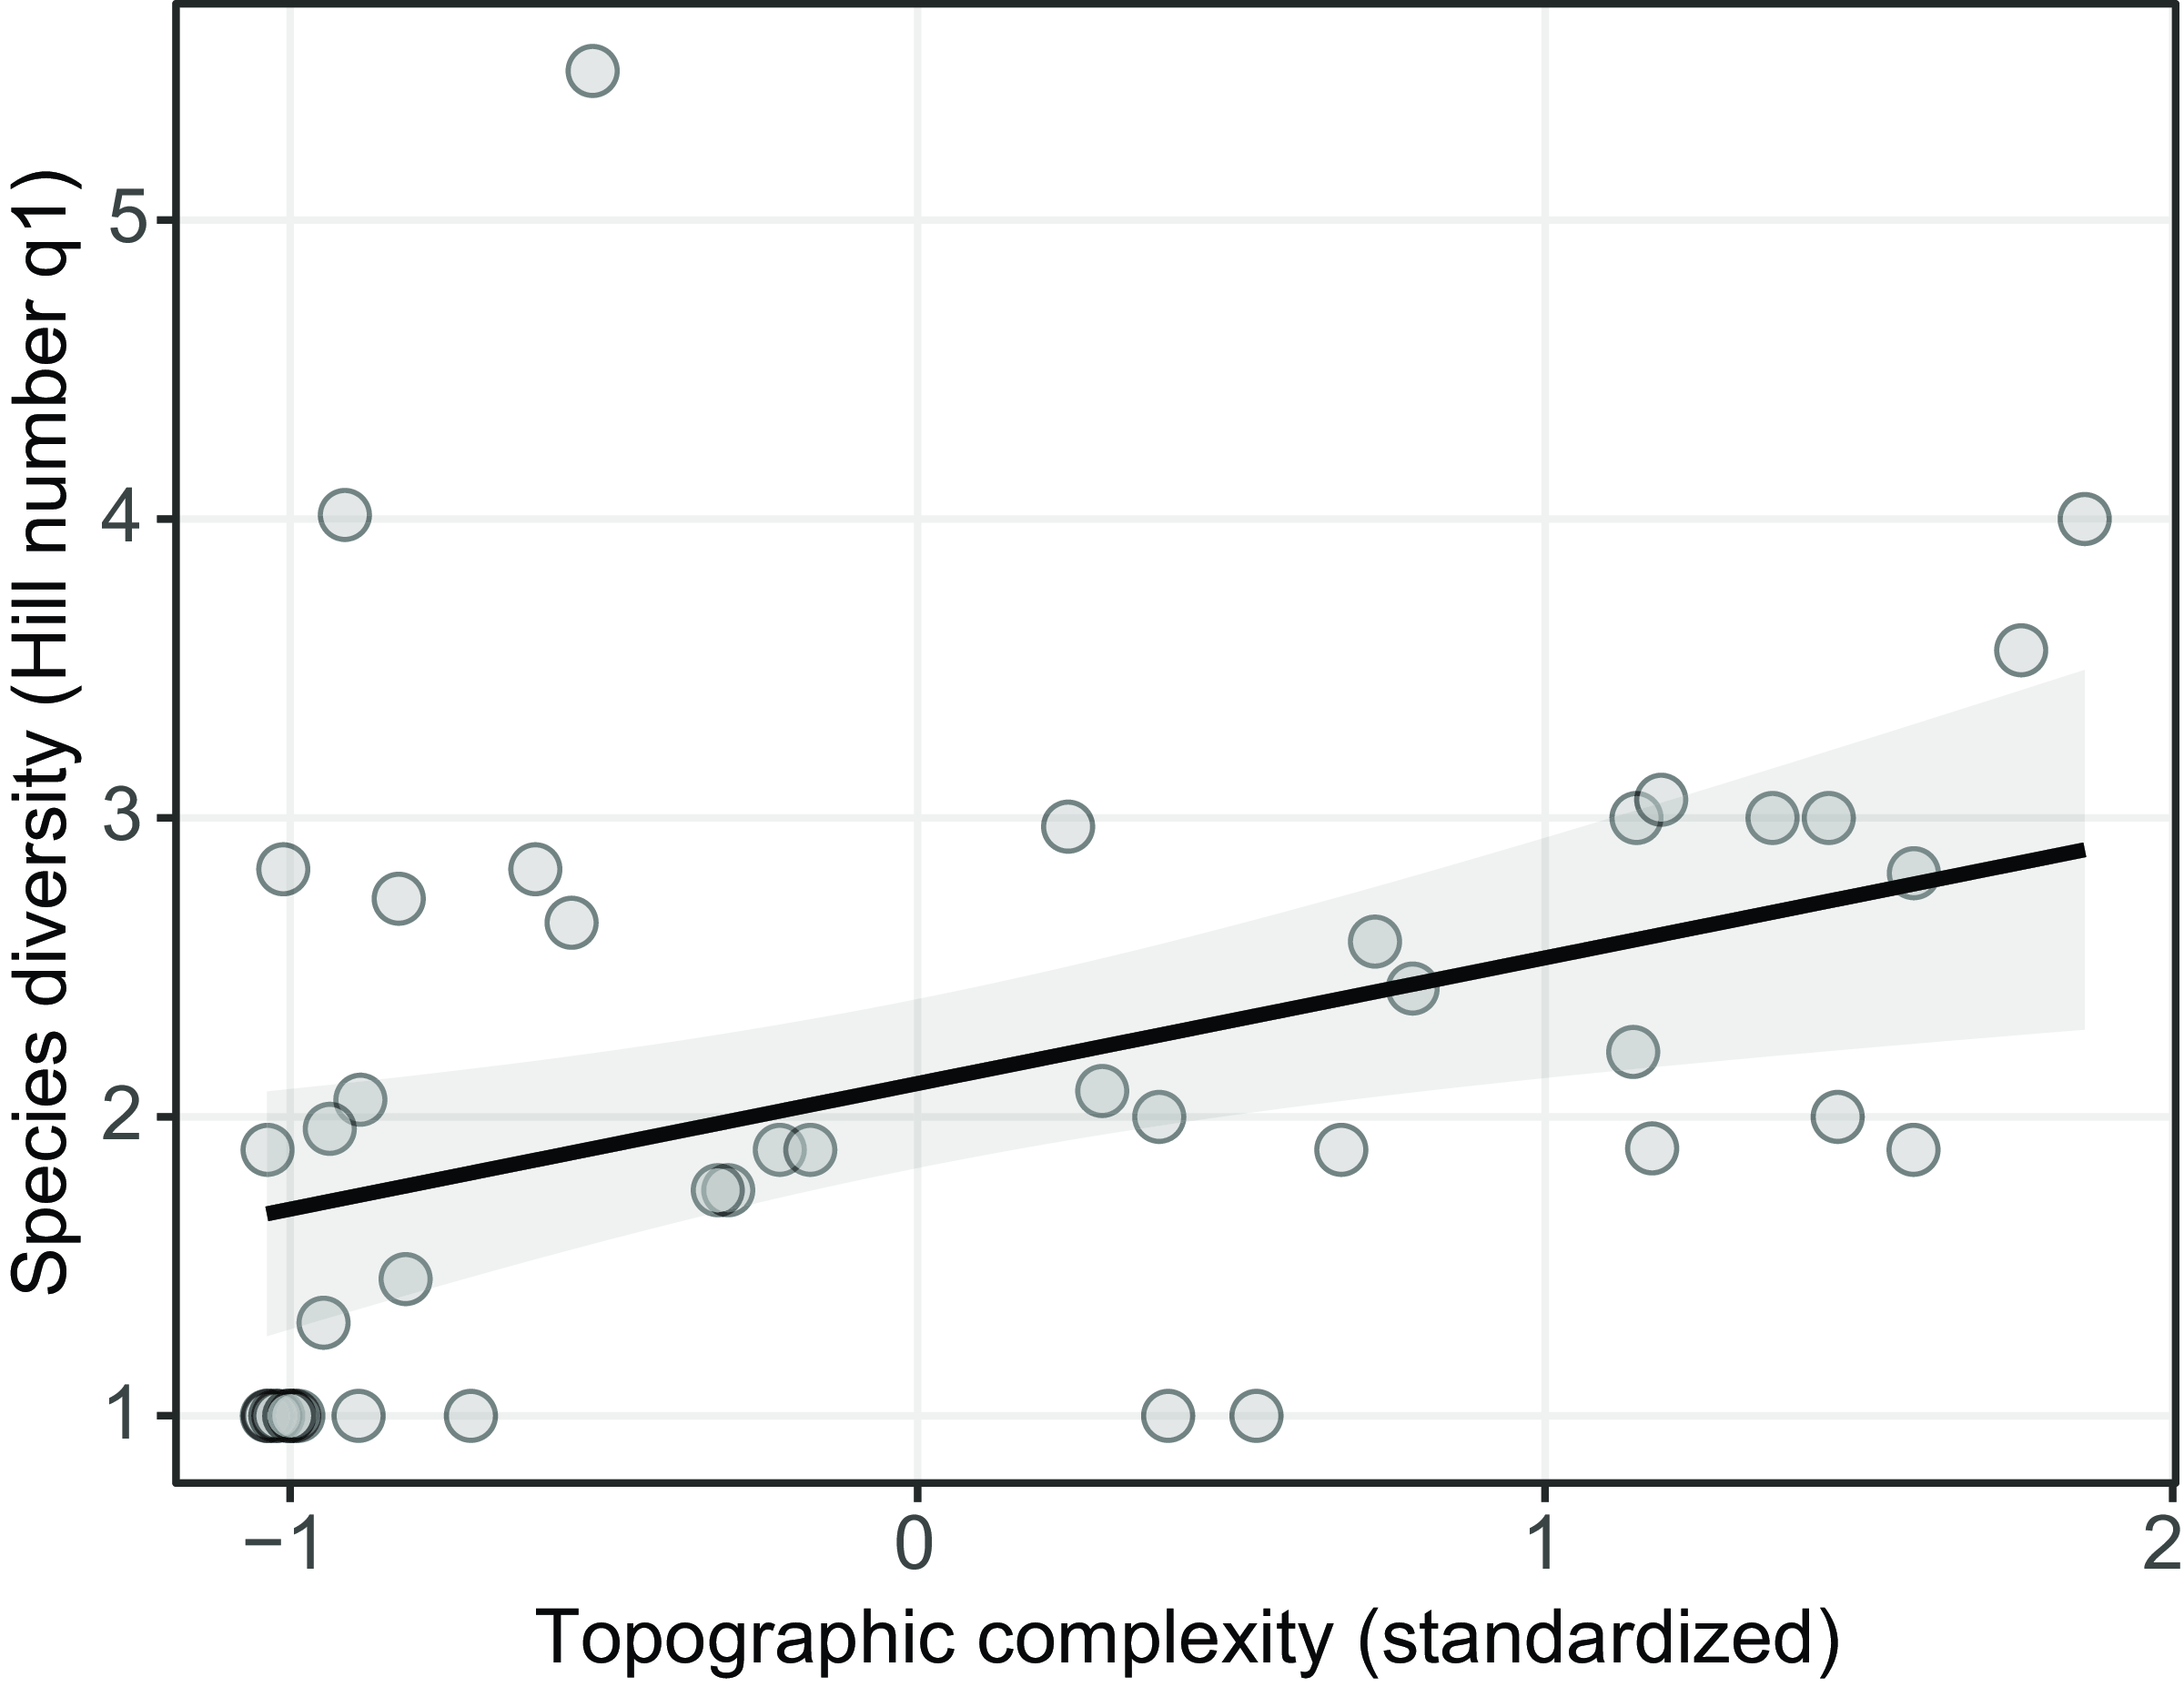
Only one model was selected to predict species diversity (Table 2; Figure 4). This model contained just topographic complexity as predictor, which was positively related to species diversity (coefficient = 0.420 ± 0.142; P = 0.005; R2 = 0.17) and accounted for 51% of the Akaike weight (Table 2).
Relationship between species diversity and topographic complexity, measured in a buffer of 1 km surrounding each transect (coefficient = 0.420 ± 0.142; P = 0.005; R2 = 0.17).
Probability of occurrence
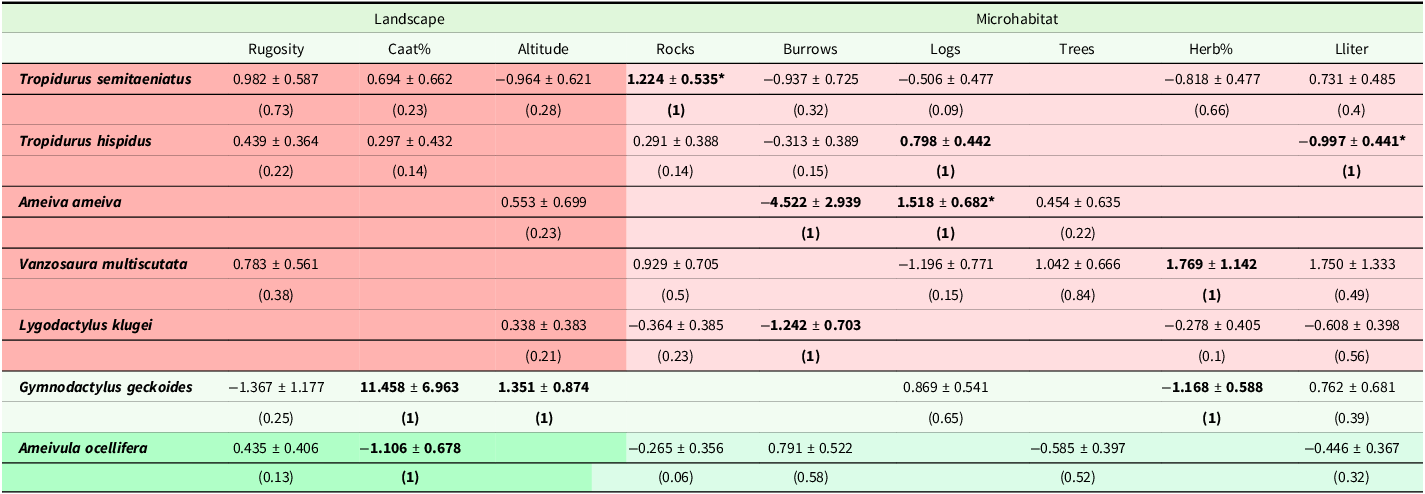
As anticipated, various predictors exerted influence on species occurrences (refer to Table 3 for details). Among the seven species under consideration, microhabitat variables emerged as primary influencers for five species, as indicated by highlighting in orange within Table 3. Conversely, one species, Ameivula ocellifera, had a landscape predictor as a main factor influencing its occurrence (green in Table 3). While for another species, Gymnodactylus geckoides, both landscape and microhabitat variables were important predictors.
Averaged models explaining species occurrences. Only species with five or more occurrences were modelled. Numbers correspond to the predictor’s coefficients ± adjusted standard errors. The numbers in parentheses are the relative importance of the corresponding predictor (normalized variable sum of weights in selected models). Predictors of maximum importance (value of one) are shown in bold. Predictors were: Rugosity – topographic complexity, measured as the standard deviation of the altitude of pixels present in a 1000 m radius buffer around the transect starting point; Altitude – elevation, in metres; Caat% – percentage of Caatinga, corresponding vegetation cover in a 1000 m radius buffer around the transect starting point; Llitter – amount of leaf litter (cm); Logs – number of fallen logs; Burrows – number of burrows; Rocks – the number of rocky outcrops; Trees – plant density, as the number of trees; Herb% – herbaceous plant cover. Species for which microhabitat variables were more influential are highlighted in orange, whereas those for which landscape variables played a more significant role are highlighted in green
* P < 0.05.
For Tropidurus semitaeniatus, the most important predictor was the number of rocky outcrops at the transects: the more rocks, the higher the probability of this species occurrence. For Tropidurus hispidus, the amount of fallen logs and leaf litter appeared in all models selected: while the former positively influenced species occurrences, the latter was the opposite. The number of burrows and fallen logs both had maximum importance in explaining Ameiva ameiva occurrences. While the number of logs increased the probability of species occurrence, the number of burrows decreased it. The percentage of herbaceous plant cover was positively related to Vanzosaura multiscutata occurrences, while Lygodactylus klugei occurrences were negatively related to the number of burrows in transects. For Gymnodactylus geckoides, landscape and microhabitat predictors both appeared in all selected models and had maximum importance: Caatinga percentage and altitude were positively related to species occurrences, while local herbaceous cover percentage was negatively related to it. Lastly, for Ameivula ocellifera, in contrast, a single landscape variable was the most important one: the percentage of Caatinga was negatively related to this species occurrence.
Discussion
Topographic complexity and rocky outcrops positively affected species richness, supporting our initial hypothesis that variables at both local and landscape levels would influence species richness in lizard communities. These variables were included when constructing our models because they were considered proxies of refuges for species. Indeed, they significantly contribute to environmental heterogeneity, given that topographic complexity and biodiversity are intimately correlated (Badgley et al., Reference Badgley, Smiley, Terry, Davis, DeSantis, Fox, Hopkins, Jezkova, Matocq, Matzke, McGuire, Mulch, Riddle, Roth, Samuels, Strömberg and Yanites2017). In the Caatinga, this pattern is clear for plant diversity, which is correlated with topographic characteristics such as slope and elevation (Silva and Souza, Reference Silva and Souza2018). These characteristics influence phytophysiognomic diversity by modifying environmental conditions and allowing several plant species that have their own environmental preferences (Fernandes et al., Reference Fernandes, Cardoso, Pennington and de Queiroz2022; Silva and Souza, Reference Silva and Souza2018). Likewise, high altitude areas have been implicated in high species richness of amphibians (Camardelli and Napoli, Reference Camardelli and Napoli2012; Garda et al., Reference Garda, Stein, Machado, Lion, Juncá, Napoli, Da Silva, Leal and Tabarelli2017), lizards (Uchôa et al., Reference Uchôa, Delfim, Mesquita, Colli, Garda and Guedes2022), snakes (Guedes et al., Reference Guedes, Sawaya and Nogueira2014b), and birds (Davies et al., Reference Davies, Orme, Storch, Olson, Thomas, Ross, Ding, Rasmussen, Bennett, Owens, Blackburn and Gaston2007; Rahbek and Graves, Reference Rahbek and Graves2001).
It is important to notice that topographic complexity was a stronger variable associated with species richness than rocky outcrops: the model containing only the first variable has around double the Akaike weight compared to the second model containing both variables (0.51 and 0.27, respectively). High topographic complexity possibly offers micro-refugia during periods of climatic fluctuation reducing extinction risks and may also increase speciation (Badgley et al., Reference Badgley, Smiley, Terry, Davis, DeSantis, Fox, Hopkins, Jezkova, Matocq, Matzke, McGuire, Mulch, Riddle, Roth, Samuels, Strömberg and Yanites2017). Moreover, local rupicolous conditions are more likely to be present if topographic complexity is high, while the positive relationship between rocky outcrops and species richness is well reported in the literature (Croak et al., Reference Croak, Pike, Webb and Shine2008; Michael et al., Reference Michael, Cunningham and Lindenmayer2008). At the microhabitat scale, the presence of rocky outcrops provides shelter and thermoregulation sites, and even small outcrops can also contribute to local habitat heterogeneity (Croak et al., Reference Croak, Pike, Webb and Shine2008).
The higher richness in topographically complex environments with more rocky outcrops can also be influenced by their lower susceptibility to land use conversion (Nogués-Bravo et al., Reference Nogués-Bravo, Araújo, Romdal and Rahbek2008). In the Caatinga, a higher rate of conversion and land use in topographically less complex areas (low and flat) and with less stony soils leads to natural communities with impoverished diversity (Silva and Barbosa, Reference Silva, Barbosa, Silva, Leal and Tabarelli2017). These relationships have been documented in several mountainous regions of the world (Qian, Reference Qian2010) and also reported as threats to biodiversity through the loss of natural forests of these regions for agriculture (Yamaura et al., Reference Yamaura, Amano, Kusumoto, Nagata and Okabe2011). Although we did not measure different land uses, topographically more complex areas are more costly for crop cultivation and conversion to agriculture (Yamaura et al., Reference Yamaura, Amano, Kusumoto, Nagata and Okabe2011) and are usually the last option for such purposes. This trend has been reported for Caatinga species diversity (Silva et al., Reference Silva, Lopes, Lopez, Melo and Trovão2014; Silva and Barbosa, Reference Silva, Barbosa, Silva, Leal and Tabarelli2017), where better environmental conditions in higher altitudes, along with a lower susceptibility to agropastoral activities, allow greater species richness. In this way, these regions guarantee better quality habitats for species; besides the intrinsic heterogeneity these environments provide, they are usually less converted to human use.
Species diversity, encompassing variation in species richness and evenness, was primarily influenced by topographic complexity. Our findings align with recent global analyses demonstrating a positive effect of topographic complexity on lizard diversity across various clades (Skeels et al., Reference Skeels, Esquerré and Cardillo2020). Similarly, topographic variables have been shown to play a key role in explaining reptile occupancy in hilly landscapes in Australia (Michael et al., Reference Michael, Ikin, Crane, Okada and Lindenmayer2017). Notably, although the model containing only altitude was not selected under the Akaike information criterion, it exhibited a significant positive coefficient. As discussed, topography can influence local factors such as microhabitat heterogeneity, the availability of rock outcrops, and deforestation patterns while also affecting temperature. Higher altitudes typically experience milder temperatures, and in hot and dry regions like the Caatinga, the temperature reduction with altitude may provide a broader range of suitable thermal conditions for lizard thermoregulation. Combined with the increased habitat heterogeneity in areas with complex topographies (Ashman et al., Reference Ashman, Bragg, Doughty, Hutchinson, Bank, Matzke, Oliver and Moritz2018), this could explain the higher diversity observed in regions with greater altitude and topographic complexity.
Our results suggest that microhabitat aspects play a crucial role in species distributions. Six of the seven analysed species had microhabitat variables selected as more important than landscape variables in predicting their occurrences. Five of these only had microhabitat variables as major factors shaping the probability of occurrence, while for only two species, landscape variables appeared as main predictors. Habitat characteristics such as rock availability, litter, and fallen logs directly influenced lizard species occurrences and, consequently, can affect community composition in this Caatinga region. Specific factors like canopy cover, air and soil temperature, understory density, and fallen trunks positively influence lizard occurrence in the Caatinga (da Silva et al., Reference da Silva, Medeiros, Andrade Lima, de Sousa, Abrantes, de Lima, Leite and Kokubum2020). And similar results are already reported for lizards in other environments such as Restinga (Dias and Rocha, Reference Dias and Rocha2014; Rocha et al., Reference Rocha, Vrcibradic, Kiefer, Menezes, Fontes, Hatano, Galdino, Bergallo and Sluys2014), Amazonia (Garda et al., Reference Garda, Wiederhecker, Gainsbury, Costa, Pyron, Vieira, Werneck and Colli2013), and Cerrado (Nogueira et al., Reference Nogueira, Valdujo and França2005; Vitt et al., Reference Vitt, Colli, Caldwell, Mesquita, Garda and Franca2007).
However, in a seasonally dry tropical forest enclave (Werneck et al., Reference Werneck, Colli and Vitt2009) and in Caatinga sites (Cavalcanti et al., Reference Cavalcanti, Garda, Costa, Savaugere, Pessoa, Colli, Lion and Mesquita2023; Gonçalves-Sousa et al., Reference Gonçalves-Sousa, Mesquita and Ávila2019), communities were not structured in the spatial axis of their niches. Such differences may be inherent to the different methodologies and scales used in our study and the previous ones. Indeed, scale and sampling method have been directly implicated in biases in community studies with reptiles (Gardner et al., Reference Gardner, Barlow and Peres2007). Furthermore, given the low number of studies evaluating lizard community structure in the Caatinga at any spatial level and with any specific methodology, it is too early to evaluate if this is a general trend or not for the Caatinga.
Two species, Tropidurus semitaeniatus and Phyllopezus pollicaris, are known to be associated with rocky environments (Uchôa et al., Reference Uchôa, Delfim, Mesquita, Colli, Garda and Guedes2022; Vanzolini et al., Reference Vanzolini, Ramos-Costa and Vitt1980; Vitt, Reference Vitt1995). The logistic regression results for Tropidurus semitaeniatus confirm this pattern, with the number of rocky outcrops selected as the main variable to explain the probability of occurrence of this species. In fact, T. semitaeniatus was the most abundant species in the three areas where rocky outcrops were more frequent: Serrinha dos Pintos, Martins, and Felipe Guerra (see Figure 2 and Table Table S3). This Caatinga endemic species is strongly adapted to living in rocky outcrops (Pelegrin et al., Reference Pelegrin, Mesquita, Albinati, Caldas, Cavalcanti, Costa, Falico, Galdino, Tucker and Garda2017), and the importance of this local habitat variable surpasses the contribution of landscape elements in predicting the species occurrences.
The congeneric Tropidurus hispidus population was also more influenced by local rather than landscape features. Its occurrence was not associated with the number of rocky outcrops but showed a negative relationship with leaf litter, indicating a preference for more open areas over forested sites, as commonly observed for heliophilic species. However, its positive association with fallen logs suggests that these may serve as important microhabitat resources for T. hispidus, potentially providing refuges and/or feeding grounds, even in open habitats. Similarly, Ameiva ameiva, a generalist species widely distributed across South America and commonly associated with ecotones and disturbed areas (Vitt and Pianka, Reference Vitt and Pianka1994), was strongly influenced by microhabitat variables. For this species, a positive relationship with the number of fallen logs was also observed, which may reflect an indirect association with food resource availability. Since A. ameiva primarily feeds on insects such as cockroaches, insect larvae, and termites – especially as juveniles (Silva et al., Reference Silva, Andrade, Teixeira and Giovanelli2003) – fallen logs might enhance prey availability and thus play a critical role in habitat use for this species.
Vanzosaura multiscutata occurrences were also modulated mainly by microhabitat variables, specifically the percentage of herbaceous cover. This positive relationship suggests that herbaceous Caatinga (in contrast with arboreal) may play an important role in this species’ niche. The negative relationship we found between Lygodactylus klugei occurrences and the number of burrows was somewhat unexpected for this arboreal Caatinga endemic species. It is possible that it reflects the habitat suitability for its predators. Due to their small size, these lizards potentially have a great diversity of predators, such as arthropods, other lizards, snakes, birds, and small mammals. However, more studies should be performed to test such a hypothesis.
For two species, Ameivula ocellifera and Gymnodactylus geckoides, landscape variables had the main importance in explaining occurrences. The negative relationship between Ameivula ocellifera occurrences and the percentage of preserved Caatinga indicates the association of this generalist heliophile species with more open areas at the landscape scale. This contrasts with Gymnodactylus geckoides, which was strongly associated with the percentage of preserved Caatinga and higher altitudes at the landscape level, and with low herbaceous cover at the local, microhabitat level.
Conclusions
Topographic complexity had a major role in explaining patterns of species richness and diversity among our sites. The number of rocky outcrops was also important in explaining species richness. Different microhabitat variables helped to explain patterns of species occurrences, with their importance surpassing that of landscape variables in most of the investigated species (five out of seven). This shows that habitat and landscape structural characteristics significantly influence lizard assemblages in the Caatinga. Besides advancing in the comprehension of how such variables affect lizard biodiversity in the region, our work helps action plans and conservation strategies of species for the biome by indicating aspects of the local and landscape scales important for species occurrences. Considering our results, together with the threat of the consequent global changes in this biome, we highlight the need for conservation policies not only in topographic complex areas but also focused on restoring agriculture-prone lowland areas.
Supplementary material
The supplementary material for this article can be found at https://doi.org/10.1017/S0266467425000069.
Acknowledgements
We extend our gratitude to Daniel Bezerra, Damião Valdenor, Paulo Henrique, Marina Antongiovanni, Maria Clara, Felipe Marinho, and Airton Galvão for their invaluable support, both in the field and intellectually. Additionally, we appreciate the insightful contributions of Daniel Mesquita and Frederico França to the manuscript. We are grateful to the Wildlife Conservation Society – Brazil for the partnership and general assistance.
Financial support
Alan Oliveira would like to thank the Conselho Nacional de Desenvolvimento Científico e Tecnológico (CNPq) for granting a scholarship during the study period. Marilia Lion received a scholarship from Fundação de Amparo à Pesquisa do Estado da Paraíba (FAPESQ, Nº 07/2021 SEECT/FAPESQ/PB). We also acknowledge the Tropical Conservation Act (TFCA) through the Brazilian Biodiversity Fund (FUNBIO) (Call 04/2012).
Competing interests
All authors declare no conflict of interest.



