The Liberal Democratic Party (LDP, Jiyūminshutō) has dominated Japan's political landscape since shortly after the Second World War. While it has suffered the occasional defeat – most notably when many of its top members defected in the early 1990s and more recently in the summer of 2009 – the LDP has been the perennial winner, sparking a tremendous amount of research on the reasons for its success.Footnote 1 Scholars have pointed to the LDP's skill in catering to the needs of both rural and urban voters when electoral imperatives shifted as the reason for its success;Footnote 2 others have underlined the opposition parties’ failure at the local level as an explanation for the opposition parties remaining weak at the national level.Footnote 3 Despite this long-term success, researchers have seen cracks in the support for the LDP due to ‘gender gaps’ between women's and men's support for the party,Footnote 4 differences in political judgement of scandalsFootnote 5 and qualitatively different perspectives on political participation.Footnote 6
This article makes three contributions to research on the LDP's electoral dominance. First, despite claims that there is a gender gap in support for the LDP – that is, the idea that men support the party more than womenFootnote 7 – we demonstrate that age, not sex, serves as a consistently better predictor of support for the dominant party in Japan. As a result, theories about a ‘rising tide’ of general socio-economic development bringing in more female support for progressive parties are not supported by these results.Footnote 8 Secondly, using data from the 1970s through to the early 2000s, we show that this age gap in LDP support is stable across generations but at monotonically and slowly decreasing levels; that is, elderly voters in more recent times continue to overwhelmingly support the LDP compared with similar, younger voters polled at the same time but at lower rates than elderly voters in the past. This finding has obvious implications for future electoral politics in Japan and provides an additional level of explanation for the electoral failure of the LDP in recent elections. Thirdly, and finally, we argue that the decreasing age gap in support for the LDP comes from processes of socialization and redistribution, and not from levels of education or socio-economic status. In making this argument, we use simulations of our data to challenge current paradigms of socialization which focus on early parts of the lifecycle – ages eighteen to twenty-fiveFootnote 9 – and demonstrate that socialization takes place far later, often during the ‘twilight’ of voters’ lives.Footnote 10
These findings are important for a number of reasons. First, our results concerning party support shed light on the LDP's declining fortunes at the polls in recent years, including the upper house elections of 2007, the summer 2009 Tokyo municipal elections and, most importantly, the 2009 general election. Studies continue to show that party support still serves as the best predictor of voting patterns in Japan,Footnote 11 although the percentage of independents in Japan is high compared to most industrialized countries. Next, our findings underscore the need for social scientists to cross-check standard regression analyses using all available tools to illuminate potential problems in relying only upon observational, as opposed to experimental or quasi-experimental, data.Footnote 12 Finally, at the theoretical level, this article pushes social scientists to look for evidence of socialization, not just in the ‘formative’ stages of early adulthood but also in later years, which has received far less scholarly attention.
The article proceeds in three steps. As no single method can illuminate all of the puzzles in the data, we move between standard regression analysis and propensity score matching (PSM) in our analysis.Footnote 13 First, we lay out past theories concerning gender and age gaps in LDP support and use PSM on four datasets to systematically test these arguments, discovering that age, not sex – along with urban/rural location – is most critical. Then, we use simulations with confidence intervals based on logistic maximum likelihood models to demonstrate the movement of these age gaps over time. The quasi-experimental approach of PSM uses a pre-processed dataset to underscore which factors have robust influence on party support – namely age, not sex. With this information, we move to simulations with confidence intervals based on logistic regressions to demonstrate the probability that voters will support the LDP across a wide range of the independent variable of interest: age. These simulations provide intuitive visual representations which show not only the magnitude of the effect of age but also our uncertainty concerning these predictions. We envision the two methods as complementary, and not at odds with each other; both help us clarify the role that age plays in support of the long-dominant party in Japan. Finally, we show which theories explaining voter behaviour best match the results of our analyses.
Gender versus age gap in party support
Standard party identification (ID) literature identifies sex as a critical component in support, especially in advanced industrial democracies such as Japan and the United States. According to Inglehart and Norris,Footnote 14 Japan exhibits the largest gender gap in voting patterns among advanced industrialized countries, with many more women voting to the left than to the right. Studies of the United States electorate have often noted the growing ‘gender gap’ in partisan identification between women and men over the last few decades.Footnote 15 That is, women in North America increasingly are, and also vote, Democratic, while men increasingly support and vote for the Republicans. Burden similarly describes a party ID gap in the Japanese electorate where men, more than women, support the dominant LDP.Footnote 16
Explanations that have been offered for this supposed gap are often rooted in psychosocial conditions. LeBlanc argues that the ‘weight of perceived obligation to family and the nurturing role of the housewife’ impede standard forms of participation in the Japanese political arena.Footnote 17 When Japanese women participate in political activities, their party support and mode of involvement differ significantly from their male counterparts.Footnote 18 One standard approach suggests that these outcomes are a result of women being socialized into more ‘caring’ orientations and therefore identifying more with ‘caring parties’.Footnote 19 In the United States, the Democratic Party is often labelled as the ‘caring party’, while in Japan, the opposition parties are often seen as ‘softer’ than the pragmatic LDP.Footnote 20
Another approach argues that women support political parties which redistribute to underprivileged groups within society at greater rates – such as the Democratic Party in the United States and the Communist and Social Democratic Party in Japan.Footnote 21 A third argument is that women and men care about different issues, with women caring more about social welfare, education and the environment and men caring more about administrative reform, the fiscal deficit and defence issues.Footnote 22 Similarly, studies have underscored that women are more reluctant to support the use of force in international relations; this steers them away from the Republicans and towards the Democratic Party in the United States.Footnote 23 Taken altogether, there is a great deal of scholarship arguing for gender gaps in party support.
However, recent scholarship has also argued against a gender gap in party support in Japan. Iversen and Rosenbluth,Footnote 24 for instance, report that the gender gaps in political preferences in Southern European and East Asian countries, including Japan, are the smallest among industrialized countries because labour market regulations protect families, legislation and norms dictate against divorce, and female labour participation rates are low. All of these factors, they argue, help to align the preferences of women and men. In addition, some research – based on quantitative evidence – has criticized the idea that women and men in Japan view politics differently and participate in them differently.Footnote 25
Furthermore, beyond gender-based approaches, scholars have begun to recognize that age differences in behavioural and voting patterns may matter more than sex. Susan Pharr, for example, underscored differences in policy interests between older and younger women in Japan.Footnote 26 Robert Putnam, in his discussion of civil society and volunteerism, marked a difference between younger and older citizens in their willingness to contribute to society.Footnote 27 Similarly, Aldrich and Kage illuminated how age, more than gender, played a role in the propensity for citizens to judge political scenarios as ethical or not.Footnote 28 Thus, there is considerable disagreement among scholars on the extent to which the factors of gender and/or age shape support for the LDP. This article seeks to contribute to this debate by drawing on four large-scale datasets created over the past three decades.
Data
Throughout this analysis, we utilize four large-scale national surveys conducted in Japan between 1976 and 2001, analysing each dataset separately. The 1976 JABISS Survey (the Japan Election Study), conducted between November and December of 1976, used a two-stage stratified random sampling method and captured 1,796 valid responses. The 1993 Clean Election League (CEL) Survey, conducted between July and August of 1993, used a stratified, two-tiered random sampling method and obtained 2,301 valid responses. The 1996 Japanese Elections and Democracy Study (JEDS 1996) survey was conducted in October 1996 by Chuo Chōsa Sha company throughout Japan via a three-stage stratified sampling method and obtained 1,535 valid responses. Finally, the 2001 Japanese Elections and Democracy Study (JEDS 2001), conducted between October and November of 2000, used a two-stage stratified random sampling method and obtained 1,618 valid responses.
Using multiple large-N surveys asking the same questions over time allows us to explore two issues: first, whether sex-based or age-based differences in support for the LDP exist and persist over time and, secondly, whether any existing age-related differences reflect life-cycle effects or generational effects. Scholars have demonstrated three main types of discontinuities that can divide or unify a parental from a youth generation. These are generational effects; in which the two generations begin ‘apart’ on an issue and remain that way; life-cycle effects, with the younger generation converging on the positions of the older as it ages; and period effects, in which events affect both generations simultaneously so that they move congruently over time.Footnote 29 Since our datasets include individuals who were born as early as the late 1800s and as late as 1970, we are well situated to investigate the ways in which cohort effects and life-cycle effects have an impact on levels of party support.
Propensity score matching
To overcome methodological hurdles which may have biased past research, we use several strategies alongside standard regression models when analysing our data: Propensity Score Matching (PSM), average treatment effects (ATE) and simulation techniques employing confidence intervals. We employ PSM because these datasets, like the majority of datasets employed by social scientists, are observational as opposed to experimental. As researchers, we did not assign individual respondents in these four surveys their sex, level of education, income and so on. Instead, we are analysing data that is observational (and not experimental), and, as such, may have underlying connections between the variables. As a result of this lack of randomization, causal analyses based on comparisons between those units ‘may be misleading because the units exposed to one treatment generally differ systematically from the units exposed to the other treatment’.Footnote 30 John Stuart Mill, writing at the end of the nineteenth century, recognized this problem when he stated that ‘Observation, in short, without experimentation … cannot prove causation’.Footnote 31 Rosenbaum and Rubin point out that running standard regression analyses on unmatched, non-randomized datasets can lead to biased estimators.Footnote 32
One fix for the problem of a lack of randomization in observational datasets is balancing those units that received the treatment with those that did not through pre-processing or matching.Footnote 33 Like J. S. Mill's method of difference, the goal of matching is ‘to construct a control group as similar to the treatment group as possible’;Footnote 34 the treatment group is made up of units exposed to the condition, while the control group – quite similar in every other way – did not. Matching can be done using a propensity score, which is the probability of receiving the treatment based on the values of the other covariates.Footnote 35 Given the binary nature of the response to questions concerning respondents’ sex, we use sex as a ‘treatment’ and balance all other relevant covariates – education, income, location and so on – so that the women and men being compared are as similar as possible in all ways except for their gender. Matching in effect creates a pseudo ‘twin study’ by tossing out observations which are measurably different along the axes being compared to create two quite similar groups of respondents.
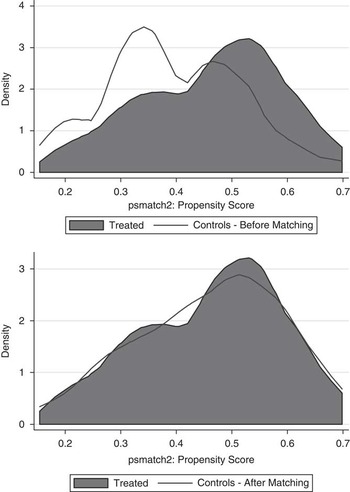
Figure 1 shows how important matching is in creating a balanced dataset, as those older respondents in the 1976 JABISS survey displayed certain characteristics – such as levels of education and income – which were measurably different from those who were younger. The images are kernel density plots of the propensity scores – the probability that an observation would be exposed to a treatment such as placement in an urban or rural location – before and after matching. The upper graph illustrates how different the two distributions are before the matching process, while the bottom graph displays how they become almost identical;Footnote 36 the better the overlay between the two ‘mountains’, the more similar the observations in the treated and untreated groups. These graphs underscore the dangers of easily accepting the results of standard regression analyses comparing treatment and control groups that may be quite different.Footnote 37
Sample distributions of propensity scores for treatment and control groups before and after pre-processing (JABISS 1976)

In carrying out our PSM and ATE analyses, we matched on all variables except for the quantity of interest using various matching techniques, including exact one-to-one matching and nearest neighbour matching (results varied only slightly across matching approaches). Testing the ATE for individual variables requires dichotomous treatments, and therefore the variables sex and urban/rural were maintained as binary category variables while the responses for age were dichotomized at the mean of each dataset (for example, 42 years in the JABISS 1976 dataset, 49 for the 1993 CEL dataset, and so on). Once we have used PSM and ATE methods to isolate the influence of critical variables, we then show how age – which proved a robust factor in the four datasets – influences LDP party support across its full range of values through simulations.
Age and gender gap findings
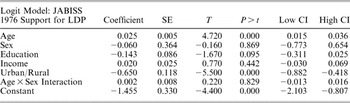
Using the 1976 JABISS dataset, a standard logit regression model measuring the impact of a number of factors on support (or non-support) for the LDP demonstrated that age and urban/rural were both significant at the 0.001 level.Footnote 38 Sex, education, income and an interaction term between sex and age did not prove to be measurably significant using this method of analysis (see Table 1 for a list of coefficient estimators). Correlations between the variables of age, income and rural/urban location were quite low, with the highest correlation of −0.1 occurring between urban/rural and age (meaning that older individuals at that time were slightly less likely to live in urban settings). Moving beyond this standard approach based on regression analyses, propensity matching scores with ATE confirmed the findings from the logistic regressions: sex failed to have a significant impact on LDP support.Footnote 39 PSM methods with ATE also confirmed the logistic regression outcomes by showing that both age and urban/ rural location were measurably significant (at the 0.001 level); individuals who were older were more likely to vote for the LDP, as were individuals living in rural areas (see Table 2). This first dataset supports age and location as predictors of LDP support, but not education, gender or income (or an interaction between gender and age).
JABISS 1976 Logit Model Coefficients

Note: In these tables, SE = Standard Error, CI = Confidence Interval.
Average Treatment Effect of Sex, Age (Dichotomized at Mean) and Rural/Urban Location on LDP Support, JABISS 1976

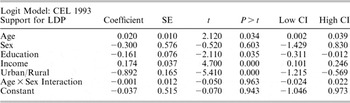
For the data from the 1993 CEL national survey, a standard logit model measuring the impact of various factors on LDP support found almost all of the covariates to be significant with the exception of sex and an interaction term between sex and age (see Table 3 for coefficient estimators). As with the 1976 dataset, PSM confirmed the argument that sex was not an important factor in LDP party support (with a p value of 0.27); see Table 4. At the same time, PSM found that rural/urban location proved significant (at the 0.001 level) using ATE but age was insignificant by conventional standards. Correlations between core variables were again quite low; for this dataset, the highest value (of 0.1) was between age and income (indicating that older respondents in this dataset were slightly more likely to be wealthier).
CEL 1993 Logit Model Coefficients

Average Treatment Effect of Sex, Age (Dichotomized at Mean) and Urban/Rural Location on LDP Support, CEL 1993

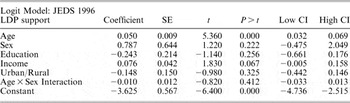
For the 1996 JEDS data, the results of the standard logit model showed that while sex and the majority of other variables were not significant factors in determining support for the LDP, age again was (see Table 5 for the estimated coefficients). PSM and ATE analysis showed that neither sex nor urban/rural location had a significant impact on support for the LDP, but age did (see Table 6). Here again, both statistical approaches confirm that older voters were more likely to support the LDP than their quite similar but younger counterparts at the same time. As in previous datasets, correlations between variables of interest were low, with the highest of −0.1 between age and income (meaning that for these respondents, the elderly were slightly less likely to have greater wealth).
JEDS 1996 Logit Model Coefficients

Average Treatment Effect of Sex, Age and Urban/Rural Location on LDP Support, JEDS 1996

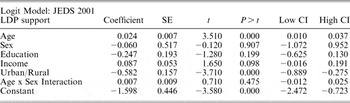
For the 2001 JEDS dataset, the standard logistic regression produced significant coefficients for age and urban/rural location (at the 0.001 levels; see Table 7 for coefficient estimators). While the logistic regression failed to find a relationship between sex and party support, PSM and ATE found a weak relationship (with a p value of 0.014). On the other hand, age and urban/rural locations remained powerful forces behind LDP support, as indicated by propensity matching scores and ATE (with p values close to 0.001; see Table 8). For the 2001 dataset, the highest correlation between variables was −0.2 and that occurred between age and income (indicating, as with the 1996 data, that older respondents were somewhat poorer than younger respondents).
JEDS 2001 Logit Model Coefficients

Average Treatment Effect of Sex on LDP Support, JEDS 2001

For the majority of these datasets, age, not sex, proved to be the best predictor of support for the LDP in paired comparisons between quite similar voters. Neither the education variable nor the sex variable proved a consistent, statistically significant factor in LDP support across the four datasets (although education did surface in the 1993 CEL regressions with a p-value of 0.035 and a relatively small estimated coefficient), while the rural/urban variable did for both methods in all datasets and with higher estimated coefficients, meaning that this variable had more measurable impact on party support. These findings about the location of the voter support well-known, standard arguments that the LDP worked to redistribute goods to the periphery – namely rural cities, villages and towns.Footnote 40 Our findings for age and sex – which counter arguments made in the past about a ‘gender gap’ – move us to investigate the role of age in party support over time more deeply.
Consistency of the age gap: simulation and confidence intervals
Having established that age, not sex, most consistently predicts support for the LDP over the four datasets, we now move to illuminate how the intensity of party support changes with age and with different generations. To give more detail about the relationship between our quantities of interest, we go beyond standard tables of coefficient estimators and use confidence intervals (CI) and simulation. Confidence intervals allow investigators to ‘express the appropriate degree of certainty around … quantities’ while simulation techniques allow us to ‘extract the currently overlooked information’ and ‘interpret and present it in a reader friendly manner’.Footnote 41 In simulation, we ‘learn about a distribution by taking random draws from it’. Once we have taken the random draws, we can use them to approximate a feature of the distribution.Footnote 42 Our quantity of interest is the predicted probability that an individual will support the LDP based on his or her age; by carrying out this analysis across all four datasets, we can pinpoint generational shifts in support.
Building on the results from the PSM and ATE, we conducted a quantitative analysis using a logistic regression model to show the magnitude of the effect of age on LDP party support, controlling for education, income and place of residence (urban or rural). Respondents indicated that they supported the LDP (1) or some other or no other party (0). In our logit model, the probability of supporting the LDP is E(Yi) = πi, an intuitive quantity of interest. We estimated this probability, and the uncertainty surrounding it, across the age range (18 to 90 years in most of our datasets) while holding other variables at their means. We repeated the expected value algorithm M = 1,000 times to approximate a 95 per cent confidence interval probability around our predictions. Here, a 95 per cent confidence interval indicates that if we could, in real life, raise or lower the age of respondents and measure their support for the LDP, after 1,000 such trials their support would fall within these boundaries. Overall, the results demonstrate consistent but monotonically declining support among older voters.
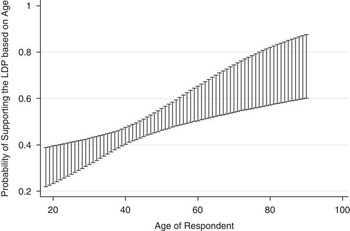
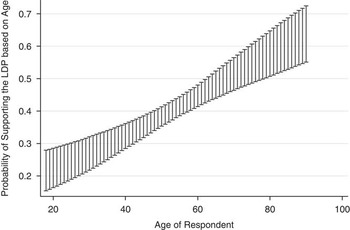
Figure 2 uses the JABISS 1976 dataset and demonstrates through simulation techniques and confidence intervals that the age of the respondent was a powerful factor in determining support for the LDP. In this figure representing the predicted probability of party support, and all of those which follow, we held all of the covariates – education, income, location in a rural or urban setting, and so on – at their means except for age, which ranged between 18 and 90. Where the vertical bars are longer, we have less confidence in our predictions, generally because we have fewer observations of that age in our dataset. Where the vertical bars – the confidence intervals – are smaller, we are surer of our predictions. This figure predicts that after the age of 60, women and men are twice as likely to support the LDP (between 60 and 80 per cent more likely) as those respondents between the ages of 20 and 30 (between 23 and 39 per cent more likely to do so). The average predicted probability of supporting the LDP for the oldest members of the sample hovers around 75 per cent.
Older women and men more likely to support the LDP (JABISS 1976)

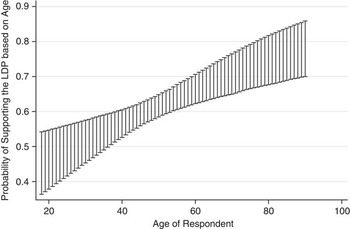
We now move forward in time to the 1993 data. Figure 3 uses the 1993 CEL dataset and demonstrates the strong relationship between age and support for the LDP, holding all other variables at their means. In this sample, younger voters were slightly more likely to support the LDP – between 40 and 50 per cent likely for voters between the ages of 20 and 30 – and again voters over the age of 60 had a 70 per cent and higher likelihood of supporting the LDP. Among the oldest sampled residents, the average probability for support for the party is around 75 per cent, as in the previous cohort. Data on the oldest voters in the first two datasets predict that the oldest respondents are three-out-of-four times more likely to support the LDP.
Older respondents more likely to support LDP (CEL 1993)

We now move forward to the 1996 survey data. Figure 4 uses the 1996 JEDS dataset and holds all of the other covariates at their means while allowing age to range between 20 and 87. Here, we have stronger confidence in our predictions because more respondents answered the question about LDP support, and we again demonstrate the strong pattern established by the two previous datasets, namely that support for the LDP increases with age, controlling for income, education and so on. However, comparing the upper and lower confidence intervals for the predicted probability of support for the LDP from oldest members of this cohort to the previous two cohorts, support levels for the party have dropped. The average predicted probability of support for the LDP among the oldest respondents is now close to 70 per cent, down from the predicted 75 per cent of the past two cohorts. While the majority of older voters continue to support the LDP, this support has dropped measurably.
High confidence in strengthening relationship between age and LDP support (JEDS 1996)

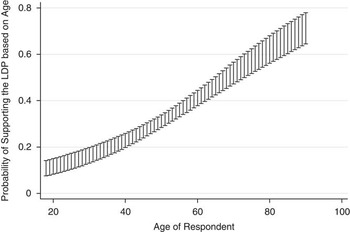
We now move to our last and most recent dataset. Figure 5 uses the 2001 JEDS dataset and demonstrates the now familiar relationship between party support and maturity, in which probability of supporting the LDP increases with age. However, notice that the highest predicted levels of LDP support are now measurably lower than in past cohorts. The average predicted probability of supporting the LDP for the oldest respondents is down to 60 per cent. While data on the oldest voters in the 1970s and 1980s predicted a 75 per cent chance of voting for the LDP, that likelihood dropped to 70 in the 1990s and then to 60 per cent by the early 2000s.
Older women and men more likely to support the LDP (JEDS 2001)

Theoretical sources of the gap
Having established a consistent age gap which is weakening in intensity over the past thirty years, we now look to explain its origins. Our findings so far support claims that the elderly have provided a key base of support for the LDP in the past.Footnote 43 Konoe argued that the percentage of LDP supporters surpasses the percentage of non-LDP party supporters after age 40 and that among 65-year-olds, LDP supporters outnumber supporters of non-LDP parties by almost two to one.Footnote 44 The fact that, as noted earlier, party support remains the strongest determinant of vote choice in Japan, and that, as in many other industrialized countries, the turnout rate among the elderly in Japan is much higher than for younger voters, amplifies the electoral effect of elderly voters’ loyalty to the LDP. But the precise mechanisms as to why the elderly disproportionately support the LDP are not well understood.
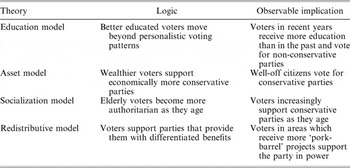
The literature on party support offers four arguments why older voters may be more likely to support conservative parties than younger voters: the education, asset, socialization and redistributive models. The education model stresses how exposure to formal education shapes political attitudes, party support and/or voting behaviour. Japanese citizens born later in history, on the whole, receive more education than those born earlier. But research suggests that education makes voters less likely to vote for those parties which provide particularistic benefits to themselves and more likely to support broader societal goals.Footnote 45 That is, voters who have been exposed to educational institutions run by democratic governments for longer periods can better envision the need for policies that contribute to the broader public good rather than those who serve their own parochial interests. Note that for this latter point, the effects of education alluded to here do not entirely overlap with the effects of education that were tested in the regression analyses conducted above, since individuals who were schooled during the pre-war period may have been socialized into qualitatively different values than those who were educated in the post-war period.
Next, in the asset model, elderly voters might be expected to have accumulated larger assets over the course of their lives than younger voters, which should be likely to lead older voters to become more conservative on economic issues.Footnote 46 This is not the same as the effects of income, which were tested in the statistical analyses conducted above, as elderly voters may have relatively low incomes, perhaps only receiving pension income and earning little salary pay, but have large accumulated assets from their working years. In Japan, as well, a recent survey shows that individuals in their 70s had an average of 14.2 million yen in savings, while those in their 30s held an average of 466 million yen, and the former had much lower levels of annual income than the latter: 5 million yen per year as opposed to 6 million yen per year.Footnote 47 As voters accumulate more wealth, they become less likely to support parties that favour existing or higher tax rates that threaten to diminish their assets. This perspective also suggests that such voters may be less likely to favour national policies which redistribute to ‘needy’ groups such as the poor and elderly.
Thirdly, socialization models suggest that marriage and child-rearing makes some individuals more socially conservative; others have argued that individuals typically become more authoritarian as they age, regardless of whether or not they enter into marriage and child-rearing.Footnote 48 Raising children pushes some parents to emphasize ‘traditional values’ or ‘family values’ which conservative, as opposed to progressive parties, regularly claim as their jurisdiction. Others argue that ageing itself – which brings with it greater resistance to new ideas – makes it less likely that individuals will support contemporary progressive policies or attempt new experiences.
Finally, the fourth model focuses on redistribution and posits that different political parties around the world adopt different policies or policy platforms towards different generational cohorts.Footnote 49 Again, this is not the same as the effect of income per se, which was controlled for in the quantitative analyses above, since this argument focuses not so much on how much is being redistributed at present as how much different parties promise to redistribute in the future. Some parties may advocate policies that favour the elderly, while others may adopt platforms that are targeted more towards children and/or child-bearing families. This suggests that older voters should support parties that pledge to redistribute more to the elderly, while younger voters should support parties that are more youth-friendly. Specifically, voters should compare the policy platforms of different political parties and support parties that better serve the economic interests of their generational cohorts.
Each of these hypotheses yields different predictions regarding the partisanship of elderly voters, as well as the timing in which their partisan allegiances are formed. Table 9 lays out these four theories and their respective logics along with their observable implications for investigating them through quantitative analysis. Both the asset model and the redistributive model point to economic interests as the linkage between age and partisan support, but the mechanisms that drive the hypotheses are slightly different. The asset model stresses how the accumulated stock of elderly voters’ assets affects partisan support, whereas the redistributive model focuses on how present and anticipated flows of benefits from the government shape partisan support of different generational cohorts. Moreover, the two models also yield different observable implications. If the asset model is valid, voters may also become more conservative with age due to rising wealth, but after retirement, as voters begin to live off pensions and savings, their conservatism may recede.
Models Connecting Voter Characteristics to Support for Political Parties

In turn, if the redistributive model is correct to argue that the elderly are likely to support political parties that redistribute more generously to them, their support may be contingent on parties’ abilities to initiate elderly-friendly policies and to sustain them. If growing fiscal deficits constrain the ability of parties in power to redistribute to the elderly, support for those parties among the elderly may suffer. Note that in this model, the age variable captures a different kind of redistribution than pork-barrelling towards rural districts; rural voters may support the LDP because they have traditionally favoured generous pork-barrelling towards rural areas, but this effect is captured by the urban/rural variable. Instead, in the redistributive model, the age variable should capture redistribution that is specifically targeted towards the elderly as a constituency group.
On the basis of the analysis presented in the previous section, we reject theories focused on education and assets and instead emphasize the role played by socialization and redistribution. First, the relationship between education and LDP support was statistically significant only in one of the four sets of regression analyses – the 1993 CEL dataset. This suggests that the relationship between education and LDP support has been tenuous at best, just as the college enrolment rate rose markedly in Japan during the 1990s.Footnote 50
Secondly, the fact that income only occasionally served as a strong predictor of LDP support – income was only found to be significant at the 5 per cent level in the 1993 CEL dataset – indicates weak or non-existent support for the asset model. Of course, income is only an indirect measure of assets, and while those with higher levels of income should generally also exhibit higher incomes, it is possible that particularly among the elderly, those with larger assets may not necessarily make larger incomes. However, the simulation analyses presented earlier showed that support for the LDP rose monotonically with age, in contrast to the expectations of the asset model, which predicts a fall in conservative party support after individuals retire. Moreover, figures compiled by the Japanese government in fact show that the elderly in 2001 had indeed accumulated considerably larger assets than their counterparts in 1976.Footnote 51 The elderly, however, have not become more supportive of the LDP over time – indeed, to the contrary – and this also undermines the plausibility of the asset model. As noted previously, Figures 2 to 5 suggest a gradual weakening of the relationship between age and LDP support over time. In the 1976 survey, the probability that a 60-year-old individual would support the LDP was roughly around 70 per cent; in the 2001 survey, it had declined to around 60 per cent. Furthermore, the correlations reported earlier between age and income show that over the past two decades, the elderly have become less likely to be among the wealthier of the respondents.
The empirical evidence provides support for the socialization and the redistributive models. In Japan as elsewhere, individuals do become more authoritarian over time, but recent studies underscore that the elderly today are less authoritarian than they were a few decades ago.Footnote 52 For instance, according to the Survey on the National Character, which has been conducted in Japan every five years since 1953, 41 per cent of respondents in their 60s agreed at that time that politics should be left to politicians rather than opened further to ordinary citizens, compared to 24 per cent in 2008.Footnote 53 Similarly, the same survey reports that the percentage of respondents in their 60s who indicated that people should adhere to social norms even in situations when people think those norms are wrong declined from 52 per cent in 1953 to 38 per cent in 2008.Footnote 54 These percentages are still higher than among younger generational cohorts, but the declining trend has been consistent. The drop in conservative values among the elderly has continued over the past fifteen years, precisely as elderly support for the LDP has waned.
The analyses presented in this article also provide support for the redistributive model. The LDP has consistently favoured redistributing income from the younger cohorts to the elderly; indeed, Lynch argues that the Japanese welfare state is the most elderly-friendly in the developed world.Footnote 55 At the same time, the LDP's ability to redistribute to the elderly declined considerably between the late 1970s and the early 2000s, its continued willingness to do so notwithstanding. As the number of elderly citizens has rocketed in Japan, pension benefits for the elderly have been cut gradually but steadily since 1985.Footnote 56 And quite simply, the ballooning fiscal deficits in Japan since the mid-1990s, among the worst in the Organisation for Economic Cooperation and Development (OECD), have severely hampered the LDP's ability to buy off the growing elderly constituency. Thus, while the LDP's generous redistribution policies have earned it a loyal base of support among the elderly, the LDP's diminishing ability to redistribute has led to gradually waning support from this group.
The 2009 general elections
To what extent does the present study shed light on the LDP's dramatic defeat in the general election of August 2009? While the analyses are still preliminary, scholars have pointed to a variety of factors that contributed to the LDP's downfall in 2009:Footnote 57 the presence of an unpopular prime minister, the Communist Party's decision not to run candidates in many single-member districts, the ‘rebound’ effect from the LDP's landslide victory in the general elections of 2005, and negative externalities created by LDP institutions over time.Footnote 58
Age may have played an important role as well. First, as noted earlier, support for the LDP has consistently been higher among the more elderly generational cohorts compared to the younger cohorts, but as this article has shown, the strength of support among the elderly has fallen considerably over the last few decades. This leads to the prediction that as support for the LDP among the elderly declines over time, the electoral strength of the LDP should also wane as a result. Indeed, while the analysis presented in this study ended in 2001, a recent study confirms that between 1995 and 2004, support for the LDP continued to fall across different generational cohorts, especially among the younger cohorts.Footnote 59 According to this study, 11.1 per cent of individuals in their 20s supported the LDP in 1995, compared to 8.7 per cent in 2004; among individuals in their 40s, 24.7 per cent expressed support for the LDP in 1995, as opposed to 16.3 per cent in 2004; and among individuals in their 50s, support for the LDP fell from 30.9 per cent in 1995 to 24.6 per cent in 2004. These findings confirm our argument that age serves a key determinant of LDP support, but that overall levels of support for the LDP continue to sag over time. While the LDP's landslide in the 2005 election was somewhat of an anomaly, the results of the 2009 elections can largely be understood as a continuation of this trend that, as we have shown in this article, has been present at least since the late 1970s.
Secondly, moreover, studies suggest that recent reforms have helped to enhance the relative electoral clout of the younger generational cohorts in Japanese elections vis-à-vis elderly voters. During the late 1990s, a series of reforms were introduced in Japan that sought to increase voter turnout. For instance, reforms during the late 1990s extended voting hours by two hours so that the polls closed at 8 p.m. instead of 6 p.m. Many of the restrictions on absentee voting were also lifted. Preliminary analyses find that the elderly were still more likely than the young to vote for the LDP in the 2009 general elections.Footnote 60 But a recent study shows that while the two-hour extension in voting hours generally increased voter turnout, it has especially helped to bring more younger voters to the polls – voters who are less likely to support or to vote for the LDP than the elderly.Footnote 61 Indeed, turnout among voters in their 20s has risen by roughly 15 per cent over the last three general elections, from 35.62 per cent in 2003 to 46.20 per cent in 2005 to 49.45 per cent in 2009; similarly, turnout among voters in their 30s rose from 50.72 per cent in 2003 to 59.79 per cent in 2005 to 63.87 per cent in 2009.Footnote 62
During the same period, turnout among individuals who are in their 60s has also risen, but by a much smaller margin: from 77.89 per cent in 2003 to 83.08 per cent in 2005 to 84.15 per cent in 2009. While systematic evidence is not yet available, the relaxing of restrictions on absentee voting in recent years may also have, in similar fashion, adversely affected the electoral fate of the LDP.Footnote 63 Absentee voting in Japan has more than doubled over the last decade to fourteen million voters in the 2009 general elections;Footnote 64 one may speculate that younger voters may be more likely to vote absentee than the elderly.Footnote 65 More research is, of course, still necessary. But the initial evidence suggests that the age variable, which this article has emphasized, appears to have played a strong role in shaping the results of the 2009 general election.
Conclusions
Using four datasets generated over the past three decades, we have demonstrated that age and location best predict party support among voters in Japan. Interestingly, controlling for income and education, we showed that sex did not prove to be a significant factor despite common beliefs about its efficacy or about a ‘gender gap’ in support for the LDP. The analysis did not find support for theories about a ‘rising tide’ phenomenon in which women born more recently would be more likely to support the LDP due to a narrowing in the wage gap.Footnote 66 That is, women born more recently displayed a similar movement towards the LDP as women born more than a century ago. We were also unable to confirm hypotheses linking income and education to party support.
Our findings for the role of age in party support were robust, as the four datasets captured the responses of Japanese citizens born between the late 1890s and the 1970s – and in every survey, the relationship between age and LDP remained positive. Older voters, both women and men, support the LDP more than their younger counterparts. This relationship was true regardless of sex, income and educational level. Socialization – that is, life experience – and redistributive policies draw older women and men to support the LDP. The consistency of age-based support for the LDP across these four datasets provides strong support for the theories focused on life cycle, as opposed to generational or period effects. Hence, despite occasional scandals which have been well covered by the national Japanese media,Footnote 67 most voters gravitate towards the dominant party regardless of these political shenanigans which affect their cohort. Based on these data, we believe that the life-cycle effect – in which the younger generation converges on the positions of the older as it ages – best describes the changes in LDP support over the past several decades. Period and generational effects were not visible in the thousands of respondents analysed here.
Aside from the findings on sex, the results of our analysis strongly conform with existing studies on voting behavior in Japan. Rural voters typically have been found to express greater support for the LDP than urban voters. And older voters have been found to support the LDP in larger numbers than younger voters.Footnote 68 The present study has shown that these effects trump the apparent effects of sex. The analyses also illuminate the mechanisms through which age may impact levels of party support. Specifically, the LDP's generous redistribution towards the elderly served as the linchpin of elderly support towards the LDP, but this support has decreased in proportion to loss in distribution. Elderly voters have been less likely to be among the wealthier of our respondents and have been edged out by recent electoral reforms which favour younger voters.
Another broad point to note concerns the issue of socialization. Some studies of political behaviour posit the presence of a ‘formative period’, typically between the ages of 18 to 25, during which political attitudes and values become crystallized and then endure for the rest of individuals’ lifetimes.Footnote 69 Results of the analyses shown here cast some doubt on this understanding of socialization. The findings here suggest that political learning continues throughout individuals’ lifetimes. Indeed, the steeper slope towards the middle of many of the simulation graphs, between the ages of 40 and 60, compared to the ages of 20 and 40, suggest that learning may even accelerate during the middle ages compared to the younger years. Martin suggests that marriage itself may be a strong factor in ‘congruence’ among married Japanese spouses, with surveys indicating that men engage in political conversation with their wives more than might be expected.Footnote 70 As Japanese women continue to postpone marriage until later dates, the congruence effects so visible in our datasets may become weakened and/or appear later in individuals’ life course in future surveys.
This article has focused primarily on the relationship between party support and age in Japan. Our results suggest that in other industrialized nations where dominant parties have established enduring legacies, such as Sweden, Italy and Israel,Footnote 71 there may be a similar connection between life experience and party support. In addition, even in democracies where parties alternate in office with more regularity, such as the United States and England, age and experience should be taken seriously when investigating popular support for political parties. Finally, on the basis of the analysis conducted in the present study, it is not clear whether this relatively steep learning curve during the middle-aged years may be unique to Japan. The question of whether, and to what extent, political socialization may vary across different nations is not an issue that has received focused attention in the field of political behaviour. These findings open up an intriguing avenue for further research on age, socialization and party identification.