


1. Introduction
Sea-ICE motion is an important component of the Sea-ICE mass balance. divergent motion results in leads and new ICE growth; convergent motion results in rafting and ridging. observations from in Situ buoys or radarsat imagery provide detailed high-resolution ICE-motion information. however, their utility is limited due to their Sparse Spatial or temporal coverage. imagery from passive microwave Sensors has provided a long history (since 1979) of daily, basin-scale motion estimates, but at a coarse Spatial resolution. the new nasa advanced microwave Scanning radiometer for the earth observing System (AMSR-E) Sensor on the aqua platform has more than twICE the Spatial resolution of its predecessor, the Special Sensor microwave/imager (SSM/I). this allows AMSR-E to obtain more accurate and more detailed ICE-motion estimates but at the Same daily intervals as SSM/I. with more detailed motion information, important Smaller-scale processes Such as lead formation and ridging are better characterized. this Study is one of the first to evaluate Sea-ICE motions from AMSR-E (see Reference Agnew, Vanderweghe and YuAgnew and others, 2005), the first to quantitatively analyze the quality of AMSR-E motions over the entire arctic and the first application of AMSR-E imagery to estimate deformation. Sea-ICE models are becoming more Sophisticated (e.g. improved rheologies, higher resolution), and new modeling approaches (e.g. lagrangian particle models) are being developed. the improved Sea-ICE observations from AMSR-E will be particularly beneficial for Such models. in addition, improved motion and deformation information will be useful to the operational community. here we demonstrate the ability of AMSR-E to yield detailed ICE-motion circulation.
2. Passive Microwave Sea-ICE Motions
Sea-ICE motion is derived from passive microwave imagery using a maximum cross-correlation (mcc) Scheme (Reference Emery, Fowler, Hawkins and PrellerEmery and others, 1991). features are matched between two coincident images Separated by a period of time. the displacement of a feature is computed by finding correlation peaks between the two images, and the velocity is computed by dividing the distance between the features by the time Separation between the images. the Spatial and temporal resolution of the motions is limited by the raw imagery. this is a robust technique that has been used on Several different types of imagery, including visible/infrared (e.g. Reference Emery, Fowler, Hawkins and PrellerEmery and others, 1991), Scatterometry (e.g. Reference Zhao, Liu and LongZhao and others, 2002; Reference HaarpaintnerHaarpaintner, 2006) and Sar (e.g. Reference Kwok, Schweiger, Rothrock, Pang and KottmeierKwok and others, 1998; Reference Zhang, Rothrock, Lindsay, Yu and KwokWilson and others, 2001).
Motions derived from passive microwave imagery have primarily relied on the SSM/I Sensor, which has repeat coverage (at least) daily, but has a coarse Spatial resolution: 12.5 km gridded resolution at the 85.5 ghz frequency, and coarser resolution (25 km) at lower frequencies. thus, in theory a feature must move at least 6.25 km (half a pixel) for motion to be detected. oversampling techniques can improve the precision of motions to about 3 kmd–1. however, even with oversampling, SSM/I is not able to capture Small-scale motions. other error Sources limit the actual accuracy to 6–7km d–1 (Reference Kwok, Schweiger, Rothrock, Pang and KottmeierKwok and others, 1998; Reference Meier, Marquis and KaminksiMeier and others, 2000), including Surface ambiguities (snow, meltwater) and atmospheric effects (especially the high-frequency 85/89ghz channels). the Surface ambiguities and atmospheric effects tend to be particularly large (and variable) during the Summer and it is difficult to obtain motions in Such conditions; thus, most Studies (including here) produce motions only during fall through early Spring.
Interpolating motions with higher-resolution motion Sources, Such as buoys and visible/infrared images (e.g. from the advanced very high resolution radiometer), can yield improved fields (c. fowler, http://nsidc.org/data/nsidc-0116.html). temporal averaging over a longer time period can also reduce errors, but at the loss of capturing higher-frequency motions.
3. AMSR-E Sea-ICE Motion
The AMSR-E Sensor, launched in 2002, represents a Substantial advancement over its predecessors. AMSR-E is a Six-frequency, dual-polarized passive microwave Sensor, with more channels and, most relevant for ICE motion, higher Spatial resolution than SSM/I. for example, the AMSR-E 89 ghz instantaneous field of view (satellite footprint) is less than half the Size of the comparable SSM/I 85.5 ghz channels (table 1), and AMSR-E has double the gridded resolution. additionally, the AMSR-E 36.5 ghz channel has a Smaller footprint Size and the Same gridded resolution as the SSM/I 85 ghz channel, but the 36.5 ghz channel is less Susceptible to atmospheric interference than the 85.5/89ghz channels, leading to greater accuracy at the Same Spatial resolution.
Comparison of SSM/I and AMSR-E channels, Satellite footprint and gridded resolution
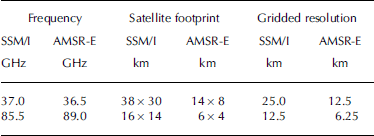
The higher resolution and oversampling allow AMSR-E to potentially track ICE that moves <2 kmd–1 (from the 89 ghz frequency), a Substantial improvement over SSM/I. while this resolution is Still fairly coarse compared to visible/infrared (e.g. moderate-resolution imaging Spectroradiometer (modis)) and Synthetic aperture radar (sar; e.g. radarsat) Sensors, it can provide near-complete fields over the entire arctic at daily intervals. modis is limited to clear-sky regions, and radarsat is limited by Sensor capabilities to a 3–6 day interval in at least Some regions.
Daily composite AMSR-E imagery on a polar Stereographic grid for both hemispheres was acquired from the us national Snow and ICE data center (http://nsidc.org/daac/amsre/) for 2003 and 2004. Sea-ICE motions were produced from 24 hour composite gridded fields for both polarizations of the AMSR-E 36.5 and 89 ghz frequencies using the mcc algorithm with 4× oversampling. the use of daily composites introduces Some temporal ‘smearing’, introducing possible error due to the motion of the ICE during the 24 hour period. however, daily fields are complete, allowing motions to be calculated at all gridpoints. the radius of the correlation window is 100 km (8 pixels for 36.5 ghz, 16 pixels for 89 ghz). an ICE mask derived from the AMSR-E Sea-ICE concentration product was used to eliminate vectors over open water. two automated filtering techniques were employed to eliminate many erroneous vectors over ICE. the first technique Simply Set a minimum threshold for correlation at 0.7 for an acceptable motion; this reduces many ‘questionable’ matches. the Second technique required that any vector have a minimum of two neighboring vectors whose displacements are within two pixels of the Said vector; this eliminates lone ‘outliers’, but clusters of three (or more) erroneous vectors may not be removed. while motions were calculated at the gridded resolution of the imagery, to reduce Storage Space requirements, vectors are Saved from every fifth gridpoint, corresponding to every 31.25 km for 89 ghz and 62.5 km for 36.5 ghz.
Example monthly Sea-ICE motion fields were produced for the arctic in march 2004 and the antarctic in august 2004, during the month of maximum extent, by averaging daily fields. these monthly averages Show the general Sea-ICE circulation patterns in each hemisphere (fig. 1). the beaufort gyre, transpolar drift Stream and outflow through fram Strait can be clearly Seen in the arctic field. in the antarctic image, the general clockwise flow around the continent along with the weddell Sea gyre and northward flow out of the ross Sea are evident. additionally, a Strong average low (clockwise gyre) can be Seen to the east of the weddell Sea.
Monthly mean Sea-ice motion for (top) March 2004 in the Arctic, and (bottom) August 2004 in the Antarctic; vectors are plotted every 50 km for clarity. Vectors from all four channels (36.5H, 36.5V, 89H, 89V) were used to create the monthly means. Note the Scale difference of the vectors between the Arctic and Antarctic. The U and V directional conventions are provided in the Arctic image. The boxed region in the Arctic image corresponds to the region in Figures 2 and 3.

4. Comparison of AMSR-E Motions With Buoys
Buoy motions for the arctic winter (october 2003–april 2004) were acquired from the international arctic buoy program (iabp; Reference Wilson, Barber and KingRigor and ortmeyer, 2002). daily buoy position data were converted to the polar Stereographic grid, and daily ICE motion was calculated. the rms buoy motion error is estimated to be 0.5 kmd–1; thus, the buoys are a good ground ‘truth’ to evaluate the Satellite estimates. for each buoy motion estimate, the closest AMSR-E motion from each AMSR-E channel (36.5h, 36.5v, 89h, 89v; four in total) was found. a maximum distance of 50 km between the AMSR-E and buoy estimate was used. the correlation length Scale of arctic Sea-ICE motion is Several hundred kilometers (Reference Meier, Marquis and KaminksiMeier and others, 2000), and at a 50 km distance ICE motions are generally highly correlated. however, there is the potential for the buoy to move in a different direction than the AMSR-E pixel. thus Some of the difference between buoy and AMSR-E estimates may not be error but the detection of different motion. different Scales have been investigated and 50 km has been found to maximize the number of comparisons without Significantly affecting the Statistics.
The difference between each pair of AMSR-E and buoy estimates was determined, and average Statistics were calculated for the u and v components of motion (as indicated in fig. 1) (table 2). AMSR-E estimates with errors greater than 20 kmd–1 were eliminated from the comparison to avoid Skewing the Statistics. this was done to filter out obvious outliers: erroneous vectors that were not Screened out by the filter. using Such a cut-off prevents a few vectors with very large errors from Skewing the Statistics. while this could be done through manual inspection, an automated cut-off is much quicker and less tedious.
Difference between AMSR-E and buoy motion (AMSR-E – buoy) estimates for October 2003–April 2004 for both polarizations (horizontal and vertical) of the 36.5 and 89 GHz channels
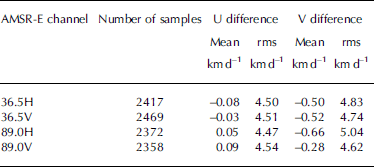
The AMSR-E motion estimates from the 36.5 ghz channels are Surprisingly Similar to (actually Slightly lower than) the 89 ghz despite the fact that the 36.5 ghz channels have a gridded resolution, and hence a theoretical motion precision, half that of the 89 ghz channels (12.5 km vs 25 km) (table 2). this discrepancy is likely due to the fact that the 36.5 ghz frequencies are less affected by the atmospheric and Surface properties than the 89 ghz. also, the oversampling technique may be more effective at the lower Spatial resolution of the 36.5 ghz frequencies. compared to in Situ buoy data, both AMSR-E channels have rms errors about 2 kmd–1 lower than motions derived from SSM/I 85.5 ghz imagery (Reference Kwok, Schweiger, Rothrock, Pang and KottmeierKwok and others, 1998; Reference Meier, Marquis and KaminksiMeier and others, 2000).
One method to improve the quality of the AMSR-E motion estimates is via an optimal interpolation (oi) method. oi uses the error Statistics of the motion estimates and the Spatial distribution of the estimates to determine the optimal (i.e. lowest-error) estimate. this method was implemented during march 2004 for the horizontally polarized channels for comparisons with motions from the individual AMSR-E channels (table 3).
Comparison of horizontally polarized AMSR-E and interpolated motion estimates with buoys for March 2004
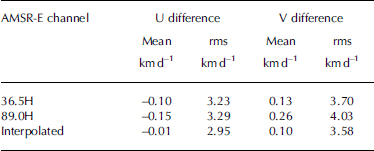
The rms differences for the march motions from the individual AMSR-E channels are lower than the october–april Statistics because during march most of the arctic Sea-ICE pack is highly concentrated. thus the ICE Surface is Stable over time, and the atmosphere tends to be dry, which results in optimal conditions for retrieving ICE motion from passive microwave Sensors. when the motions are interpolated, the rms differences from the buoys are reduced by about 10% and the biases are reduced as well.
5. Beaufort Sea Example
The low Spatial resolution of previous passive microwave Sensors has Severely limited Such Sensors’ abilities to detect leads; only very large leads could be observed (Reference Agnew, Le and ShokrAgnew and others, 1999). however, the enhanced resolution of AMSR-E allows it to detect much Smaller leads. a previous Study demonstrated the ability of AMSR-E to track the formation and evolution of a lead (Reference Rigor and OrtmeyerMeier and others, 2004; Reference MeierMeier, 2005). a Strong divergence event occurred in early march 2004 in the beaufort Sea off the north coast of alaska, resulting in the formation of a large lead between 2 and 3 march, which is clearly Seen in the 89 ghz brightness temperature fields (fig. 2, adapted from Reference Rigor and OrtmeyerMeier and others, 2004, fig. 1). here we attempt to extend the usefulness of AMSR-E by using it to estimate deformation. optimal interpolation was employed to produce motions at a 6.25 km resolution (the original grid resolution of the 89 ghz channel) in the immediate vicinity of the lead, from which deformation was calculated. the deformation field (fig. 2, lower right) clearly Shows divergence in the area of the lead (the grayscale in the deformation inset indicates both divergence and convergence).
Horizontally polarized 89 GHz brightness temperatures for 2 and 3 March (top row) and Sea-ice motion for 2–3 March (bottom row). The region of lead formation is circled in black (light-colored, linear feature). High-resolution deformation estimates for the lead region are overlaid on the motion field on the right; gray colors indicate Small deformation; black indicates large deformation.

Using a Simple lebedev ICE-growth model based on freezing degree-days, 16cm of new ICE was estimated to grow between the opening of the lead on 3 march and 7 march. the geoscience laser altimeter System (GLAs) on the ICE, cloud and land elevation Satellite (ICEsat) is a new Satellite technology that can be used to obtain Sea-ICE thickness estimates. by measuring the freeboard (height of the ICE above the unfrozen ocean Surface) and estimating an ICE density, the thickness can be calculated (Reference Kwok, Zwally and YiKwok and others, 2004). on 7 march, an overflight of the lead by ICEsat/glas occurred. the observed ICE thickness was 15–20cm (Reference Rigor and OrtmeyerMeier and others, 2004, fig. 3), which encompasses the estimate derived from the AMSR-E motions. thus, AMSR-E provides an essential parameter to estimate thin-ICE production, as well as related quantities Such as Salinity fluxes into the ocean and heat/moisture fluxes into the atmosphere with appropriate ancillary data (e.g. meteorological fields).
Same as Figure 2, but for 8 and 9 March.

The lead off the alaskan coast is quite large, approximately 20km across, and would also Show up in SSM/I imagery (though not in the Same detail as in AMSR-E). however, AMSR-E was also able to detect a much narrower lead (one pixel, 6.25 km wide or less) that opened north of banks island between 8 and 9 march (fig. 3). the lead is barely visible in the 89 ghz imagery, but can be Seen in the Sea-ICE motion and in the deformation field.
Because of the interpolation, the details of the deformation fields are likely not accurate in an absolute Sense. also, of course, many leads that occur in the arctic are too Small for AMSR-E to detect. however, AMSR-E yields a general assessment of where deformation is occurring and the qualitative order of magnitude of the deformation, both of which are valuable information for operational ICE analysis. AMSR-E provides Such deformation fields daily over the entire basin, and potentially at a higher frequency if Swath data are used instead of daily average brightness temperatures. this represents an advantage over radarsat and modis, which with their higher Spatial resolution can detect much Smaller leads, but which may not be able to capture the development of leads and ridges on Short timescales due to limitations of Sensor coverage (radar-sat) or clouds (MODIs) (Reference Kwok, Cunningham and YuehKwok and others, 1999, Reference Kwok, Cunningham and Hibler2003).
6. summary and Conclusion
Because of their frequent coverage and all-sky capabilities, passive microwave Sensors have Some Significant advantages over visible/infrared and SAR Sensors. historically, a large drawback of Such Sensors was their low Spatial resolution. AMSR-E represents the most advanced passive microwave Satellite Sensor and is a Substantial improvement over its predecessors. it combines the general advantages of passive microwave Sensors with higher Spatial resolution. AMSR-E has Sufficient resolution to resolve at least moderate-size leads on daily timescales (or better with Swath data) and provides estimates of deformation that are potentially valuable for operational ICE analyses.
The basin-scale, daily observations of important Sea-ICE parameters at reasonably high Spatial resolutions are also potentially valuable for assimilation in Sea-ICE models (Reference Meier, Marquis and KaminksiMeier and others, 2000; Reference Meier, Maslanik and FowlerMeier and maslanik, 2003; Reference Zhao, Liu and LongZhang and others, 2003). the observations will improve information on Small-scale processes that currently cannot be explicitly resolved by Standard Sea-ICE models.
Acknowledgements
Amsr-E and ICEsAT/GLAs data were obtained from the us national Snow and ICE data center (NsIDC). this research was Supported by the nasa distributed active archive center and the naval research laboratory, grant no. N00173-04-p-6210. thanks to t. arbetter of the british antarctic Survey, and m. marquis, m. kaminski, r. weaver and m. Savoie of NsIDC for their assistance.



