1. INTRODUCTION
The Canadian archipelago is a vast area containing an intricate geography of islands, bays and straits. It is remote from the major population base of the country, has limited ground-based infrastructure and experiences harsh environmental conditions. All combine to make the Canadian north a region of considerable challenges.
The Government of Canada has many responsibilities in the Canadian north. For example, these include Search And Rescue (SAR), environmental protection and the monitoring of shipping activities. Defence Research and Development Canada is presently involved in research focused on maximising the exploitation of maritime information for defence, maritime security and safety with considerable attention on the monitoring of vessel traffic (Isenor et al., Reference Isenor, Cross, Webb and Lapinski2013; Lapinski, Reference Lapinski2014; Lapinski and Isenor, Reference Lapinski and Isenor2011; McIntyre et al., Reference McIntyre, Genik, Mason and Hammond2007). This research examines the evolving information sources and the combining of these sources to enhance our awareness of vessel traffic.
The following work is motivated by an overarching research goal to assess current and potential maritime information sources for use in maritime defence and security in the Canadian north. The research in this paper progresses this assessment by examining available information sources and their contribution to surveillance. Surveillance needs are set by requirements of the authority, and the intent of this work is to enlighten the authorities regarding the potential contributions of these sources. We specifically consider wide area surveillance assets that use the vessel-based Automatic Identification System (AIS) and the Long-Range Identification and Tracking (LRIT) system.
This work will focus on Safety of Life at Sea (SOLAS) class vessels (International Maritime Organization, 2002; 1974), that are mandated to carry both AIS and LRIT under certain conditions. There are two objectives:
-
• First, determine if wide-area surveillance data, as represented by Space-based AIS (S-AIS) data, offers sufficient information for surveillance in the Canadian north.
-
• Second, if S-AIS data are not sufficient, how can the additional information provided by LRIT be used to improve surveillance.
These objectives will be met in a way that highlights the trade-offs without assuming that the surveillance needs of the myriad of government departments are the same. Given the multitude of uses for the data, determining update intervals as defined by departmental responsibilities is difficult and beyond the scope of this paper. The remainder of this paper is structured as follows: Section 2 gives background information on the use of Analytical Graphics Incorporated's (AGI's) Systems Tool Kit, STK (formerly the Satellite Tool Kit) and the modelling methods employed, information sources and the analysis methods. Section 3 discusses the results of the analysis and Section 4 presents some concluding remarks.
2. BACKGROUND
2.1. Systems Tool Kit
The AGI Systems Tool Kit (STK) (Analytical Graphics Inc, 2013) is a software package designed to model sensors and communications between multiple platforms. Originally designed for satellite systems, STK is now used to model aircraft, satellites, ground vehicles and ships along with the sensors and communication capabilities of these platforms.
STK allows the user to establish a particular model environment that can include a mixture of platforms and sensors. Collectively, the established environment is referred to as a scenario. The scenario contains scripted motion for all the platforms as well as defined start and end times. The underlying algorithms then model the response of the sensors that are placed on the platforms.
The algorithms representing sensor functionality determine under what conditions the sensor is capable of detecting the other platforms in the scenario. In STK terminology, the detecting platform is the observer while the platform being detected is the target. Access is defined as a sensor on the observer detecting a target.
2.2. Northern Simulator
NorSim is a specially designed plug-in that interfaces with STK. NorSim provides a simplified user interface, specialised data importers and exporters, and additional information algorithms that were specifically designed for maritime vessel traffic. NorSim allows for more rapid development of custom maritime scenarios using pre-configured entities (e.g., ships). NorSim is also meant to simplify generating the access information between the target and observers.
Of particular importance to this investigation are the AIS and LRIT simulation models developed as part of NorSim. The models provide simulated AIS and LRIT broadcasts from the transmission sites (e.g., vessels) in the scenario. Note that the complications of the information flow (e.g., AIS message collision) are not accounted for in this model.
2.3. Maritime Information Sources
2.3.1. Automatic Identification System
AIS was designed for collision avoidance with the goal of ensuring safe navigation (International Maritime Organization (IMO), 2002, 1974; 2015a; International Telecommunications Union, 2014). However, AIS is also a significant contributor to Maritime Domain Awareness (MDA). This contribution can take the form of vessel AIS information contributing to a traffic picture (Eriksen et al., Reference Eriksen, Skauen, Narheim, Helleren, Olsen and Olsen2010) or contributing to vessel pre-arrival warnings provided to independent land-based systems (Isenor et al., Reference Isenor, Cross, Webb and Lapinski2013).
AIS is a self-reporting system, meaning AIS messages are automatic broadcasts of information about the reporting vessel. The reporting interval is dependent on the kinematics of the vessel and/or type of AIS transponder. For example, for a shipborne Class A transponder, the reporting interval is 3 minutes if the ship is anchored or moving slower than 3 knots and ranges from 10 seconds to 2 seconds as the speed increases over 3 knots. In comparison, an aid to navigation transponder should be transmitting every 3 minutes and an AIS base station should be transmitting every 10 seconds (International Telecommunications Union, 2014). These broadcasts are received by other vessels within the local reception range (called a cell) of the broadcast. This reception cell will vary depending on the local environment. However, as a guideline the reception cell can be considered to be line of sight, or 20–40 nautical miles over the surface of the earth.
While individual countries may mandate additional vessels to broadcast AIS, the IMO mandates broadcasts for the following vessel categories:
-
• all ships of 300 gross tonnage and upwards engaged on international voyages,
-
• cargo ships of 500 gross tonnage and upwards not engaged on international voyages and
-
• all passenger ships irrespective of size. (International Maritime Organization, 2015a).
The collection of AIS messages by space platforms (Carson-Jackson, Reference Carson-Jackson2012) has caused an interest in AIS for open ocean MDA. However, satellite collection introduces a complication related to AIS cell size and satellite reception area. The satellite reception area (or footprint) is approximately 3,000 nautical miles in diameter and thereby contains many individual reception cells, which introduces the potential for AIS message collision. Other examples of complications with satellite reception of AIS include loss of signal due to weak transmission power, Doppler frequency shift between transmitter and receiver, interference from terrestrial VHF systems, and Faraday rotation of waves. These and additional complications have been summarised by others (Carson-Jackson, Reference Carson-Jackson2012; Cervera et al., Reference Cervera, Ginesi and Eckstein2011).
Numerous evaluations of S-AIS have been conducted. Statistics (Eriksen et al., Reference Eriksen, Skauen, Narheim, Helleren, Olsen and Olsen2010; Larsen et al., Reference Larsen, Nielsen, Mortensen, Rasmussen, Laursen and Ledet-Pedersen2012) on received messages and extrapolations (Larsen et al., Reference Larsen, Nielsen, Mortensen, Rasmussen, Laursen and Ledet-Pedersen2012) of how many messages have been missed, have been reported. A computer-based simulator was developed and used to predict ship/message probability of detection (Cervera et al., Reference Cervera, Ginesi and Eckstein2011). A test bed was developed to evaluate S-AIS receivers prior to launch (Dembovskis, Reference Dembovskis2012; Re et al., Reference Re, Boissinot, Ginesi and Tobehn2012). An analysis on the best satellite-based AIS communication system set-up given the needs of a target user has also been conducted (Cervera and Ginesi, Reference Cervera and Ginesi2008).
2.3.2. Long Range Identification and Tracking
LRIT provides global identification and tracking of ships for the purpose of state security (International Maritime Organization, 2015b). Cairns (Reference Cairns2005) gives what is now a historical description of the beginnings of long range identification and tracking. The LRIT system applies to a qualifying class of SOLAS ships as specified in an IMO resolution (International Maritime Organization: Maritime Safety Committee, 2006). The qualifying class of SOLAS ships are those on international voyages that are categorised as: “passenger ships, including high-speed passenger craft; cargo ships, including high-speed craft, of 300 gross tonnage and upwards; and mobile offshore drilling units” (International Maritime Organization: Maritime Safety Committee, 2006).
The LRIT system allows for variable reporting intervals of vessel positional information. The default reporting interval is every six hours. The LRIT reports are sent over satellite communication channels to the data centre that represents the flag state of the reporting vessel, their own National, Regional or Cooperative LRIT Data Centres specifically stood-up for the LRIT system.
Using the LRIT distribution plan, the system distributes LRIT information to participating states thereby allowing them to maintain an awareness of vessel traffic in their area of interest. A list of specific rules is available to explain for what reason a governing body can or cannot receive LRIT information (International Maritime Organization: Maritime Safety Committee, 2006).
There are often similarities drawn between AIS and LRIT, mainly because both systems provide vessel positional information (United States Government Accountability Office, 2009). However, the two systems are different in numerous important ways, including:
-
• LRIT data are not available to the public. In this way LRIT can be viewed as a closed system. AIS can be viewed as an open system. The original intent of AIS was that a vessel with an AIS transponder would automatically receive messages from nearby vessels; therefore, AIS data are available to anyone with an AIS receiver.
-
• The LRIT system includes an information management component through the LRIT system architecture.
-
• Since AIS data are available to anyone with a receiver, these data are often considered open to the public and are frequently distributed through public access websites.
-
• The LRIT system was designed with satellite communications in mind. This provides the LRIT system with immediate global coverage without the message collision problems specific to S-AIS.
-
• LRIT reports are only mandated for vessels under SOLAS that are on international voyages, as described earlier. AIS is mandated for a mixture of international and non-international voyages, for certain vessels, as described earlier. (Ships of 300 gross tonnage and above that are engaged on international voyages and passenger ships on international voyages are the only categories where the two mandates overlap.)
-
• The AIS reporting interval is dependent on navigation status, speed, and type of reporting station. The LRIT reporting interval is defaulted to every 6 hours but can be configured to be as small as 15 minutes (International Maritime Organization: Maritime Safety Committee, 2008).
-
• The LRIT system was designed for two-way communication. This allows for a vessel to be polled for their current information and for the remote modification of reporting intervals. Polling is the active retrieval of information from the ship initiated by someone at a remote location. Polling should not be confused with the regular reporting. AIS also provides interrogation capability but such interrogation is limited by line-of-sight to the recipient. According to the specification, such an interrogation results in a generated positional report.
-
• AIS has publicly known security issues such as spoofing (i.e., a counterfeit AIS transmission), AIS hijacking (i.e., altering transmitted information from an actual entity that is transmitting), and availability disruption (i.e., preventing transmission or altering the way an AIS transponder transmits) (Balduzzi et al., Reference Balduzzi, Pasta and Wilhoit2014). LRIT is a managed, closed, system that adds a level of security.
2.3.3. Vessel Traffic Awareness
Enhancing awareness of vessel traffic typically involves using or fusing information from different sources (Dekker et al., Reference Dekker, Bouma, Breejen, Broek, Hanckmann, Hogervorst, Mohamoud, Schoemaker, Sijs, Tan, Toet and Smith2013; Greidanus et al., Reference Greidanus, Alvarez, Eriksen, Argentieri, Çokacar, Pesaresi, Falchetti, Nappo, Mazzarella and Alessandrini2013; Mazzarella et al., Reference Mazzarella, Alessandrini, Greidanus, Alvarez, Argentieri, Nappo and Ziemba2013; Vachon et al., Reference Vachon, Kabatoff and Quinn2014; Vesecky et al., Reference Vesecky, Laws and Paduan2009). Past work has compared S-AIS and LRIT to build this awareness (Carson-Jackson, Reference Carson-Jackson2012; Greidanus et al., Reference Greidanus, Alvarez, Eriksen, Argentieri, Çokacar, Pesaresi, Falchetti, Nappo, Mazzarella and Alessandrini2013; Mazzarella et al., Reference Mazzarella, Alessandrini, Greidanus, Alvarez, Argentieri, Nappo and Ziemba2013). The focus of this paper is to investigate if satellite-based AIS in the Canadian north provides sufficient possibility for building this awareness.
2.4. Analysis Methodology
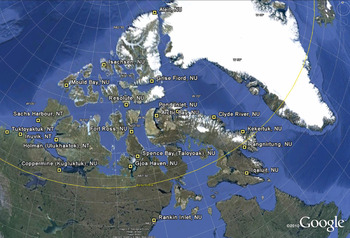
An STK/NorSim scenario was set up that included exactEarth satellites (exactEarth, 2013) collecting AIS data, simulated AIS transmitters located at 20 Canadian ground locations (Figure 1) north of 60° latitude, and realistic terrain. The first goal of the analysis is to assess satellite access behaviour with the AIS transmitters. The AIS transmitters and receivers were modelled through NorSim/STK and therefore access and the absence of access to the satellites are realistically modelled. The access start and stop times for each AIS transmitter are recorded and analysed. It is important to note that the analysis methodology avoids any dependence on AIS transmission rate or the need to analyse AIS messages. The analysis looks at the presence and absence of satellites that constrain S-AIS reception with the assumption that AIS messages will be received by the satellite when it has access to the transmitter. Following this analysis, the results are used to draw conclusions about the conditions when S-AIS data would offer sufficient information for surveillance in the Canadian north and how the additional information provided by LRIT can be used to enhance the surveillance.
Location of 20 AIS transmitters in STK scenario. The placename from the STK database is provided, while the current placename is given in parentheses.

In the cases where multiple satellites have simultaneous access to one location, the net access time is calculated. Alternately stated, when multiple accesses temporally overlap, the net is treated as one access with a start time equal to the earliest access start time and the end time equal to the last access end time. The satellite constellation is treated as a whole.
The 20 locations were chosen from the STK location database and represent a diverse set of locations across the Canadian north. A line of sight model was used to determine when VHF reception of the AIS messages was possible. The 20 stationary locations are intended to give the analysis geospatial diversity across the entire domain, while not being influenced by trajectories of ships. By keeping the transmitters stationary, the details of vessel kinematic trajectories, bathymetry, ice conditions, etc. do not need to be accounted for in the analysis. This helps the study give a broad northern perspective that is independent of vessel motion. Including vessel motion would prohibitively complicate the analysis for little gain.
The modelled scenario covers an eight day period from 26 March 2015 15:00:00 to 3 April 2015 15:00:00 Atlantic Time. Five satellite assets were modelled: AprizeSat-3, AprizeSat-6, exactView-1, Resourcesat-2, and the International Space Station (ISS). All these satellites have low-Earth orbits. AprizeSat-3, AprizeSat-6, exactView-1, and Resourcesat-2 each have inclinations that are approximately 98° which is somewhat retrograde compared to the direction of Earth's rotation. The ISS orbits at an inclination of 51·6°.
As verification of model set-up, data received in an exactEarth data stream from the five satellites were used in a single day comparison (i.e., 2 April) to the windows of access times predicted by the model. The data were from an aid-to-navigation reporting 3160169 in the Maritime Mobile Service Identity (MMSI) field of the AIS message. (They have not included the leading 99 (International Telecommunications Union, 2015)). The aid-to-navigation is located at 74·723222°N, 95·005713°W. Based on analysis of the aid-to-navigation's received AIS messages from August 2014, the aid-to-navigation is transmitting at 10 second intervals. This is unexpected given that an aid-to-navigation is only mandated to broadcast every 3 minutes (International Telecommunications Union, 2014). Agreement was found to be a minimum of 40 seconds for access start, and 20 seconds for access end times, with an average discrepancy of ~3 minutes. Given that the real data was found to align with the simulated access time periods, for the purpose of this study, the agreement was deemed sufficient.
It should be emphasised that the results of this scenario are highly idealised. Since the investigation deals only with access to the satellites, it ignores transmission complications related to hardware malfunction, AIS message collision, and time-lateness (latency) of the messages. Such transmission complications are important to understand, and effectively mean the results presented here are the best case scenario. The simulation also does not consider when satellites are down for maintenance. As a result, the analysis provides an upper bound for the surveillance features in the region. Some insight to the transmission complications, such as message collision and time-lateness characteristics could be gained with an empirical examination of received transmissions, but this is beyond the scope of this initial investigation.
3. RESULTS
3.1. Satellite Constellation Access Time
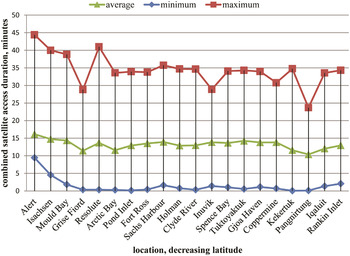
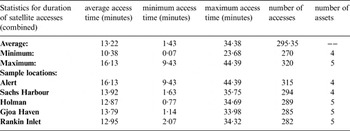
Table 1 and Figure 2 show access times for the ground locations being considered. Note that the ISS never had access to locations north of Holman.
Access time statistics for 20 locations and 5 assets. From left to right, locations are ordered in decreasing latitude.

Combined access time statistics for all locations (upper), with sample locations (lower) listed in decreasing latitude. Five satellite assets are used.

The scenario results indicate that the satellite constellation had access to the AIS transmitters over time periods lasting from a few seconds to 44 minutes in duration. The simulation results (see Table 1) also show a mean combined access time of 13·22 minutes, which is in agreement with the predicted single satellite access duration of 10 to 15 minutes (exactEarth, 2013).
The AIS reporting interval for vessels moving faster than 3 knots is at most 10 seconds for Class A transponders. We note that access intervals shorter than 10 seconds represented 0·07% of all intervals. Access interval durations therefore allow most vessels a chance to broadcast at least one AIS message if the vessel is broadcasting at a 10 second interval or shorter. If vessels are broadcasting at 3 minute intervals (e.g., anchored or docked), the timing of the broadcasts would impact how often space-based AIS receives a position message from the vessel.
Figure 2 plots the mean, minimum and maximum access times for all the locations. The maximum accesses are between 24 and 44 minutes duration. The minimum access that occurred for each location quickly decreases as the locations become more southerly. It is anticipated we are seeing the effect of the satellite orbits in that trend.
3.2. No-Access Intervals
The time between accesses is also an important factor since this time interval indicates when satellites are positioned such that no AIS message could be received. The no-access intervals are usually much larger than the times between AIS message broadcasts, making the no-access intervals more significant to how many AIS messages are received and how often they are received.
The no-access intervals are one contribution to the total temporal gap between AIS messages. A second factor is related to the transit time of a message from a vessel to the user. This is referred to as time-lateness or latency and in this context is defined as the time it takes for the data to move from the vessel, to the satellite, to a ground station, through processing procedures, and ultimately to the end user. This could either shorten or increase the temporal gap depending on the time-lateness of the last AIS messages received before the no-access interval and the time-lateness of the first AIS messages received at the end of the no-access interval. For the simulations described here, time-lateness is not accounted for.
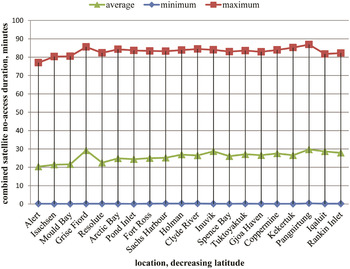
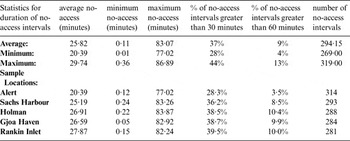
Table 2 and Figure 3 document some of the scenario statistics for the no-access intervals. Of note are the maximums that range from about 77 to 87 minutes, shown in both the table and figure. This is consistent with the satellite orbital periods, which range from 90 to 105 minutes.
No-access statistics for all 20 locations and five assets. From left to right, locations are ordered in decreasing latitude.

No-access statistics for all locations (upper) and sample locations (lower), listed in decreasing latitude, five assets.

Table 2 also shows that the ‘percentage of no-access intervals greater than 30 minutes’ ranges from 28% to 44% for the locations, with a general increase moving towards southerly locations (not shown). The ‘percentage of no-access intervals greater than 60 minutes’ also increases in this fashion, though the percentage does not exceed 13%. This suggests that the number of larger no-access intervals increases with decreasing latitude, indicating that the temporal gaps in AIS collection increase as the locations get more southerly.
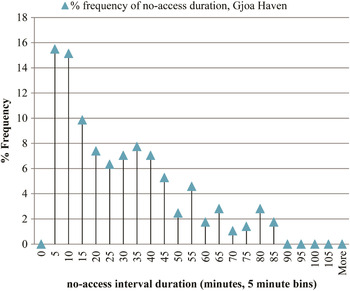
Figure 4 shows the histogram of the no-access intervals for the Gjoa Haven ground location, which had 284 no-access intervals when all five satellites’ accesses are combined. This is a typical histogram, showing a gradual decrease in occurrence-frequency for increasing no-access duration. Almost 39% of these no-access intervals are greater than 30 minutes long (the average over all locations being 37%, seen in Table 2) and accumulate to be approximately 3·8 days of the simulation. In comparison, the no-access intervals between 0 and 30 minutes, accounting for 61% of the intervals, accumulate to approximately 1·5 days of the simulation. Therefore the larger no-access intervals have a greater impact on when data cannot be collected, even though there are fewer such intervals. Note that no site had a no-access interval that exceeded 90 minutes. Also note that the combined no-access intervals for Gjoa Haven add to 5·3 days of the 8 day scenario, or approximately 2/3 of the scenario, with this value typical of other locations.
Histogram of Gjoa Haven no-access intervals, expressed as a percentage, for five assets, using 5 minute bins. Labels on bins correspond to the upper limit of the 5 minute bin. The percentage is over the total number of no-access intervals for the location.

3.3. Decreasing the number of satellites
The simulation results can also be presented for combinations of satellites covering the five to one satellite cases. This is potentially useful since the exactEarth data feed is capable of identifying the individual satellite providing the received AIS message, thus providing a potential filtering mechanism.
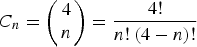
The four-satellite case, as compared to the five, represents an omission of the ISS. This is because the ISS orbit results in zero contribution to nine of the 20 sites. Thus we omit it immediately due to its inability to monitor the entire Canadian north. For the cases representing three, two and one satellite, the ISS is also omitted but all remaining combinations are considered. This results in one five satellite combination, one four satellite combination, four three satellite combinations, six two satellite combinations, and four one satellite combinationsFootnote 1 .
The combinations of satellites are modelled for the five cases. The results from each case are examined by first determining the combination of satellites (for that case) that provide: 1) the maximum number of access intervals over the simulation period, and 2) the maximum net access time. In all but the three-satellite case, the combination producing the two maxima was consistent across the domainFootnote 2 .
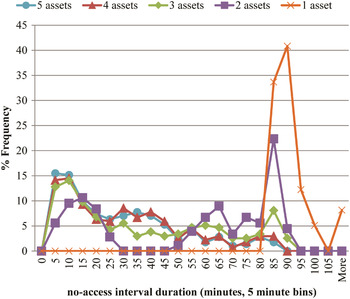
Figure 5 shows the results for the selected combinations, in terms of the time between accesses for Gjoa Haven. The figure shows a near overlap of the five and four asset cases, indicating that the ISS does not contribute greatly to the results for this site. Comparing the five and three asset cases, we see a drop in the frequency of no-access intervals in the 25–50 minute interval, while the 50–90 minute interval shows an increase in the % frequency of occurrence. In the two-satellite case, we see a cluster of no-access values between 0 and 30 minutes and a cluster between 50 and 95 minutes, which is likely caused by the orbit timings of the two satellites. For one satellite, the no-access intervals are predominately within 80 and 105 minutes, the period of the satellite. Note, however, for more than one satellite, given the combinations that were picked that minimised the total no-access time, no interval is greater than 90 minutes. Other combinations could have intervals that were much larger, e.g. greater than 200 minutes.
Percentage frequency of time between accesses for Gjoa Haven, for 5, 4, 3, 2, and 1 assets, using 5 minute bins. The percentage is over the total number of no-access intervals for the location.

Further comparison of the five cases is presented in Table 3 for Gjoa Haven. The results are presented by first setting an arbitrary Time Interval (TI) that represents the required time interval between satellite accesses. The surveillance requirements of the myriad of government departments are not the same, so arbitrary TIs are used here to illustrate the trends as well as the analysis methodology. Based on the simulation results and the TI, the percentage of time intervals exceeding the TI is computed. Finally, the maximum no-access time interval is also determined.
Gjoa Haven simulation results for the selected simulation cases. Percentages indicate the percent of no-access intervals that exceed the TI.

As an example, the Table indicates that in the four-satellite case, 12% of the no-access intervals will exceed 60 minutes in duration. Table 3 indicates, with regards to the simulation, that a TI of 90 minutes can only be achieved by two to five satellites. Given that the maximum no-access intervals, in Table 3, are greater than 80 but less than 90 minutes, 90 minutes is a realistic conservative lower limit of a TI if the end-user only wants to use S-AIS with two to five satellites.
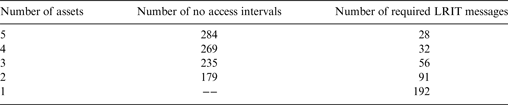
The second objective being addressed in this paper is: If S-AIS data are not sufficient, how can the additional information provided by LRIT be used to improve the surveillance? The percentage of intervals (Table 3) may be combined with the number of intervals to estimate the number of LRIT messages that would be required to meet the TI. Table 4 presents an example for Gjoa Haven. The LRIT messages could be obtained through polling the system during the greater than 60 minute no-access intervals. Alternatively, the LRIT broadcast interval could be set to 60 minutes, but in all but the single satellite case, this would result in unnecessary costs for redundant information. Note that, as indicated by the 192 required reports, a single satellite providing AIS messages for the north is ineffective and thus a single satellite used for S-AIS shouldn't be considered a viable option as a primary means of surveillance, if the end-user's TI is 60 minutes.
Gjoa Haven estimate of the number of polled LRIT messages required to fill gaps in S-AIS, on a per site (i.e., ship) per eight day basis, for 60 minute TI, based on the percentages reported in Table 3. In the one asset case, there were zero no-access intervals that were equal or less than 60 minutes. Therefore setting an LRIT broadcast interval of 60 minutes would be the only reliable solution.

The table may be used to estimate LRIT costs required to meet a specific TI, given that each LRIT report costs a nominal fee. We note that a technical solution to managing such an increase in LRIT polling given the S-AIS no-access interval does not yet exist, but the benefit to vessel traffic awareness might warrant investigation. Note that Table 4 is for one AIS transmitter (i.e., one ship).
This paper has been focused on using S-AIS as the baseline information source. Alternatively, LRIT is an optional primary source of SOLAS class vessel position information for vessels on international voyages (note that Canadian vessels not on international voyages do not need to report). The on-vessel LRIT system has the desirable capability of being remotely configurable to transmit LRIT information at intervals ranging from a minimum of 15 minutes to periods of six hours with only initial human intervention. LRIT could be used as the baseline information to which other information sources are added. Effectively, this is the situation described by the one-satellite case in Table 4. Here, the no-access durations were all over 60 minutes, indicating that to achieve a TI of 60 minutes requires LRIT to be set to a 60 minute reporting rate. S-AIS could be used to augment the LRIT, if required. As LRIT is a government only data stream, any changes to the LRIT reporting rate would have to be arranged through the appropriate LRIT authority.
In the situations where LRIT cannot be configured to report at the end user's TI even though it is capable of doing so (e.g., due to policy or cost), alternative information sources will be required to supplement the LRIT information, when LRIT is being used as the primary source. S-AIS could act as the secondary source in this case. However, as has been shown, for example, in Figures 4 and 5 and Table 2, there is no regimented periodicity to S-AIS access. Using these five satellites, there is essentially a continuum of no-access interval values, unlike with LRIT message broadcasts that are quite regimented. The end-user's TI either needs to be larger than the maximum no-access interval to successfully augment their LRIT information or, for TI's smaller than the maximum no-access interval, the end–user must accept that S-AIS will not always ensure they achieve their TI. Two of LRIT's strengths, which S-AIS does not share, are 1) the aspects related to remotely polling and 2) the ability to set the reporting interval of individual vessels (to a maximum of 6 hours and minimum of 15 minutes). If setting LRIT to the desired TI is not an option or LRIT is not appropriate, then using S-AIS as the primary source is the best option based on this initial investigation. Vessel awareness would be more completely achieved by augmenting S-AIS from multiple satellites with occasional polling of LRIT rather than augmenting LRIT with S-AIS. In a low-traffic area, such as the Arctic, the user can leverage the complementary aspects of both systems to achieve their TI.
4. CONCLUDING REMARKS
The analysis presented here involves a simulated environment involving 20 northern ground locations that transmitted AIS. The results from the eight-day simulation period indicate that when using five satellites, approximately two thirds of the time period has no-access to the AIS source locations. Of the individual intervals, up to 44% can be greater than 30 minutes (Table 2) and can be as large as 90 minutes in duration. For the chosen satellite combinations, as the number of satellites decreases, occurrence-frequency of no-access intervals in the 80 minute to 105 minute range increases. If the no-access interval durations are unacceptable, LRIT provides an information mechanism to augment the AIS. More LRIT polling is required as the number of S-AIS satellites decreases. A technical solution to manage such an increase in LRIT polling given the S-AIS no-access interval might warrant investigation.
Alternatively, LRIT could be used as the primary surveillance mechanism in the Arctic, barring any policy or cost impediments. LRIT has clear functionality advantages (e.g., polling, remote configuration) as compared to AIS.
The analysis of using LRIT and S-AIS together has assumed that the authority is only concerned with the vessels and voyage types that overlap between the two IMO mandates; i.e., ships of 300 gross tonnage and above that are engaged on international voyages and passenger ships on international voyages. Current regulations may not require LRIT broadcasts from all the vessels transiting the north that AIS is mandated to be broadcast from and vice versa. This may be a critical consideration when choosing whether to use S-AIS or LRIT as the primary surveillance mechanism. To achieve the desired vessel traffic awareness in the Arctic for any end-user authority, a balance needs to be found between what has been analysed in this paper, AIS and LRIT costs, the functionality advantages of LRIT, and the differences in mandates between LRIT and AIS. Surveillance needs are set by requirements of the authority, and the intent of this work has been to enlighten the authorities regarding benefits of the two systems.