


Elizabeth by the grace of God Queene of England, do give and graunt to our trustie and welbeloved servant Sir Humfrey Gilbert of Compton … and to his heires and assignes for ever, free libertie and licence to discover, finde, search out, and view such remote, heathen and barbarous lands, countreys and territories … and the same to have, hold, occuppie and enjoy to him, his heires and assignes for ever. (Queen Elizabeth I charter of 1578 to Sir Humfrey Gilbert granting him permission to own all lands he found in North America)
1. Introduction
There seems little doubt that in the past of nearly all countries a great deal of wealth was acquired by means that we would judge unfair. The history of ownership of much of the land of many countries is littered with examples of one group forcibly taking control of areas. Few people would accept that Queen Elizabeth I of England had justice on her side in granting to Sir Humfrey Gilbert (and his half brother Sir Walter Raleigh) the right to ownership in perpetuity of any land he found in America. Backing the winning side in a battle for control of the state – picking the person who would become king – has been a common route to amassing capital. Looting assets from other countries – the Vikings from Anglo Saxon England in the 9th century; King Leopold II from the Congo in the 19th century – has been common. But for many countries these things happened a long time in the past – many decades, often several centuries, ago. Is it plausible that such unfairness in acquisition of assets from the past could still have a material impact on income and wealth today? This paper offers a way of addressing that question. It presents a framework for assessing the extent to which unfairness in ownership of assets in the past affects unfairness in incomes and wealth today. The contribution is, to a large extent, conceptual; it proposes a way of mapping the evolution of aggregate economic injustice over time. The conceptual ideas are used, in conjunction with a fairly standard neoclassical growth model, to generate illustrative results about the conditions under which economic injustice can be relatively short-lived and when it can be very long-lived. The framework used for generating these results is a model of accumulation (of both physical and human capital) and growth. I explore conditions under which unjust acquisition of assets in the relatively distant past can have a lasting, significant effect upon incomes and wealth within countries where unjustly acquired assets were used.
The question I address could be put simply: how much of today’s income – GDP – is a result of economic transactions which are a direct legacy of past unjust acquisition of wealth (or capital)? This question is central to the judgements people make now on the legitimacy of market outcomes that reflect the current pattern of ownership of assets. There is a long tradition of questioning the justice of outcomes in market economies based on the argument that assets were unjustly acquired in the relatively distant past and that this undermines the legitimacy of the distribution of much of wealth and incomes today. This view is exemplified in the work of Marx but finds expression in many (non-Marxist) thinkers; it is one of the justifications for highly re-distributive taxation.
To answer the question requires two things: first, a principle to determine what is, and what is not, just acquisition of wealth or a just source of income; second, a means of using that principle to estimate what fraction of wealth and income today is unjust because it is a direct result of past unfairness. The conceptual contribution is in drawing out the implications of a theory of justice for how the amount of economic injustice evolves over time. I use a principle put forward by Robert Nozick to provide the first of these things. I then use calculations based on models of dynamic asset accumulation and economic growth to illustrate the longevity of past economic injustices in different settings.
Using the conceptual ideas on the transmission of unfairness with a neoclassical model of accumulation I show that in some cases unfairness dwindles over time so that even if the pattern of ownership of assets 100 years ago was dramatically unjust that may have a small impact today. I demonstrate that with any plausible calibration of the simplest version of the model (with a single produced capital good and common savings rates out of labour and capital income) the half life of the effects of many types of unjust acquisition of assets is relatively low. But things can be very different when we consider certain assets – notably human capital – where some parts of the stock could also be considered as having been acquired unjustly. The longevity of injustice is also highly sensitive to heterogeneity in savings rates out of different sorts of incomes, particularly if savings of those with little wealth are consistently very low.
The paper makes four main points:
-
1. The extent to which economic effects of past unjust acquisition of assets lasts into the future is fundamentally different when those assets are expropriated from one group within a country by another within the same country and when the assets cross borders between economies that are not integrated.
-
2. When assets are expropriated by one country from another with which its economy is not integrated the degree to which the effects last in the expropriating country does not depend much on the relative savings rates out of labour income and out of capital incomes of its population. This is very different when assets are taken by one group from another in the same economy.
-
3. One reason why there may be non-diminishing returns in aggregate production to inputs of produced assets is that physical capital and human capital can both be created by past saving; they are both produced assets. Once we allow for human capital, and that some part of it might be financed from unjust incomes, the length of time that injustices in asset acquisition last can be greatly increased.
-
4. The relative importance of low saving rates out of labour income and of produced human capital in production – both of which can generate long-lasting economic injustice – has very likely changed over time and in ways that are offsetting in their impact upon the half life of injustice.
I use international data on the perceived unfairness of economic outcomes to see whether those features which the model implies should influence the durability of injustice help explain cross-country differences today in attitudes towards unfairness.
The issue I address is fundamental to the legitimacy of the pattern of income and wealth today. It has received most attention from philosophers and historians – see, for example, Waldron (Reference Waldron1992), Cohen (Reference Cohen1995), Simmons (Reference Simmons1995), Thompson (Reference Thompson2001) and Linklater (Reference Linklater2013); historians have extensively studied the lasting economic impact of slavery. There is a substantial economic literature on how imposition of institutions by foreign countries can have long run – and damaging – effects on former colonies (see for example Acemoglu et al. Reference Acemoglu, Johnson and Robinson2001, Reference Acemoglu, Johnson and Robinson2002). But the question of whether assets appropriated unjustly have a lasting impact on the income and wealth within the country where those assets are used is a different one. That question of how past unjust acquisition within an economy affects the pattern of income and wealth today is an economic question with significant political and moral implications.
The question of how injustice in the way that assets came to be owned in the past is transmitted into the future is the fundamental conceptual issue and I consider it first. I then illustrate its implications using a model that makes standard assumptions on production technologies and on preferences which generate unique steady states to which an economy converges. This might seem to constrain things so as to guarantee the result that injustice is relatively short-lived. But it turns out that this is not true; half lives of injustice – that is the time taken until the scale of the economic injustice falls to half its initial level after some past unjust acquisition of wealth – need not be low, or even finite.
Yet by ruling out poverty traps for a whole economy which keeps it permanently in a low state of development the model I use may underestimate some types of persistence in injustice. But this criticism does not hold if one applies the results here to the case where the unfairness comes from the unjust acquisition of assets by one group within an economy from another in the same economy but which leaves the aggregate stock of assets used in production unchanged.
I begin with the philosophical issue of what just and unjust ownership of assets might mean. I use principles that draw on Nozick’s ideas to build a framework for modelling how one form of economic injustice evolves. In section 3 I implement the ideas using a model of an economy based on overlapping generations (OLG) where output is produced with capital (both physical and human) and labour. (The details of the derivation of the evolution of assets and incomes from the underlying OLG model is in the Appendix). I consider different assumptions about how (and crucially from whom) assets may have been unjustly acquired in the past and also consider the effects of different savings rates out of different sources of income. I then focus on the significance of human as well as purely physical capital showing what difference that makes to the longevity of injustice. Section 4 presents some provisional empirical evidence on whether contemporary attitudes to economic unfairness are consistent with some of the mechanisms I describe. Section 5 draws conclusions.
2. The notion of just income and wealth
In Anarchy State and Utopia, Robert Nozick (Reference Nozick1974) puts forward three rules for a just distribution of resources:
-
1. Justice of acquisition: If you acquired something justly, then it is just to own it.
-
2. Justice of transfer: If someone who justly owns something freely transfers that property to another, then it is just for that other person to own it.
-
3. Rectification of injustices: If someone unjustly ‘owns’ something (by unjust acquisition or transfer), then the situation ought to be rectified (e.g. by restoring the property to its rightful owner).
The principles, while intuitively plausible, are nonetheless controversial; they locate justice, or fairness, in the process which generated today’s pattern of income and wealth – not by reference to the distribution of resources itself. In essence what the principles imply is that whatever distribution of resources arises from a just distribution by just steps is itself just. Footnote 1 A quintessential example of a just step would be where I offer to work on your land for a day and in exchange we agree you pay me a certain number of dollars; if I use some of those dollars to buy a hammer (freely sold by its legitimate owner) then my ownership of that hammer is just – as would be its ownership by my daughter to whom I subsequently bequeath it, allowing her to establish a successful carpentry business that grows into a multi-million dollar construction company. The Nozick principles are not consistent with other notions of distributive justice – most obviously those put forward by John Rawls (Reference Rawls1999 [1971]), which focus on the distribution of resources and specifically on whether inequality is in the interests of the least well-off group. Rawls looks at the fairness of end states rather than the process by which they came about. More recently work has shown that under some circumstances the conflict between Nozick’s theory and end-state theories of fairness may disappear (Ju and Moreno-Ternero Reference Ju and Moreno-Ternero2018).
Amartya Sen (Reference Sen2009) calls Nozick’s principles (and those of Rawls) an example of a transcendental theory of justice – that is, one that puts forth a single notion of a completely just outcome and which does not allow competing and partially conflicting notions of what is fair. He argues that such transcendental theories do not help much with real world problems of what is better or worse (more or less just). In several essays Cohen (Reference Cohen2011) makes related points as part of a critique of Nozick. The Nozick principles are also clearly not consistent with the idea that unequal outcomes for the distribution of economic resources that reflect factors beyond the influence of individuals are not justifiable (see Dworkin Reference Dworkin2002) – the guiding idea behind so called luck egalitarianism. For theoretical and empirical evidence on the role of luck and the possibility of multiple equilibria in perceptions of unfairness and in fiscal redistribution see Alesina and Angeletos (Reference Alesina and Angeletos2005).
It is, however, not necessary for our purposes to believe that the Nozick principles are an exhaustive (necessary and sufficient) set of conditions to generate just outcomes. You could take a much more pluralistic view of justice – as does Sen – and still accept the central idea used in this paper, namely that if we can agree that some assets have been acquired unjustly the income derived from them is unjust, as is the ownership of assets acquired out of saving from that income. Footnote 2 This principle does not say that this is the only source of unfairness in the distribution of resources. But it does rest on the Nozickian idea that how the distribution of income and wealth came about is central to the notion of justice, or fairness. Merely noting that income and wealth is unequal – or for that matter equal – is insufficient information on which to base judgements on its justice or fairness.
In this paper I rely on the notion that if you acquired something unjustly the income that stems from that asset is unjust, as is the income subsequently earned from assets acquired from saving out of that unjust income. This does not imply that there are no other causes of injustice in distribution besides the lingering effects of past unjustly acquired assets. It does mean that one component of unjust outcomes in the ownership of wealth and incomes reflects past unjust acquisition of assets. Knowing how big that component is of what we might call unjust economic outcomes is significant given the attention it has been paid in discussions of unfairness. Much of the radical critique of the differences in incomes between developed and less developed countries rests on the belief that past imperial appropriation of resources is what has kept rich countries rich.
I focus on the aggregate amount of unjust wealth and income, and its evolution, asking how we should assess how much of today’s total wealth and income is due to ill-gotten gains from the past. I do not focus on how the stock of unjust capital is distributed – it could be that just one tyrant holds it all or that a large proportion of the population used their weight of numbers to dispossess a minority of their assets. It is not clear what one should make of the way in which unjust assets are distributed. Should one count as less unjust a situation where expropriated assets are more, rather than less, equally distributed amongst the expropriators? In focusing on aggregate injustice in overall wealth and incomes this question does not arise. In focusing on aggregates I also do not attempt to model the buying and selling of assets that have in the past been unjustly acquired. It is in the spirit of Nozick to consider such transactions as besides the point if they do not rectify past injustice. The ownership of an asset (and the income from it) that has been unjustly acquired by agent X is not transformed into just ownership by its being bought by agent Y out of income fairly earned by Y. The point is it was not X’s to sell. Creation of new assets from saving out of Y’s legitimate income that might be otherwise indistinguishable from existing assets unjustly acquired in the past is, in contrast, just. The way in which I trace the evolution of just and unjust income and wealth reflects this principle.
Using the Nozick principles, and in the absence of rectification required by principle 3, we can ask how much injustice might there be in today’s income and wealth. Clearly that depends on whether wealth (or capital) used today was justly acquired in the past. There is no doubt that in the past much wealth was indeed unjustly acquired – it is hard, for example, to view the ownership of most land in Tudor England as just when much of it reflected whether powerful families backed one or other challenger to the throne in past armed struggles and of how well the church’s interests matched those of the king. Footnote 3 Ownership of a significant part of the land across large areas of the USA or Australia in the mid 19th century is equally hard to see as being the result of just acquisition – much of it was certainly not acquired in conformity with Nozick’s principles 1 and 2.
Given that capital (including land) was not very justly distributed a century or more ago in many developed economies it is of significance to assess the implications that has for the proportion of income and wealth that is today unjust. In the next several sections I explore that question using the Nozick idea on just and unjust acquisition in a model of asset accumulation and growth in which output is produced with capital and labour which are paid their marginal products. Initially I assume that labour is owned by individuals who always have rights to all the wages and salaries they earn from providing it, Footnote 4 unless some part of capital that boosts wages is stolen from outside the economy. Although this appears unexceptional it is not entirely self-evident – labour income obviously depends on human capital and its acquisition can depend upon income from physical assets that have been unjustly acquired. I return to this issue below and show that it makes a big difference to estimates of the half life of economic injustice. But initially I will assume that all labour income is just in the Nozickian sense – that is that the labour power of anyone is theirs to use as they see fit and that wages earned from hiring it out are rightfully their own. Footnote 5
I ignore the impact of monopoly power. I assume factors get paid their marginal product; it is the ownership of productive factors that is unfair not the way they are compensated. So if oligarchs steal factories and land and oil fields, the returns to those assets is assumed to be the same as if they had been allocated widely across the population. This ignores oligarchs’ influence over the state which might allow monopoly power on pricing. In what follows I assume that institutions are such as to preserve current ownership rights on property (while not rectifying past injustice) and are consistent with factors being paid their marginal products. There are also many other forms of injustice that affect economic outcomes and about which the models used here are silent; discrimination on grounds of race, gender and religion have had a significant impact on the distribution of income and wealth – I focus only on injustice from the past expropriation of assets and not from ongoing discrimination on such grounds.
There is one sense in which the models used here are likely to overstate the half life of injustice. This is because I do not allow for the tax and welfare system to redistribute resources in ways that partially rectify past economic injustices. The question I address is what might be the lasting impact of injustices on the assumption that in competitive markets factors get paid their marginal products without redistributive fiscal policies.
The models I use to illustrate the implications of the principles of the transfer of injustice do not have multiple equilibria; nor is there a role for luck. Both of those things may generate long-lasting unfairness and it might be assumed that by ignoring them (using a model with a unique and stable steady state) one precludes very long-lived effects from historic injustice. This turns out not to be the case. One of the aims of the paper is to explore the conditions under which initial injustice never fades even though an economy might have a unique steady state.
3. Applying the concept of the transmission of injustice – a basic model
A natural way to model an economy where assets vary in cross section, and in aggregate over time, is in a setting with overlapping generations who have accumulated stocks of assets that vary with their age and may be the result of inherited wealth. In the Appendix I use such a model to show the theoretical underpinnings of the aggregate macroeconomic relations I use to study how economic injustice evolves. To do that I use a version of the Blanchard OLG model (Blanchard Reference Blanchard1985) where there is a probability of death in any period that is the same for all agents, denoted d. A concern with the welfare of future generations would mean that people have horizons that stretch beyond the end of their own lives and so I interpret ‘death’ as potentially being about the dynasty (or some part of it) rather than necessarily of an individual. If agents only consider themselves then d might reflect adult mortality; if they consider the dynasty it would be (potentially much) lower. What the Appendix shows is that individuals who optimally chose consumption and saving, taking into account potential concern about future generations, implies decisions which allow straightforward aggregation and generates aggregate saving which is an additive function of aggregate capital income and of aggregate labour income, which is of the form assumed in the models used in this paper.
I assume that aggregate output (income) is a result of combining effective units of aggregate labour input (E) and capital. Effective labour input is a function of raw (innate) labour power (L) and human capital (H). Human capital reflects past investment in education and training; as with physical capital it can depreciate. Output (GDP) at time t is denoted Y t and I assume it is given by the constant elasticity of substitution (CES) production function:
 $${Y_t} = {\left[ {\alpha K_t^\beta + (1 - \alpha )E_t^\beta } \right]^{1/\beta }}$$
 $${E_t} = {\left[ {\eta (H_t^\varphi ) + (1 - \eta )(L_t^\varphi )} \right]^{1/\varphi }}$$
 $$\eta $$
is a share parameter between human capital and innate ability (or raw labour power) in generating effective labour E;
 $$\varphi $$
is a substitutability parameter.
 $$1/(1 - \beta )$$
is the elasticity of substitution between capital (
 $$K)$$
and effective units of labour (
 $$E$$
);
 $$\alpha $$
is a share parameter.
Markets for capital and labour are competitive and factors paid their marginal product. Aggregation from production at the level of individual enterprises is possible and I focus on total output produced from aggregate capital and labour; the fraction of the aggregate stock of factor inputs that has been unjustly acquired is central to the analysis, though such factors are assumed indistinguishable from justly acquired factors in terms of their productivity. Capital is accumulated when gross investment (which equals saving in a closed economy) exceeds depreciation. To keep the capital to effective labour ratio constant net investment must also match the growth in the labour force plus productivity growth. On a balanced growth path the saving rates out of capital income (
 $${s_\pi }$$
) and out of labour income (
 $${s_L}$$
) will be constant, though, as noted above, not in general equal. Since the results on the evolution of aggregate unfairness turn out to be not very sensitive to whether we have reached a balanced growth path, I will assume these two saving rates are constant from now on. Initially I focus on the special case of simple labour power applied to producing income. For the moment setting aside human capital means
 $$\eta = 0$$
so we have:
 $${Y_t} = {\left[ {\alpha K_t^\beta + (1 - \alpha )L_t^\beta } \right]^{1/\beta }}$$
The aggregate effective labour force evolves according to:
 $${L_t} = {L_{t - 1}}(1 + n + g)$$
The share of returns to capital in total output (
 ${\pi _t}$
) is:
 $${\pi _t} = \alpha {({K_t}/{Y_t})^\beta }$$
The share of labour income is
 $$(1 - {\pi _t}).$$
Capital evolves according to:
 $${K_t} = {K_{t - 1}}(1 - \delta ) + {s_\pi }{\pi _t}{Y_{t - 1}} + {s_L}(1 - {\pi _t}){Y_{t - 1}}$$
The interest rate in the economy (
 $${r_t}$$
) is the return to capital net of depreciation, which is:
 $${r_t} = \alpha {({Y_t}/{K_t})^{1 - \beta }} - \delta $$
In a steady state capital, income and the effective stock of labour all grow at rate
 $$n + g$$
and the capital stock satisfies
 $${K_t}(n + g + \delta ) = {s_\pi }{\pi _t}{Y_t} + {s_L}(1 - {\pi _t}){Y_t}$$
The steady state capital to income ratio,
 $${(K/Y)^{ss}}$$
, is:
 $${(K/Y)^{ss}} = s/(n + g + \delta )$$
The steady state level of the capital to labour ratio is:
 $${(K/L)^{ss}} = (s/(n + g + \delta {))^{1/(1 - \alpha )}}$$
where
 $$s$$
is the weighted average of
 $${s_\pi }$$
and
 $${s_L}$$
with weights
 $$\pi ,1 - \pi $$
. In steady state
 $$\pi $$
is constant and so is s. (If
 $${s_\pi } = {s_L} = s$$
or if
 $$\beta = 0$$
then the aggregate saving rate is constant even out of steady state). There is a direct relation between the saving rate and the steady state net rate of return. With an aggregate saving rate
 $$s$$
then in steady state
 $${r_t} = r = \alpha {(s/(n + g + \delta ))^{\beta - 1}} - \delta .$$
When I calibrate the model I choose a value for
 $$s$$
which gives a steady state net of depreciation return that is in line with the empirical evidence and which is consistent with the first order conditions from the OLG model outlined in the Appendix and plausible values for the discount rate (
 $$\rho $$
) and
 $$d$$
.
3.1. Introducing fair and unfair capital
I assume that at some initial time t = 0, the capital stock is made up of a stock of capital which has been unjustly acquired,
 $$K_0^U,$$
and a stock of capital which has been justly acquired,
 $$K_0^J$$
 $${K_0} = K_0^U + K_0^J$$
Let the proportion of capital which has been unjustly acquired be
 $${\lambda _0}$$
so that:
 $$K_0^U = {\lambda _0}{K_0}$$
The ratio of unjust capital to total capital at time
 $$t$$
is
 $${\lambda _t}$$
.
The evolution of the stock of just and unjust capital, and the fraction of income that is unjust, depends on how we view income and saving generated as a result of the original stock
 $$K_0^U.$$
In the following sections I consider several cases, starting with one where unjust capital at time
 $$0$$
has been unfairly acquired from foreigners and brought to the expropriator’s economy to be used. This is a case of expropriation of assets from abroad and the Nozickian principle suggests that the capital and labour income derived from the assets is unjust – as is income from future assets accumulated out of savings from unjust income.
3.2. Assets expropriated from foreigners
If assets are expropriated from foreigners then all the income derived from those assets – the direct return on that capital and the extra labour income generated by that capital – is unjust. In this case it is straightforward to compare how capital and income evolves with and without the unjust capital. Initial unjust capital is
 $${\lambda _0}{K_0}.$$
Initial just income is:
 $$Y_0^J = {\left[ {\alpha {{((1 - {\lambda _0}){K_0})}^\beta } + (1 - \alpha )L_0^\beta } \right]^{1/\beta }}$$
Just capital evolves according to:
 $$K_t^J = K_{t - 1}^J(1 - \delta ) + {s_\pi }{\pi _t}Y_{t - 1}^J + {s_L}(1 - {\pi _t})Y_{t - 1}^J$$
Unjust income is defined as:
 $$Y_t^U = {Y_t} - Y_t^J$$
Unjust capital is simply
 $$K_t^U = {K_t} - K_t^J$$
If we start in a steady state then
 $${K_t}$$
and
 $${Y_t}$$
grow at rate
 $$(n + g)$$
.
In calculating fair income in period
 $$t$$
we are finding the level of output if the productive capital stock was just the fair capital of
 $$(1 - {\lambda _t}){K_t}$$
; if
 $$\beta = 0$$
, fair labour income is
 $$(1 - \pi )(1 - {\lambda _t}{)^\alpha }{Y_t}$$
and fair capital income is
 $$\pi {(1 - {\lambda _t})^\alpha}Y$$
 $$_t$$
. The expressions are similar for the CES when
 $$\beta \ne 0$$
though capital and labour shares will vary over time until we reach a steady state.
The evolution of just output and just capital is exactly as it would be if the unjust capital was all repatriated at time 0. We can compare income and capital with and without repatriation and those ratios tell us how much of today’s capital and income is just – given no historic repatriation.
For
 $$\beta = 0$$
(the Cobb–Douglas case) there is a closed form expression for the ratio of just to unjust capital at time t. If the initial ratio of total capital at time 0 to steady state capital at that time is denoted
 $$\chi $$
then the ratio of unjust capital to total steady state capital at time 0 is
 $${\lambda _0}\chi $$
. For
 $$\beta = 0$$
this means that at time t the ratio of just to total capital (in a continuous time version of the model) is then given by:
 $$\scale 90%{K_t^J/{K_t} = {\left\{ {[(((1 - {\lambda _0})\chi {)^{1 - \alpha }} - 1){e^{ - (1 - \alpha )(n + g + \delta )t}} + 1]/[({\chi ^{1 - \alpha }} - 1){e^{ - (1 - \alpha )(n + g + \delta )t}} + 1]} \right\}^{1/(1 - \alpha )}}}$$
and unjust income to total income at time t is
 $$Y_t^J/{Y_t} = (K_t^J/{K_t}{)^\alpha }$$
In the case of assets expropriated from foreigners and then used in the expropriator’s economy (but not in general) the ratio of unjust income to total income depends only on the overall saving rate and not on the relative magnitude of saving out of capital and income.
Footnote 6
This is no longer true if we treat labour income that depends on past acquisition of unjust capital as itself fair – a case we turn to in section 3.4. In that case the relative size of
 $${s_\pi }$$
and
 $${s_L}$$
turns out to matter a great deal for the rate at which historic unfairness fades.
In the tables below I illustrate how just and unjust capital shares and income shares evolve given some specific values of key parameters. Those parameters are chosen to match broad features of developed economies. Before presenting the results I describe how the parameters are set.
3.3. Calibration of parameters for estimates of half lives of injustice
 $${\bf{n}}:$$
US population rose at an average annual rate of around 1.2% in the 100 years from 1911 to 2011. It has grown slightly more slowly recently. For other developed economies (large European economies and Japan) population growth over the past 100 years has been slower than in the US and averages near 0.5% a year. I set population growth at 0.5% a year in the base case and also show the impact of faster growth.
 $${\bf{g}}$$
: Annual growth in labour productivity in many developed economies over the past century has averaged around 2%. But it has slowed recently. In the base case I take labour productivity growth of 1.5% and also show the impact of higher and lower growth.
δK : On a steady state growth path
 $${\delta _K} = ({I^k}/K) - (n + g).$$
Using US data on the average ratio of non-residential capital investment to the non-residential capital stock since 1929, and using the values of
 $$n + g$$
as above, implies a depreciation rate of just above 6%. For the USA Davis and Heathcote (Reference Davis and Heathcote2005) use a quarterly value for depreciation of business capital of 0.0136 (annual of around 5.4%). Depreciation on non-residential capital of around 6% seems plausible. Residential property depreciates at lower rates. As with non-residential physical capital, on a steady state growth path the depreciation of residential capital is given by the investment to capital stock ratio minus
 $$(n + g).$$
Using US data on the average ratio of residential capital investment to the residential capital stock since 1929, and using our values of
 $$n + g$$
as above, implies a depreciation rate of only around 1.25% a year. This seems slightly lower than estimates based on the difference between gross and net US residential investment which give a figure near 2%. Depreciation of residential structures at 2% a year looks plausible. Land used for residential and other commercial purposes has a lower depreciation rate, but it is probably not zero. Agricultural land will become much less productive if not maintained so its depreciation rate is not zero but likely lower than for residential property. Overall a weighted average of depreciation on all physical capital (including land) might plausibly be between 2% and 4%. I take 3% as a central value and I also consider higher and lower values.
α : I set
 $$\alpha $$
(the share parameter in the production function) to the typical share of capital in private domestic value added in developed economies in recent years. This figure is around 0.3 (Rognlie Reference Rognlie2016).
Using these figures for
 $$\alpha ,n,g,\delta $$
we can assess what rate of saving
 $$s$$
is needed to generate a rate of return,
 $$r$$
, which is plausible given the historical evidence. In our model all assets (land, non-residential capital, structures, housing) generate the same return. Jordã et al. (2019) provide data on the real returns on a range of assets, including claims on corporate assets (equities and bonds), over the period 1870–2015 for 16 advanced economies. Returns on equities and housing look similar and average about 7% a year – though they are a little lower pre-1950. Bonds generate a lower real return which averages about 2.5% over the whole sample. The equally weighted average of the real return of these three asset classes is close to 6%. Returns on land used for non-residential purposes are likely to be lower. A figure of 5–6% seems reasonable for the past weighted average of returns on all real assets. I use a figure of 5%. The evidence that
 $$r \gt g$$
is powerful. Despite the claims (most notably by Thomas Piketty) that this generates a rising share of capital income there is no reason that this must happen and it is not a feature of the models used in this paper (nor indeed of most models of growth).
If the net return is 0.05 and
 $$\delta = 0.03$$
, we require a saving rate to satisfy:
 $$0.05 + 0.03 = \alpha {(K/Y)^{\beta - 1}} = \alpha {(s/(n + g + \delta ))^{\beta - 1}}$$
. For
 $$\beta = 0$$
this implies
 $$s$$
= 0.1875 and steady state
 $K/Y$
is 3.75. That saving rate
Footnote 7
is a little below the OECD countries’ average gross capital formation rate relative to GDP since 1960 and also a little below that ratio for the USA (both average close to 22% over the period 1960–2017). The implied ratio
 $$K/Y$$
is a little low for a comprehensive measure of physical assets. But when we vary
 $$\beta $$
, and adjust
 $$s$$
to hit the same target for the rate of return, the model generates much higher values for steady state
 $$K/Y$$
.
3.4. Results – assets expropriated from abroad
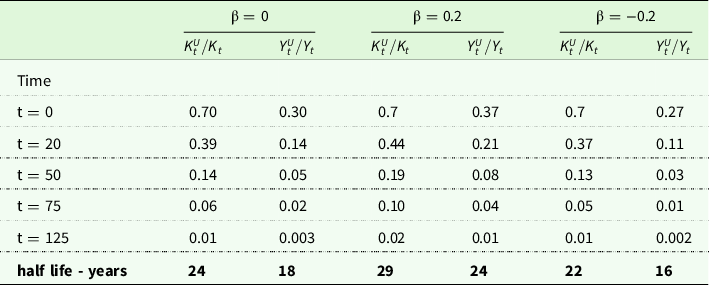
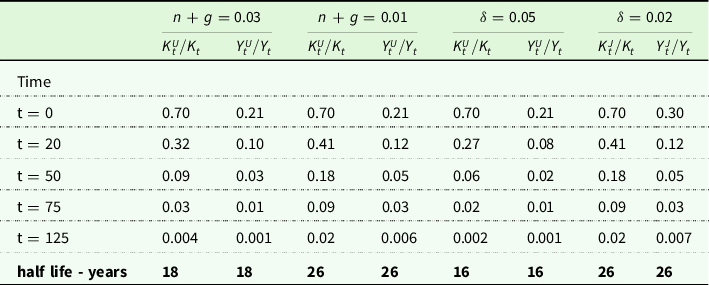
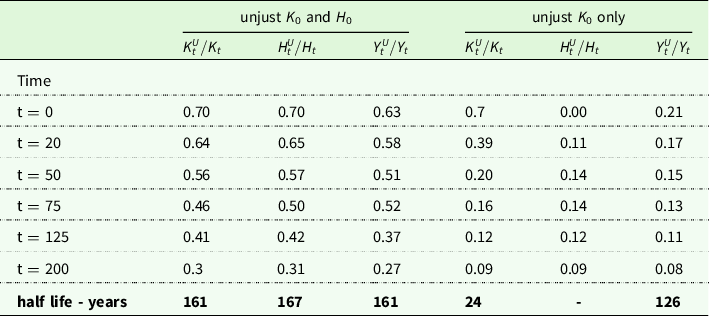
Table 1 shows the evolution of unjust capital and incomes using the calibration strategy described above (where saving out of all income is at rate 0.1875 to generate
 $$r$$
= 0.05) and assuming an initial (
 $$t = 0$$
) high level of unjust capital relative to total capital. We set that at 0.7, but this is illustrative in the sense that it is the rate of decay of injustice that matters which is almost independent
Footnote 8
of the initial value of
 $$\lambda .$$
The half-life figure is in no case meaningfully affected by the assumed initial level of unjust wealth. Although the value of
 $$K_t^U/{K_t}$$
at some initial point is illustrative and the half lives, which are shown in the final row, are not affected by it, the choice of 0.7 might still seem implausibly high. But consider just two historic examples: between the years 991 AD and 1016 AD, during the reign of Saxon King Aethelred II (‘Aethelred the Unready’), bribes to pay off invading Vikings that amounted to around £225,000 seem to have been paid. This Danegeld has been estimated at around 60% of annual English GDP (Cohen Reference Cohen2018). Nine hundred years later, between 1885 and 1909, King Leopold II of Belgium raided the vast Congo area for commodities using immense violence to create a personal fortune that has been estimated at $500 million. Others shared in the plunder which in aggregate was plausibly of the same order of magnitude as annual Belgian GDP (Hochschild Reference Hochschild1999; Buelens and Marysse Reference Buelens and Marysse2009).
Assumes a common saving rate out of capital and labour income to deliver r = 5% at a depreciation rate of 0.03; n = 0.005; g = 0.015; half life is the number of years to reduce injustice to half its initial value

When
 $$\beta = 0$$
unfairness declines fairly quickly. After 50 years the proportion of capital that is unjust falls to 20% of its initial level (from 70% of total capital to 14%). The half life of capital injustice – the time taken for the share of capital that is unjust to fall to half its initial value – is 24 years. The half life of economic injustice – that is the time taken for the proportion of GDP that is unjust to fall to half its initial value – is 18 years.
Footnote 9
The lower is the elasticity of substitution (more negative is
 $$\beta $$
) the smaller is the steady state capital ratio, saving rate and share of capital income in GDP. Not surprisingly the impact of unjust capital ownership on income is correspondingly lower. The opposite is true if the elasticity is higher (the more positive is
 $$\beta $$
). What accounts for the impact of varying
 $$\beta $$
is that because we vary the saving rate to generate the same rate of return (aligned to historic data at 5%) we get a shift in the shares of capital and labour. At
 $$\beta = 0.2$$
(elasticity of substitution of 1.25) the profit share is around 42% of GDP and the capital to income ratio is 5.2; at
 $$\beta = - 0.2$$
(elasticity of substitution of 0.83) the profit share is 24% and the capital output ratio is 3. Table 1 shows that the effects of varying
 $$\beta $$
are not trivial. At an elasticity of substitution of 0.83
 $$(\beta = - 0.2)$$
the share of unjust income at 50 years on from a point where 70% of capital was unjust is around 3%; at an elasticity of 1.25 (
 $$\beta = 0.2$$
) it is nearly three times as great at just over 8%. But elasticities of substitution a long way from 1 generate implausible levels of the capital to income ratio and of required savings rates for a steady growth path with a rate of return of around 5%. Evidence on the elasticity of substitution is mixed on whether it is above or below 1 (see Blume and Durlauf Reference Blume and Durlauf2015). Karabarbounis and Neiman (Reference Karabarbounis and Neiman2013) estimate it as 1.25. But that estimate is high relative to Chirinko (Reference Chirinko2008), or León-Ledesma et al. (Reference León-Ledesma, McAdam and Willman2010). Unless the elasticity is a long way above 1 it does not have a big impact and after 80 years unjust income always shrinks to very low levels.
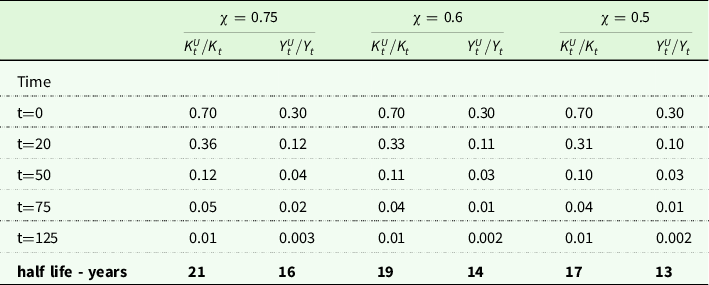
Table 2 shows the impact of starting from a position with overall capital well below the steady state level relative to income. This has a negligible impact on the rate of decay of injustice.
Assumes a common saving rate to deliver r = 5% at depreciation rate of 0.03; n = 0.005; g = 0.015. Cobb–Douglas case

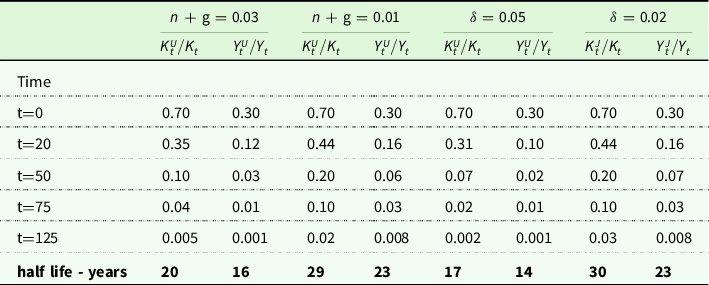
Table 3 varies the value of
 $$n + g$$
and, separately, varies the depreciation rate
 $$\delta .$$
These have more of an impact on the decay of injustice than whether we start from a steady state capital to income ratio. Faster (slower) growth of the effective labour force and higher (lower) depreciation both accelerate (slow down) the decay in injustice. But in all cases injustice remains small after 70 years.
Assumes common saving rate to deliver r = 5%. For the cases n+g = 0.03 and n+g = 0.01 I set the depreciation rate at 0.03. When depreciation is at either 0.05 or 0.02 I set n+g = 0.02. Cobb–Douglas production

The conclusion to be drawn from Tables 1–3 is that when capital is expropriated from foreigners and taken back to the expropriator’s country, the half life of the resulting injustice (where injustice is the extra income and wealth enjoyed by the expropriator) may be relatively short – a few decades rather than a few centuries. Things are different when assets are expropriated from one group by another within the same country – the case we consider in the next section.
How plausible is it that the effect on the wealth and income of the country that loots assets on a vast scale should have dwindled so much in a few decades? The looting of assets by King Leopold II of Belgium was on a vast scale. It has left to future generations of Belgians several fine public buildings in Brussels, Ostend and Antwerp. But the extent to which the current high standard living of the Belgians is dependent on those assets seems likely to be small. The lasting impact on the Congo of the immense violence and looting of the late 19th century may, however, have been far greater; such asymmetry has potentially significant implications for questions of reparations. Belgium today may not be much richer because of assets looted from Congo in the 19th century, but the dire poverty of the Democratic Republic of Congo today may be a lasting effect of that. More generally, colonization was very different in different countries and the extent to which the people in former colonial powers now enjoy higher living standards because of events in their colonial past could vary greatly. But the results in this section imply that such effects may be small if empires were gone more than 75 years ago.
3.5. Expropriation by one group from another within the same country
Unjustly acquiring assets from foreigners and taking them home is probably historically of less economic significance than getting them from people who continue to live and work in the same place as the assets remain – in most cases neither the people from whom assets are unjustly acquired nor the assets themselves may move far, though the income from them may do so. In the case of imperial acquisitions the capital – often largely in the form of land, buildings and infrastructure – was rarely sent back to the imperial power though the income derived from using it, usually with labour from the colony, often was. In that case to count as unjust part of labour income of those whose wages are higher because they combine their labour with unjust capital (relative to what it would be if that capital was removed) is not reasonable. If someone steals my land and my horse and plough, and I am forced to work as a paid hand on what was my land guiding what was my plough pulled by what was my horse, then it cannot be right to say that the part of my wages due to my being able to work with that land and capital is unjust. In this case instead of counting as unjust all income that depends on such capital (as is done in the calculations above and as may be appropriate when that capital was legitimately the property of people outside the economy who are deprived of its use) it is more appropriate to count as unjust only the income derived directly from ownership of that capital – including income earned on any additions to capital from saving the capital income on unjust assets. This means the evolution of unjust capital depends positively on the saving rate out of capital income but not on the saving rate out of labour income.
In allowing for this I will now assume that initial total capital (the sum of just and unjust capital) is at the steady state level since the results above show that the evolution of unfairness is insensitive to whether total capital is initially below the steady state level. So now initial unjust capital is a fraction
 $${\lambda _0}$$
of initial steady state capital (
 $$K_0^{ss}$$
):
 $$K_0^U = {\lambda _0}K_0^{ss}$$
. Just capital at time t =
 $$0$$
is
 $$(1 - {\lambda _0})K_0^{ss}$$
. The evolution of unjust capital is given by:
 $$K_t^U = K_{t - 1}^U(1 - \delta ) + {s_\pi }{\lambda _{t - 1}}({\pi _t}{Y_{t - 1}})$$
The share of profits in GDP is
 $${\pi _t} = \alpha {({K_t}/{Y_t})^\beta }$$
. Since we start in a steady state the overall capital-income ratio
 $$({K_t}/{Y_t})$$
is constant at
 $$s/(n + g + \delta )$$
. The aggregate saving rate,
 $$s$$
, is a weighted average of
 $${s_\pi }$$
and
 $${s_L};$$
the share of capital income,
 $$\pi $$
, is constant at
 $$\alpha {(s/(n + g + \delta ))^\beta }$$
. Substituting this into the previous equation, noting that
 $${K_{t}}/{K_{t - 1}} = n + g$$
and simplifying allows us to write the evolution of the ratio of unjust to total capital stock as:
 $${\lambda _t} = {\lambda _{t - 1}}\left[ {(1 - \delta ) + {s_\pi }\alpha {{(s/(n + g + \delta ))}^{\beta - 1}}} \right]/(1 + n + g)$$
If
 $${s_L} = 0$$
then
 $$s = \pi {s_\pi }$$
. Using
 $$\pi = $$
 $$\alpha {(s/(n + g + \delta ))^\beta }$$
in the previous equation implies that when
 $${s_L} = 0$$
 $${\lambda _t} = {\lambda _{t - 1}}$$
. So in the extreme case of zero saving out of labour income there is never any reduction in injustice. This makes intuitive sense: when some part of capital is unfairly appropriated by one group within the economy from another within the same economy it does not affect wages and does not make some part of labour income unjust. It affects the fairness with which total capital income is allocated. If there is no saving out of labour income, capital is only accumulated out of capital income and since initially a fraction of that
 $${\lambda _0}$$
is unjust (and saving from the income on such capital replaces a fraction
 $${\lambda _0}$$
of worn out capital in steady state) the share
 $$\lambda $$
never falls. But so long as
 $${s_L} \gt 0$$
then
 $$\lambda $$
will fall over time.
Just income is now defined as total labour income plus that part of total capital income that is the share going to owners of just capital
 $$((1 - {\lambda _t}){\pi _t})$$
. The evolution of the share of just income is governed by:
 $$Y_t^J/{Y_t} = (1 - {\lambda _t}){\pi _t} + (1 - {\pi _t}) = (1 - {\lambda _t})\alpha {(s/(n + g + \delta ))^\beta } + (1 - {\pi _t})$$
For the special case of
 $$\beta = 0$$
and a common saving rate
 $$(s = {s_\pi } = {s_L},\beta = 0)$$
the process for
 $$\lambda $$
simplifies to
 $${\lambda _t} = {\lambda _{t - 1}}\left[ {(1 - \delta ) + \alpha (n + g + \delta )} \right]/(1 + n + g)$$
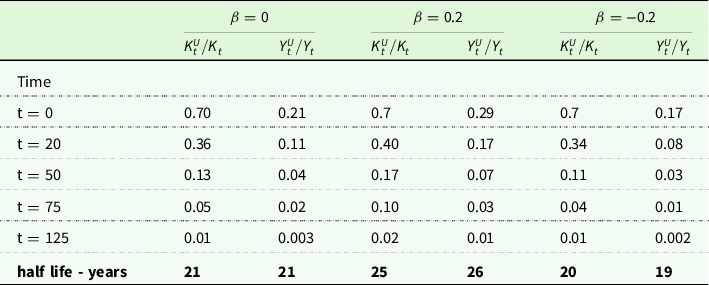
Table 4 shows the evolution of unjust capital and income for three values of
 $$\beta .$$
As before we assume that the overall saving rate is sufficient to generate a net of depreciation return on capital of 5%. Table 5 shows the impact of varying the value of
 $$n + g$$
and of
 $$\delta $$
. In Tables 4 and 5 I set
 $$\;{s_\pi } = {s_L}$$
Assumes a common saving rate out of capital and labour income to deliver r = 5% at depreciation rate of 0.03; n = 0.005; g = 0.015

Assumes common saving rate to deliver r = 5%. Cobb–Douglas production. For the cases n+g = 0.03 and n+g = 0.01 I set the depreciation rate at 0.03. When depreciation is at either 0.05 or 0.02 we set n+g = 0.02

Comparing Tables 4 and 5 with Tables 1 and 3 shows that if we assume
 $${s_\pi } = {s_L}$$
there is a somewhat faster decline in unfairness in the ownership of capital when the labour income from working with unjust assets is itself considered just compared with a situation where that part of labour income reflecting the use of unjust capital is itself unjust.
But things look very different when
 $${s_\pi } \gt {s_L}$$
. Varying the ratio of saving out of capital income to saving out of labour income matters since all saving out of labour income generates fair capital and fair future income and that is not true of all saving out of capital income.
Footnote 10
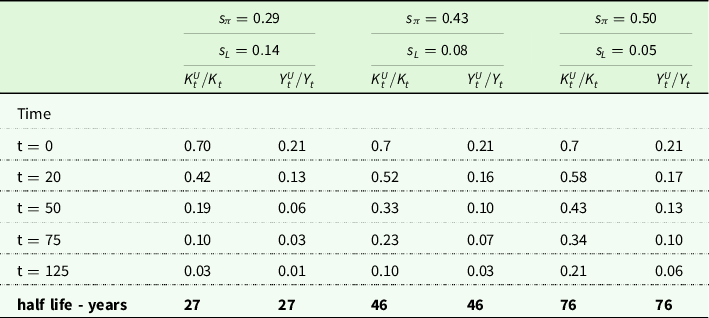
Table 6 shows the evolution of unfairness when the saving rates on capital and labour income differ significantly. I set the weighted average saving rates so that in steady state they still consistently deliver an amount of capital to generate a net return on capital of 5%. For the Cobb–Douglas case this requires an overall gross saving rate of 18.75%. Table 6 shows the Cobb–Douglas case with a constant capital share of
 $$\alpha = 0.3$$
and so we require that
 $$0.1875 = s = \alpha {s_\pi } + (1 - \alpha ){s_L}$$
. Results are similar when
 $$\beta $$
is somewhat above or below zero and within ranges suggested by the evidence.
The weighted average saving rate is so as to deliver r = 5%. Cobb–Douglas production

Table 6 shows that when saving out of capital is much higher than saving out of labour income the impacts of an initial level of unjust capital can last much longer. When
 $${s_\pi } = 0.43;{s_L} = 0.08$$
the half life of injustice is 46 years, more than twice as high as when
 $${s_\pi } = {s_L} = 0.1875.$$
If the saving rate out of capital income is 10 times that out of labour income the half life rises to 76 years. Even then after 100 years unjust shares – even if they start at 70% of total capital – have fallen a great deal so that unjust capital is down to around 25% of total capital and unjust income is around 8% of GDP. Provided there is a non-trivial amount of saving out of labour income, unjust capital will dwindle a great deal in a few generations. It is plausible that today such saving is indeed non-trivial. Pension arrangements mean that many workers in recent decades automatically make contributions out of labour income; one could also interpret some part of taxes out of labour income as helping accumulate (or preserve) public sector assets such as roads, parks, schools and hospitals. Although we do not model taxes and public spending explicitly one can see some part of overall national saving and asset accumulation as reflecting tax financed government saving. Since labour income taxes raise a substantial part of total tax revenue this means that saving out of labour income is of significance even if direct saving by workers were to be small. In fact such direct saving – even putting to one side pension contributions – is clearly not small since many households build up ownership of housing out of paying off mortgage debt largely from labour income; the housing stock in developed economies is substantially financed out of saving from owner occupiers – a group making up 60–70% of households in most economies in recent decades. In the more distant past many more people who relied only on their wages struggled to make ends meet and their saving rate was likely lower; because of that the half life of injustice was greater. But whether the half life of injustice is really much lower in the modern, developed world depends also on the significance of human capital, an issue I turn to in the next section.
3.6. Human capital
We now take account of human capital. I show that if human capital is a significant part of the overall stock of productive assets it can have a very material impact on how long-lasting are the effects of injustice in the distribution of assets in the past. In the illustrative calculations above we made no allowance for the distinctive nature of human capital. That may have been appropriate for economies in past centuries where the human capital of the vast majority of the workforce was low. But it is a poor assumption for modern economies. Much of human capital is the result of people using their own time to study. There is no question that this element of human capital is justifiably their own – according both to common sense and Nozick’s principles; there is as much a claim to the fruits of that human capital as there is to that of innate ability. But some significant part of human capital formation is due to other resources used – computers, books, school buildings, university laboratories, and the labour of teachers. To maintain consistency with the treatment of physical capital, that part of human capital formation that reflects saving from income is unjust to the extent that such income is unjust. I now explore the implications of that idea.
When
 $$\eta \gt 0$$
human capital matters for production and for incomes, and the substitutability between human capital and labour hours (
 $$\varphi $$
) also matters. As with physical capital, the stock of human capital has just and unjust parts:
 $${H_t} = H_t^U + H_t^J$$
Here I follow Mankiw et al. (Reference Mankiw, Romer and Weil1992) in using a model for the evolution of human capital that has the same structure as that for physical capital. Thus I assume the evolution of
 $$H_t^U$$
and
 $$H_t^J$$
follows:
 $$H_t^U = (1 - {\delta _H})H_{t - 1}^U + {s_H}Y_{t - 1}^U$$
 $$H_t^J = (1 - {\delta _H})H_{t - 1}^J + {s_H}Y_{t - 1}^J$$
 $${\delta _H}$$
is the depreciation rate for human capital;
 $${s_H}$$
is the saving (or investment) rate out of income for the accumulation of human capital. I assume the saving-investment rate into human capital is the same out of labour income and out of capital income.
Denote the share of human capital that is unjust as
 $$\lambda _t^{UH} = H_t^U/{H_t}$$
. The share of physical capital that is unjust is denoted by
 $$\lambda _t^{UK} = K_t^U/{K_t}.$$
I focus on steady states where the growth of
 $Y,H$
and
 $$K$$
are all at rate
 $$n + g$$
. I shall assume for the moment that saving to accumulate physical capital is at the same rate out of all income at rate
 $$s$$
(so that
 $${s_\pi } = {s_L}$$
); the depreciation rate of physical capital is denoted
 $${\delta _K}$$
(until now this has been denoted by
 $$\delta $$
but we now want to distinguish it from the depreciation rate of human capital).
In steady state
 $$H/Y = {s_H}/({\delta _H} + n + g);K/Y = s/({\delta _K} + n + g);$$
shares of capital and of labour (i.e. the income share of the effective labour force
 $$E$$
) are then constant at
 $$\pi ,1 - \pi $$
where
 $$\pi = {\alpha(k/y)}^\beta=\alpha{(s/\delta_K+n+g))^\beta}$$
Unjust and just income are given by:
 $$Y_t^U = \left[ {\theta \lambda _t^{UH}(1 - \pi ) + \pi \lambda _t^{UK}} \right]{Y_t}$$
 $$Y_t^J = \left[ {(1 - \theta \lambda _t^{UH})(1 - \pi ) + \pi (1 - \lambda _t^{UK})} \right]{Y_t}$$
where
 $$\theta $$
is the share of returns to human capital in the overall remuneration of the effective stock of labour and is constant in steady state. (In the Cobb–Douglas case for the stock of effective labour
 $$\varphi = 0;$$
 $${E_t} = (H_t^\eta L_t^{1 - \eta })$$
and
 $$\theta = \eta $$
). I assume here that the part of labour income that is a return to innate ability (
 $$(1 - \theta )(1 - \pi )Y$$
) plus that part due to justly acquired human capital (
 $$\theta (1 - \lambda _t^{UH})(1 - \pi )Y$$
) are just; the remainder of labour remuneration (
 $$\theta \lambda _t^{UH}(1 - \pi )Y$$
) is unjust.
It is straightforward to show that in this economy the evolution of
 $$\lambda _t^{UH};\lambda _t^{UK}$$
is given by:
 $$\scale 90%{\lambda _t^{UK} = \left[ {\lambda _{t - 1}^{UK}(1 - {\delta _K} + \pi ({\delta _K} + n + g)) + \theta \lambda _{t - 1}^{UH}(1 - \pi )({\delta _K} + n + g)} \right]/(1 + n + g)}$$
 $$\scale 90%{\lambda _t^{UH} = \left[ {\lambda _{t - 1}^{UH}(1 - {\delta _H} + \theta (1 - \pi )({\delta _H} + n + g)) + \lambda _{t - 1}^{UK}(\pi )({\delta _H} + n + g)} \right]/(1 + n + g)}$$
This is a homogeneous system of first order linear difference equations. Both of the eigenvalues of this simultaneous difference equation system are less than one provided that
 $$\theta \lt 1,$$
in which case from any initial state of injustice – assuming no new exogenous shocks to injustice – unfairness eventually declines to zero. But the rate of decline of injustice is sensitive to the proportion of the effective stock of labour that is accounted for by human capital.
As was the case without human capital, the half life of injustice depends on shares of capital and labour in income; it is also a decreasing function of depreciation rates and the growth of the labour force (
 $$n$$
) and of exogenous (non human capital related) labour productivity growth (
 $$g$$
). In addition the split between returns to human capital (
 $$H$$
) and innate ability (
 $$L$$
) now matters.
The properties of the decay rate of injustice are illustrated in the tables below. To construct these we use the same parameter estimates for the common variables we introduced above (
 $$\delta ,n,g)$$
and assume Cobb–Douglas for the outer production function combining capital and labour (
 $$\beta = 0).$$
The new parameters once we introduce human capital are:
 $${\delta _H},\eta ,\varphi ,$$
 $${s_H}.$$
I now briefly describe how they are set.
 $${\delta _H} - $$
a lower limit might be (1/life expectation) i.e. about 0.0125; but much human capital is acquired later in life and some things you learn are quickly forgotten (though unlike physical depreciation
 $${\delta _H}$$
is plausibly lower the more you use H). I set
 $${\delta _H}$$
equal to either 0.02 or 0.04, either side of the assumed rate of deprecation of physical assets (which I now keep constant at 0.03 for all simulations).
 $${\delta _H} = 0.02$$
would mean that some productivity enhancing skill learned at age 20 would dwindle to half its effectiveness by age 54, unless topped up by re-training; if
 $${\delta _H} = 0.04$$
it would fall to half its effectiveness by age 37.
 $${s_H} - $$
Based on OECD measures of ever-widening definitions of spending on education and training, plausible limits for
 $${s_H} $$
might be 0.05 and 0.15. The choice of
 $${s_H}$$
should be consistent with a plausible ratio of
 $$H/K.$$
Mankiw et al. (Reference Mankiw, Romer and Weil1992) quote an estimate that around one half of the US capital stock was human capital. They also argue that between 50% and 70% of total labour income represents a return to human capital. With a labour share of total income of around 70% that would suggest returns to human and physical capital might be the same order of magnitude. For given
 $${s_H},{\delta _H}$$
we have the steady state
 $$H/Y = {s_H}/({\delta _H} + n + g).$$
If
 $$K/Y$$
is around 4 and
 $$H$$
and
 $$K$$
are comparable in size, this means that with
 $${\delta _H}$$
= 0.02 we would need
 $${s_H}$$
to be near 16%; if
 $${\delta _H}$$
= 0.04. the saving rate for human capital out of total income would need to be 24%. These saving rates into human capital formation seem high – OECD data on total education spending in schools, colleges and universities plus estimated spending on training at between 5% and 10% of GDP for most developed countries – so I also explore implications of much lower values for
 $${s_H}$$
.
I initially set parameter
 $$\eta $$
so as to generate a steady state net of depreciation return to human capital at the same rate as the return on physical capital – a level we have set to 0.05. This implies:
 $$\eta = (0.05 + {\delta _H})(H/E{)^{1 - \varphi }}/\left[ {(1 - \alpha )Y/E)} \right]$$
The share of human capital in total labour remuneration is:
 $$\theta = \eta {(H/E)^\varphi } = (0.05 + {\delta _H})(H/Y)/(1 - \alpha ) = {s_H}(0.05 + {\delta _H})/(({\delta _H} + n + g)(1 - \alpha ))$$
Note in this case where
 $$\beta = 0,$$
 $$\alpha $$
is the share of profits in income. Thus a key parameter for the evolution of unfairness, namely
 $$\theta $$
the share of human capital returns in total labour remuneration, depends only upon the share of returns to capital in income, saving for human capital and its rate of depreciation, and
 $$n + g.$$
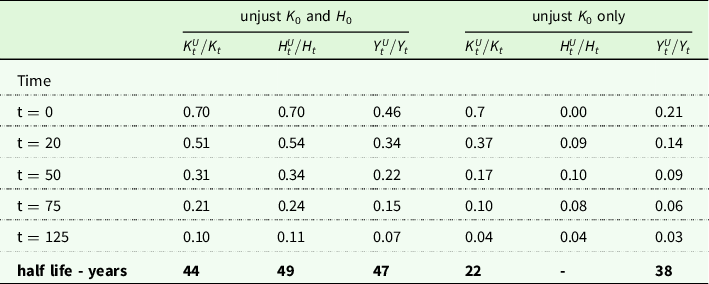
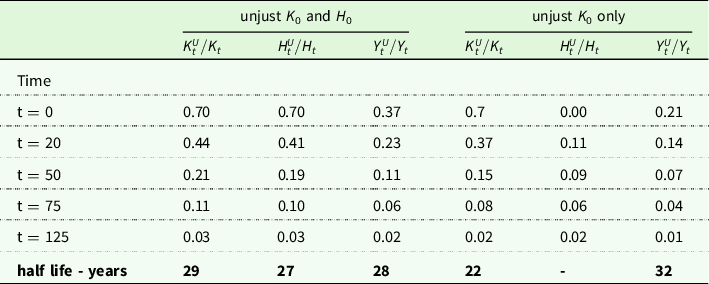
Tables 7–9 show results for the rate of decay of unfairness when some part of the stocks of both physical and human capital might have been unjustly acquired. Initially I assume that there is a common return on all capital – human and physical – at a net of depreciation rate of 5%. Table 7 uses a high value for
 $${s_h}$$
(0.2) and a relatively low value for
 $${\delta _H}$$
(0.02). This generates a share of returns to human capital in total labour remuneration of 0.5. Table 8 uses a higher depreciation rate (0.04) and a lower saving rate (0.15) and gives a share of labour remuneration that goes to human capital of 0.32.
Saving rates deliver r = 5% on both physical and human capital; depreciation rate is set at 0.03 for physical capital and at 0.02 for human capital. The saving rate for human capital is set at 0.2 and for physical capital is 0.1875. n = 0.005; g = 0.015. The implied share of human capital remuneration in overall remuneration of labour is 0.5

Saving rates deliver r = 5% on both physical and human capital; depreciation rate is set at 0.03 for physical capital and at 0.04 for human capital. The saving rate for human capital is set at 0.15 and for physical capital is 0.1875. n = 0.005; g = 0.015. The implied share of human capital remuneration in overall remuneration of labour is 0.32

Saving rates deliver r = 5% on physical capital. The net rate of return on human capital is assumed to be 10%. The depreciation rate is set at 0.03 for physical capital and at 0.02 for human capital. The saving rate for human capital is set at 0.20 and for physical capital is 0.1875. n = 0.005; g = 0.015. The implied share of human capital remuneration in overall remuneration of labour is 0.85

The main message from Tables 7 and 8 is that the rate of decay in unfairness is materially less rapid when there can be unfairness in some part of the stock of human capital relative to a world where only physical capital can be unjustly acquired. That decay rate is faster the higher is the depreciation rate of human capital and the lower is saving into human capital. If 70% of both physical and human capital is initially unjust (and assuming
 $${\delta _H} = 0.02,{\delta _K} = 0.03,{s_H} = 0.2$$
) then around 46% of income is initially unjust. After 75 years the amount of income that is unfair is still a substantial 15%. The decay rates for unfairness with only unjust physical capital are much faster.
If human capital is more important the decay of unfairness can be significantly lower. In Table 9 I show results where we drop the assumption of common returns on human and physical capital. I now assume human capital is more productive and has a net rate of return of 10% – twice that on physical capital. One possible reason is that credit restrictions have a bigger impact on individuals’ ability to accumulate human capital than they do on companies’ acquisition of physical capital; another factor might be companies’ inability to appropriate much of the returns to their investing in the human capital of their work force. For either reason returns on human capital may be high. Now injustice lasts a lot longer – and can build up. The second block of results in Table 9 shows that if initially there is no injustice in human capital it can become significant in a few decades.
Table 9 shows that the half life of injustice is over 160 years if we start with injustice in both physical and human capital. In this calibration human capital accounts for 85% of the returns to labour – a figure that may be implausibly high for the economy of 100 or more years ago, but does not seem so implausible today. Even if there is no initial injustice in human capital, the overall half life of income injustice is 126 years.
In the next section I consider what happens to the decay rate of unfairness in a limiting case where human capital is the sole source of returns to labour.
3.7. Share of human capital in total labour remuneration approaches unity
In a world in which physical labour power is in many sectors becoming less relevant it is plausible that the returns to human capital take a rising share of total labour remuneration. One could imagine a supremely well trained person with an exceptionally high stock of human capital who only had to work a few minutes a week to earn a large salary. So very high values of
 $$\theta $$
are not wildly implausible in many sectors and its whole-economy average value may be rising over time. With a common (net of depreciation) rate of return on capital of 5%, a depreciation rate for human capital of 0.02 and a saving rate of 0.2 the share of human capital in total labour income is 50%. If we assume instead a 10% net of depreciation return to investment in human capital, a depreciation rate of only 0.015 and the same (high) saving rate of 0.2 of income devoted to human capital investment, the share of human capital (
 $$\theta $$
) rises to 94%. In this case when
 $$\varphi $$
is zero (elasticity of substitutability between
 $$H$$
and
 $$L = 1)$$
the share parameter
 $$\eta $$
from the production function for effective labour is also 0.94. (If we set
 $$\varphi $$
= 0.2. so elasticity of substitution is 1.25, the share parameter
 $$\eta $$
is only 0.59 even though the share of human capital remuneration in total labour income is still 0.94.)
In the limiting case where human capital accounts for all returns to labour there are striking implications for how long injustice lasts. The key result is that the impact of initial unjust shares of either capital or of human capital never dies away. There is a convergence of unjust shares on steady state values. It is possible to prove the following results when all returns to labour reflect human capital (more detail is in the Appendix).
-
1. The shares of both human and physical capital that are unjust (
 $$\lambda _t^{UH},\lambda _t^{UK}$$
) both converge on a common value which is also the level to which overall income unfairness,
$$Y_t^U/{Y_t}$$
converges. This steady state level of unfairness is a weighted average of initial physical capital unfairness
$$\lambda _0^{UK}$$
and of initial human capital unfairness
$$\lambda _0^{UH}$$
; the weights depend on labour and capital income shares and on the relative sizes of human capital and physical capital depreciation rates (
$${\delta _H},$$
$${\delta _K}$$
).
-
2. No matter how small is
$$\lambda _0^{UH}$$
we get infinitely long-lasting unfairness if
$$\lambda _0^{UK} \gt 0$$
. If
$$\lambda _0^{UH} = 0$$
then
$$\lambda _t^{UH},\lambda _t^{UK}$$
and
$$Y_t^U/{Y_t}$$
converge to
$$\lambda _0^{UK}/[1 + (1 - \pi )({\delta _K} + n + g)/(\pi ({\delta _H} + n + g))]$$
-
3. No matter how small is
$$\lambda _0^{UK}$$
we get infinitely long-lasting unfairness if
$$\lambda _0^{UH} \gt 0$$
. If
$$\lambda _0^{UK} = 0$$
then
$$\lambda _t^{UH},\lambda _t^{UK}$$
and
$$Y_t^U/{Y_t}$$
converge to


 $$\lambda _0^{UH}/[1 + \pi ({\delta _H} + n + g)/((1 - \pi )({\delta _K} + n + g))]$$
-
4. With zero initial human capital unfairness we get long run income unfairness in excess of initial income unfairness if
$${\delta _H} \gt {\delta _K}$$
; unchanging unfairness if
$${\delta _H} = {\delta _K}$$
and declining unfairness that converges on a level below
$$\lambda _0^{UK}(\pi )$$
if
$${\delta _H} \lt {\delta _K}.$$
-
5. If
$${\delta _H} = {\delta _K},$$
$$Y_t^U/{Y_t}$$
is constant at
$$\lambda _0^{UH}(1 - \pi ) + \lambda _0^{UK}(\pi )$$
and
$$\lambda _t^{UH},\lambda _t^{UK}$$
both converge on that level. So
$$\lambda _t^{UH},\lambda _t^{UK}$$
converge on the weighted average initial levels of inequality in human and physical capital, while the overall level of income unfairness never changes. -
6. If
$$\lambda _0^{UH} = \lambda _0^{UK}$$
unfairness in human capital, physical capital and in overall income never change.


3.8. Is the decay rate of injustice falling?
Are there reasons to believe that the rate at which injustice dies away is itself falling? If that were true then with an unchanged arrival rate of new injustices the average level of injustice would still be falling as the seriousness of new injustices declined as their half life fell. I showed above that with a neoclassical model of growth and accumulation either of two conditions is sufficient for initial injustice never to go away: saving out of labour income is zero or human capital accounts for all of labour remuneration. In the distant past, when many people lived on subsistence wages, saving out of labour income may have been very small and injustice very slow to decline. One reason saving was low was that for the great majority of the population there was no period of retirement – people worked as long as they were able. In terms of the OLG model of perpetual youth this corresponds to a near zero value
 $$v$$
that generates near zero value of
 $${s_L}.$$
Footnote
11
The spectacular rise in labour incomes over the past 200 years in developed economies, and the rise in institutions that generate savings out of labour incomes (company pensions, amortizing mortgages) would suggest that this sort of long-lived injustice would have declined – half lives should be lower now that in 1800. But it is also likely that the significance of human capital in overall labour remuneration is higher now than in the past, and may be rising. So with these countervailing effects it is far from clear that the half life on injustice is declining.
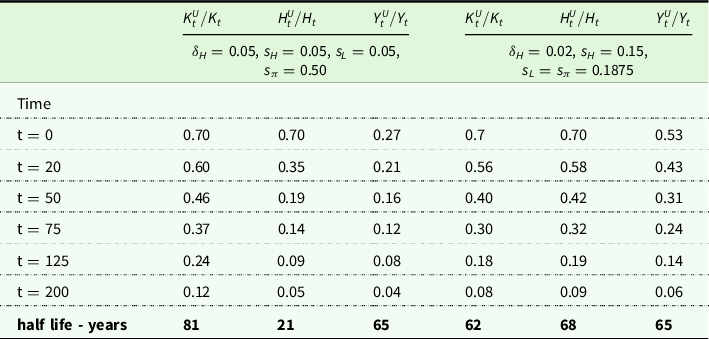
Table 10 illustrates the offsetting forces at work by considering two scenarios. In the first human capital is not a major part of overall labour remuneration – the aggregate saving rate out of income into human capital formation is 0.05 and the depreciation rate is 0.05 (so that something learned at age 20 has dwindled to half in terms of its value by age 33). Perhaps this reflected life expectancy and education levels 100 and more years ago. I set the return on human capital a bit above that on physical capital – at 7.5%, relative to 5% on physical capital. But I suppose also that in this world most workers were hardly able to save – and the saving rate out of capital income was 10 times that out of labour income. This combination of forces would generate a proportion of labour income due to human capital of only 13%; a saving rate out of capital income of nearly 50% and out of labour income of only 5%. The first block of columns in Table 10 shows how injustice evolves in this economy.
Saving rates deliver r = 5% on physical capital; depreciation rate is set at 0.03 for physical capital. n = 0.005; g = 0.015. The implied share of human capital remuneration in overall remuneration of labour is 0.13 for the first block of results and 0.64 for the second

Now consider an economy more like that of advanced countries today. Human capital is much more important: there is a common saving rate out of all income of 15% for human capital formation, a rate of return higher than on physical capital at 10% as opposed to 5% and a lower depreciation of that human capital of 0.02 a year. But there is also much more significant saving out of labour income – at a rate equal to that out of capital income. This is the second block of results in Table 10, where human capital accounts for 64% of labour remuneration and where saving out of both labour and capital incomes for physical investment is at the same rate of 0.1875 (generating a 5% return on physical capital).
The half lives of overall economic injustice in both cases is 65 years. In the more modern economy the half life of injustice in ownership of physical capital is lower; but that is offset by a much higher half life of injustice in human capital. With these scenarios, there is no change in the overall rate of decay of injustice as one moves from the distant past to the present.
4. Some empirical evidence on perceived unfairness
The analysis in this paper suggests that the enduring economic unfairness from past wrongs depends on a range of factors: the rate of depreciation of assets; the growth of productivity and of population that raises aggregate incomes; savings rates out of different types of income. If that idea has merit we might expect that perceptions of how unjust a society is might depend on these factors. In this section I consider whether there is any evidence consistent with that.
I use survey responses from a large number of different countries to questions that probe attitudes on different aspects of economic injustice. Inevitably the link between answers to general survey questions and the precise notion of economic injustice used in this paper is loose. So the results reported here are at best only suggestive. The data are from World Values Survey (WVS).Footnote 12 The World Values Survey is a global research project that explores people’s values and beliefs, how they change over time, and what social and political impact they have. Since 1981 a worldwide network of social scientists have conducted representative national surveys as part of WVS in almost 100 countries. The data have been used in several studies (for an early example see McCleary and Barro Reference McCleary and Barro2006). Extensive details of the survey design, and the data itself, are available at <http://www.worldvaluessurvey.org/wvs.jsp>.
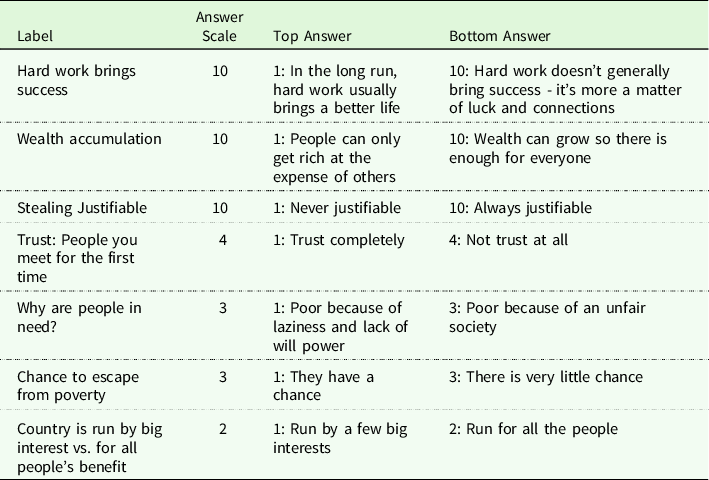
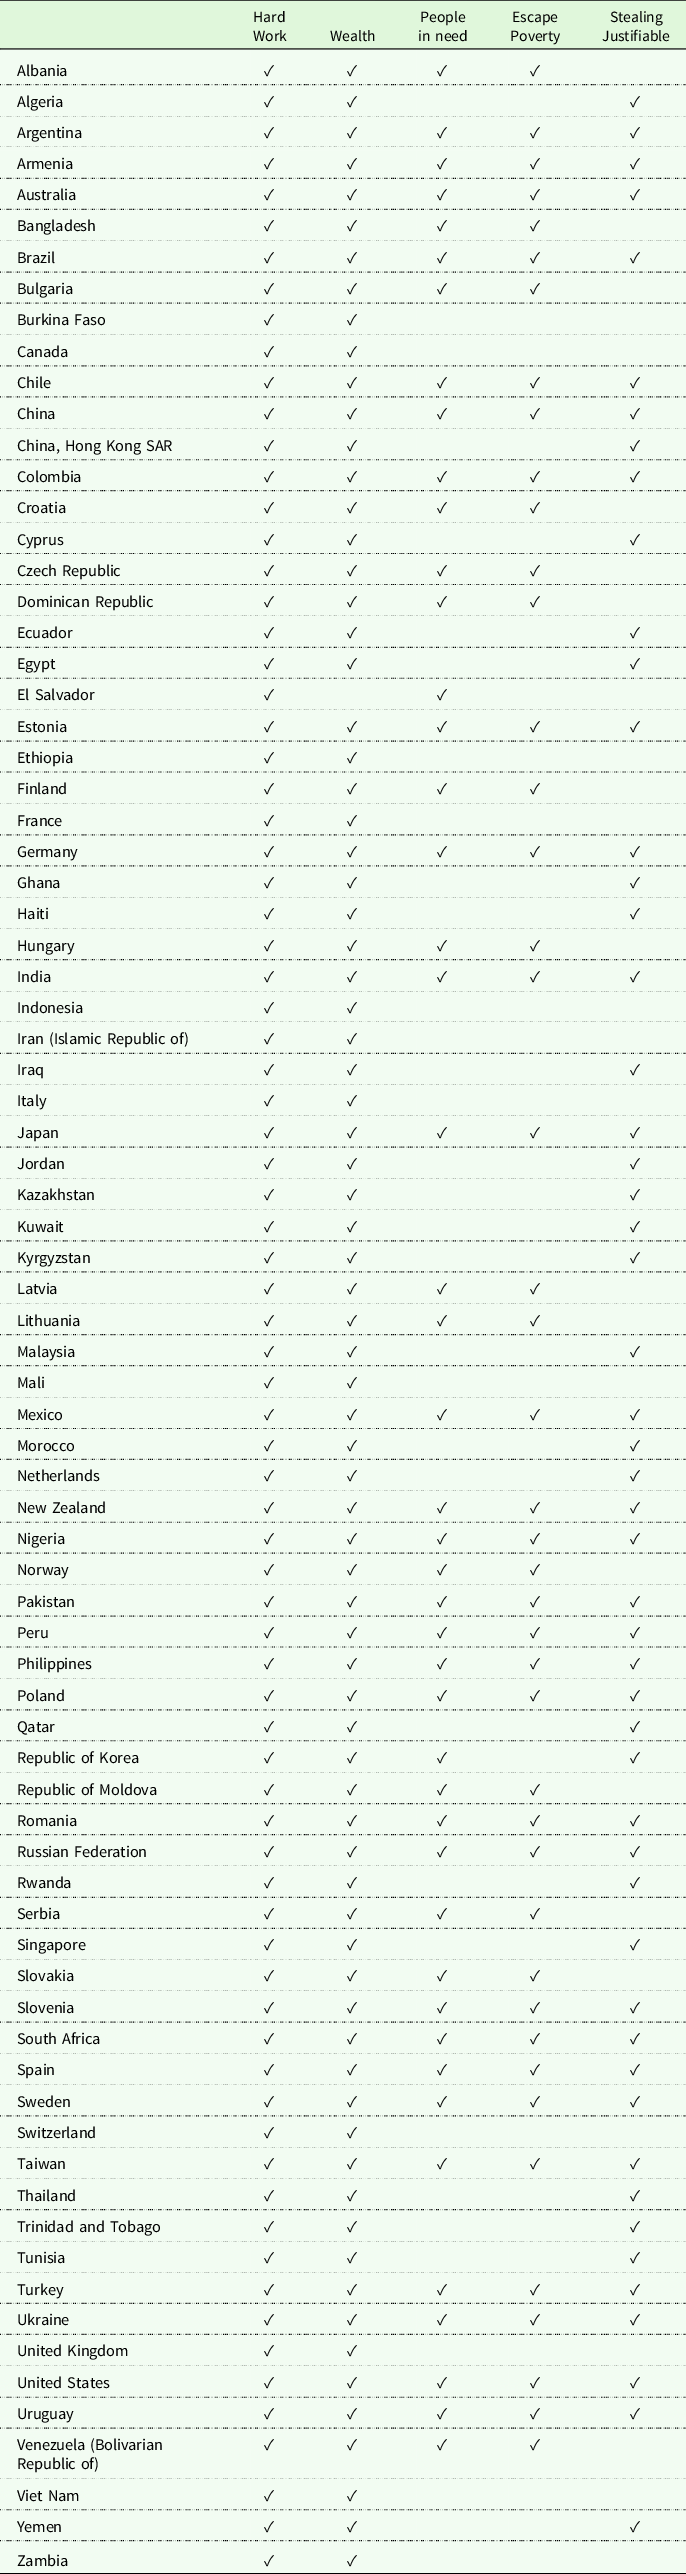
I use the latest survey responses from up to 81 countries on a range of questions where in each case respondents are asked where they put themselves on a scale from disagree most strongly to agree most strongly with statements that are linked in different ways to economic justice. Seven questions address aspects of unfairness. These questions are shown in Table 11. A couple of these questions are somewhat tangential to economic justice and focus more on mutual trust and on the influence of big business and I make only limited use of them. But the other five questions are very directly related to economic justice, asking whether hard work or luck and connections bring success, whether wealth accumulation can only come at the expense of others and whether people have a chance of escaping poverty. Table 12 shows the countries from which the survey data I use came. Sample sizes vary across countries but are generally between 1000 and 2000 in each country. Most surveys were conducted between 2010 and 2014.
WVS Questions

This table reports the seven questions from the world value surveys used for measuring perceived fairness in a country. Column 1 indicates the label of the WVS question and column 2 the answer scale. Column 3 and 4 indicate the phrasing of the answer options at the opposite ends in the questionnaire. For the analysis, all questions were flipped so that the top answer option (i.e. answering 1) represented a perception of fairness, while the bottom answer a perception of unfariness.
Country Coverage

This table shows the countries that are covered in the regressions indicated in the column headings.
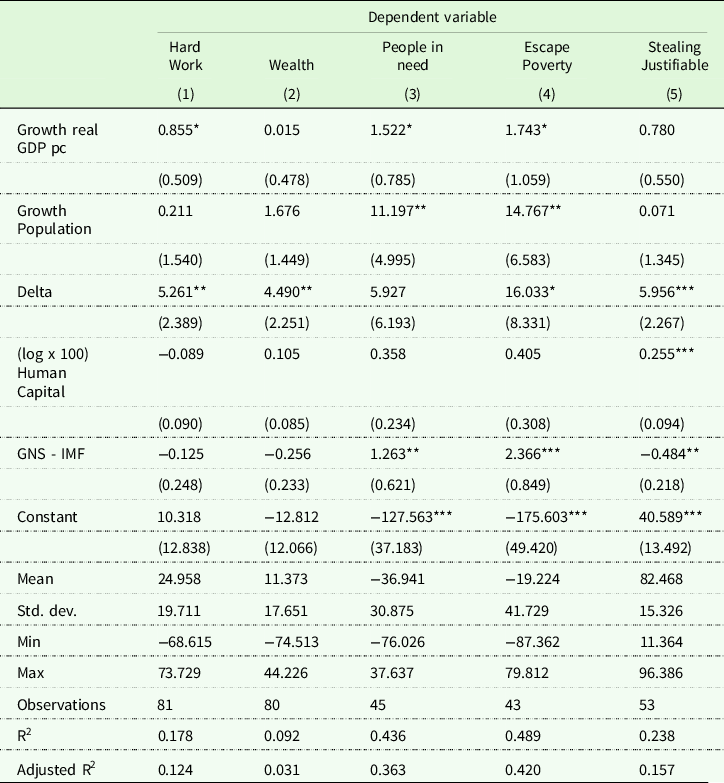
Table 13 shows the results of regressing different measures of the degree of perceptions of unfairness in countries (derived from its survey responses) on a range of national economic characteristics which the models developed above suggest should be relevant. The dependent variable for regressions based on each question measures the proportion of those surveyed who answered with responses most suggestive of seeing their country as fair minus the proportion answering in the categories least consistent with perceived fairness. So for the question ‘Hard work brings success’, where there is a 10-point scale of answers ranging from ‘in the long run hard work usually brings a better life’ to ‘hard work generally does not bring success – it’s more a matter of luck and connections’, the dependent variable is the proportion in the survey in a country choosing the two answers at the end favouring the first statement minus the proportion choosing the two buckets at the other end of the scale. (For questions where there are just three options the measure of unfairness is the proportion choosing the bucket with most agreement to the fair answer minus the proportion choosing the bucket at the other end of the scale).
Predicting Perceived Fairness

The dependent variables are based on di¤erent world values survey questions that proxy perceived fariness. Hard Work, Wealth and Stealing Justifiable were answered on a scale of 10. I sum the percentage of responses answering with 1 or 2 and substract the percentage of responses answering 9 or 10 to create an index. For the dependent variables People in need and Escape Poverty, there were three answer options. I take the percentage who answered with option 1 (“fair”) and substract the percentage who answered with option 3 (“unfair”). The dependent and independent variables are measured in percentages except for the human capital index which is 100 x log(index). Standard errors are in parentheses. The data are not truncated. Significance Levels: *p<0.1; **p<0.05; ***p < 0.01.
The economic factors we measure for each country are the average values over the most recent 10 years leading up to the date at which the survey was conducted of: growth in real per capita GDP; growth in population; depreciation of capital (‘delta’); a measure of human capital; the gross national saving rate (GNS). All data are from standard cross country sources – the Penn World Table data, the World Bank and IMF. The models outlined above suggest that the first three factors (per capita growth, population change, depreciation) should be positively linked to perceived fairness because they reduce the half life of injustice. The saving rate and human capital are less clear cut: high saving out of labour income is likely to be a positive factor in perceptions of economic fairness but saving out of capital income is more likely to go the other way. Whether higher human capital is linked to greater or lesser perceptions of fairness depends on whether savings to finance human capital accumulation is from incomes that themselves are untainted by past injustice or not. Better measures of savings from different sources of incomes would help sharpen the results but we are hampered here by an absence of reliable data for most countries on disaggregated savings.
The results provide some evidence that the country characteristics that most consistently seem to exist alongside higher perceptions of economic fairness are in line with the model developed above: countries with high rates of depreciation of assets, high growth of per capita incomes and faster growth in population seem to have higher average perceptions of economic fairness; the link between savings and accumulation of human capital is far less clear. The most clear link is between depreciation of assets and perceptions of fairness. An average depreciation rate on assets in a country that is 4% higher than in another is associated with a rise in the proportion of its population who are most disposed to see economic fairness relative to those least disposed of almost 20%. When applied to the question of whether it is hard work or luck and connections that bring success such a change in perceptions would move a country that had a balance of opinion that was average (a +25% balance who answered 1 or 2 over the number answering 9 or 10) to a balance almost twice as great (+46%). Impacts of the average growth in per capita income and in population are weaker.
Table 14 presents some portmanteau statistics to judge the overall significance of the relations between perceived fairness and the factors suggested by the model of the persistence of economic injustice. I report the weighted average coefficients on economic variables from 13 different regressions where in each case the measure of perceived unfairness is constructed in different ways. In measuring perceived unfairness I use the two questions on the role of big business and trust as well as the results for the specifications described in Table 12. I also use some specifications for the questions where respondents choose from a 10-point scale and where the dependent variable is the proportion choosing box 1, 2 or 3 (the ‘fair’ end of the scale) minus the proportion choosing boxes 8, 9 or 10; in a third alternative I use the proportion choosing boxes 1, 2 or 3 minus the proportion choosing any other box. (Table 13 used the proportion choosing box 1 and 2 minus the proportion choosing boxes 9 or 10.) The weighting of regression coefficients is done using the inverse of uncertainty around each coefficient (either standard error squared or the standard error – with the estimated standard error of the weighted average coefficient calculated accordingly). Growth in incomes, depreciation of assets and population growth emerge as factors where results are most unlikely to have been generated if there was no underlying link between them and perceptions of fairness; the direction of the effects is consistent with the ideas behind the half-life calculations described above. Nonetheless the loose connection between the survey questions and the precise form of economic injustice used in this paper means that the results provide only indirect and limited evidence.
Summarized regression coefficients

This table shows average coefficients for the economic predictors for responses to the different world value survey questions. Standard errors are in parentheses. Thirteen perceived fairness indexes were constructed from the seven main world value survey questions described in Table 11. Three perceived fairness indexes were constructed from each world value survey question rated on a 10-point scale, namely “Hard Work”, “Wealth”, and “Stealing”. This includes a T2mB2, T3mB3 and T3mB7 specification, where T2mB2 denotes the sum of the percentage voting 1 or 2 less the percentage voting 9 and 10. For the world value survey questions with a smaller point scale, namely “Trust: People you meet for the first time”, “Why are people in need?”, “Escape Poverty” and “Country interest”, one perceived fairness index was constructed per question. The average coefficients are constructed from estimated regression coefficients across the different specifications using the standard errors (or variances) of coefficient estimates as weights. The Weighted Average Coefficient I is calculated using the inverse variance technique, specifically:
 $${\rm{Weighted \,\,Average \,\,Coefficient}}\,{\rm{I = }}{{\sum\nolimits_{i = 1}^{13} {{{\hat \beta }_i}/\sigma _i^2} } \over \vskip 3pt{\sum\nolimits_{i = 1}^{13} {1/\sigma _i^2} }}$$
. The square of the standard error of the Weighted Average Coefficient
 $${\rm{I = }}{{\sum\nolimits_{i = 1}^{13} {\omega _i^2\sigma _i^2} } \over {{{\left( {\sum\nolimits_{i = 1}^{13} {{\omega _i}} } \right)}^2}}} = {1 \over {\sum\nolimits_{i = 1}^{13} {{1 \mathord{\left/ {\vphantom {1 {\sigma _i^2}}} \right. } {\sigma _i^2}}} }}$$
, where the weights are
 $${\omega _i} = {1 \mathord{\left/ {\vphantom {1 {\sigma _i^2}}} \right. } {\sigma _i^2}}$$
. For the Weighted Average Coefficient II inverse standard errors are used as weights, i.e.
 $${\omega _i} = {1 \mathord{\left/ {\vphantom {1 {{\sigma _i}}}} \right. } {{\sigma _i}}}$$
. The Weighted Average Coefficient
 $${\rm{II}} = {{\sum\nolimits_{i = 1}^{13} {{{\hat \beta }_i}/{\sigma _i}} } \over {\sum\nolimits_{i = 1}^{13} {1/{\sigma _i}} }}$$
and its squared standard error is
 $${I \over {{{\left( {\sum\nolimits_{i = 1}^{13} {{1 \mathord{\left/ {\vphantom {1 {{\sigma _i}}}} \right. } {{\sigma _i}}}} } \right)}^2}}} = {{13} \over {{{\left( {\sum\nolimits_{i = 1}^{13} {{1 \mathord{\left/ {\vphantom {1 {{\sigma _i}}}} \right. } {{\sigma _i}}}} } \right)}^2}}}$$
.
5. Conclusions
I have drawn on an idea developed at length in the work of Nozick – that ownership of resources now that depends on past unjust ownership of resources is itself unjust – and used it to explore the impact today of an unjust pattern of the ownership of assets in the past.
I suppose that at some point in the past the total capital stock (or wealth) was composed of two parts – one part that was justly acquired and one part that was unjustly acquired. I present a framework to assess how much of wealth and income today is due to the existence of unjustly acquired capital. In doing this I am assuming that all future income derived from any wealth that has been unjustly acquired is itself unjust; any capital accumulated from income that derives from unjust capital is also unjust. This means that a large stock of unjust capital and income has potentially long-lasting effects. But I also assume that all economic activity connected with just capital – the generation of wages and of capital income and the saving from such incomes to create new capital – is always just.
The estimation of the extent to which wealth and incomes today are a result of past injustices would seem to be central to the issue of what scale of reparations might be warranted by past unfairness. That would follow if one accepted that the extent of compensation due from people alive today as a result of injustices they did not themselves commit in the past exists only to the extent that they themselves are better off as a result.Footnote 13 That principle has force because it avoids the morally dubious position that the descendants of those who committed unfair acts in the past are themselves responsible for compensating the victims even though they did not commit the acts and do not benefit in any way from them; limiting compensation to the extent to which one benefits from the unjust acts of others is much more widely accepted.
The notion of a just distribution of resources is highly contentious. In many ways this paper uses a narrow conception of just and unjust outcomes. It sets out a framework for thinking through the evolution of one type of injustice and presents illustrative results based on a calibrated version of a familiar model of asset accumulation and growth. The value of such an exercise does not require that we believe that the only source of injustice is from the past distribution of assets. One would want to know how past injustice of this sort affects today’s outcomes even if one took the view of Sen that ‘we can have a strong sense of injustice on many different grounds, and yet not agree on one particular ground as being the dominant reason for the diagnosis of injustice’ (Sen Reference Sen2009). That there may be many reasons for unjust economic outcomes beyond the lingering effects of past injustices is likely – see, for example, Zingales (Reference Zingales2012). But knowing how significant is the impact of past unjust outcomes is still fundamental to judging the legitimacy of today’s outcomes.
The models of growth and distribution that I have used to illustrate the mechanisms whereby injustice in acquisition lingers are simple – I assume competitive markets, that factors are paid marginal products and that the conditions for aggregation of capital and labour into an all economy production function exist. These are strong assumptions. How the persistence of injustice in economic outcomes is affected by relaxation of these assumptions seems a fruitful subject for further work.
Acknowledgements
I thank Tim Besley, James Sefton, John Vickers, Diane Coyle and seminar participants at the German Institute for Economic Research (DWR) Berlin, Edinburgh University, Oxford University, City University and Imperial College for helpful comments. I am indebted to Robert Zymek for several insightful suggestions. Moritz Wiedemann provided excellent research assistance. Anonymous referees made several helpful comments on an earlier draft.
Appendix: Theoretical underpinnings of the model of asset accumulation and growth
I assume an economy in which there are large numbers of different agents (each a member of a dynasty) of varying ages alive at each point of time. The population is large enough so that its aggregate age structure is predictable. The length of life of each agent/dynasty is uncertain and varies greatly; its expected value is
 $$1/d.$$
From now on I will speak of an ‘agent’ as having a chance of death of
 $$d$$
where I think of
 $$d$$
as the chance that the people who the current generation care about are all gone; if
 $$d$$
is low then the horizon can be much longer than the likely adult life expectancy of an individual.
 $$d = 0$$
is the infinite horizon model. I assume that agents maximize a lifetime utility function where utility in each period is a function of consumption. An agent born at time
 $$s$$
maximizes
 $$\sum\limits_{t = s}^\infty {[(1 - d)/(1 + \rho )]^{t - s}}[C_{st}^{1 - \phi }/1 - \phi ]$$
 $$\rho $$
is the discount rate (rate of time preference);
 $$1/\phi $$
is the intertemporal elasticity of substitution. I denote the population of agents/dynasties at time t by
 $${P_t}$$
. Births of new agents/dynasties at time
 $$t$$
are assumed to be
 $$(n + d){P_{t - 1}}$$
. I assume that labour supply and population are proportional to the number of agents/dynasties so that the population (and labour force) grow at constant rate
 $$n.$$
If we normalize the number of births at time t=1 to be 1 then
 $${P_1}$$
is given by
 $$\sum\limits_{j = 0}^\infty {[(1 - d)/(1 + n)]^j} = (1 + n)/(n + d).$$
Births and population grow at rate
 $$n;$$
if
 $$n = 0$$
then births are constant at 1 and population is constant at
 $$1/d.$$
 $${P_t}$$
is equal to
 $${(1 + n)^t}/(n + d).$$
There is time-related labour-enhancing productivity growth at rate
 $$g.$$
There is potentially age-related change in the amount of labour exogenously supplied at rate
 $$v$$
– we can think of this as either a decline in hours worked with age or in the effectiveness with which people work. The inelastic labour supply of each agent measured in effective units grows at rate
 $$(1 + g)/(1 + v).$$
With steady population growth the age structure is unchanging so that the age-related decline in individual labour supply is offset by the birth of new agents. In aggregate the effective labour force grows at rate
 $$n + g$$
.
As in the Blanchard model, I assume insurance-saving contracts are offered at actuarially fair rates so that a unit of saving at time
 $$t$$
pays out an amount conditional on an agent surviving into the next period of
 $$(1 + {r_t})/(1 - d)$$
where the return on assets during time
 $$t$$
is denoted
 $${r_t}$$
. If agents only think of their own lives as mattering we can think of these financial contracts as annuities that stop paying at their death. If agents look beyond their own lives we should think of these as annuities written on joint deaths (e.g. of children and grandchildren). If an agent does not survive the financial intermediary keeps the wealth of
 $$1 + {r_t}$$
; this means the payouts exactly match its available resources. The period to period budget constraint for an agent born at time
 $$s,$$
whose units of labour supplied at time
 $$t$$
is
 $$1/(1 + v{)^{t - s}},$$
is:
 $${A_{st + 1}} = ({A_{st}} + {w_t}/(1 + v{)^{t - s}} - {C_{st}})(1 + {r_t})/(1 - d)$$
 $${A_{st}}$$
is the stock of (non-human) assets at period
 $$t$$
of the agent born in period
 $$s$$
;
 $${w_t}$$
is the wage per unit labour supplied at time t. On a balanced growth path the interest rate is constant (at
 $$r$$
) and the wage per unit supplied of labour grows at rate
 $g.$
Imposing a transversality condition and assuming interest rates are unchanging gives the lifetime budget constraint at time
 $$s,$$
when effective labour supply of a member of the new cohort is 1, of
 $$\sum\limits_{t = s}^\infty {C_{st}}{[(1 - d)/(1 + r)]^{t - s}} = {A_{st}} + {w_s}\sum\limits_{t = s}^\infty {[(1 + g)(1 - d)/((1 + v)(1 + r))]^{t - s}}$$
The first order condition from this optimization problem implies:
 $${C_{st}}/{C_{st - 1}} = [(1 + r)/(1 + \rho {)]^{1/\phi }}$$
Combining these two equations implies
 $${C_{st}} = [{H_{st}} + {A_{st}}][1 - (1 - d)(1 + r{)^{1/\phi - 1}}{(1 + \rho )^{ - 1/\phi }}]$$
where
 $${H_{st}}$$
is human wealth at time
 $$t$$
for the agent/dynasty born at time
 $$s.$$
This is the value of future wages discounted at the rate
 $$(1 - d)/(1 + r)$$
and is given by
 $${H_{st}} = ({w_t}/(1 + v{)^{t - s}})/[1 - (1 + g)(1 - d)/((1 + v)(1 + r))]$$
These conditions are messier when interest rates are not constant off a balanced growth path, but the key feature remains which is that there is a common propensity to consume out of comprehensive wealth (the sum of human capital and non-human assets) for all agents. This will generate a common saving rate out of labour income across agents that is equal for people of different ages and also a common saving rate out of income from assets – though the two savings rates are not generally equal to each other. Because consumption is linear in human wealth and other capital it aggregates easily so that the way the aggregate economy evolves over time is tractable. Births at date
 $$1$$
are normalized to 1 so births at date
 $$t$$
are
 $${(1 + n)^{t - 1}}$$
. For any aggregate variable
 $${X_t}$$
we define it as
 $${(1 + n)^{t - 1}}\sum\limits_{s = t}^{ - \infty } {X_{st}}{[(1 - d)/(1 + n)]^{t - s}}$$
Aggregate labour income at time
 $$t$$
is given by:
 $${(1 + n)^{t - 1}} \sum\limits_{s = t}^{ - \infty } {w_t}{[(1 - d)/((1 + n)(1 + v))]^{t - s}} = {w_t}{(1 + n)^{t - 1}}[1/\{ 1 - (1 - d)/((1 + n)(1 + v))\} ]$$
The aggregate labour supply at time t, denoted
 $${L_t}$$
, is
 $${(1 + n)^{t - 1}}/\{ 1 - (1 - d)/((1 + n)(1 + v))\} $$
. If
 $$v = 0$$
this is equal to population; if
 $$v \gt 0$$
then
 $$L$$
is proportional to
 $$P$$
but smaller than it.
I assume economies are closed so that aggregate assets held by individuals (
 $${A_t})$$
equal the aggregate capital stock (
 $${K_t}).$$
Capital depreciates at rate
 $$\delta $$
and the gross rate of return on capital is
 $$\delta + r.$$
Aggregate income – GDP – is given by
 $${L_t}{w_t} + {K_t}(r + \delta )$$
where
 $${K_t} = (1 + n{)^{t - 1}}\\sum\limits_{s = t}^{ - \infty } {A_{st}}{[(1 - d)/(1 + n)]^{t - s}}$$
Pulling together these results we can now write aggregate savings, the difference between GDP and consumption, as:
 $${S_t} = {K_t}(r + \delta ) + {L_t}{w_t} - {C_t} = {K_t}(r + \delta )[1 - \{ 1 - (1 - d)(1 + r{)^{1/\phi - 1}}{(1 + \rho )^{ - 1/\phi }}\} /(r + \delta )]$$
 $$\hskip 24pt + {L_t}{w_t}[1 - \{ 1 - (1 - d)(1 + r{)^{1/\phi - 1}}{(1 + \rho )^{ - 1/\phi }}\} /(1 - (1 + g)(1 - d)/((1 + v)(1 + r)))]$$
This simplifies greatly if we have log preferences
 $$(\phi = 1)$$
and if
 $$g$$
and
 $$v$$
are approximately equal. In this case:
 $${S_t} = {K_t}(r + \delta )[1 - [(\rho + d)/((1 + \rho )((r + \delta ))] + {L_t}{w_t}[1 - (1 + r)(\rho + d)/((1 + \rho )(r + d))]$$
In this case the balanced growth path saving rate out of gross capital income, which I will denote
 $${s_\pi },$$
is
 $$1 - (\rho + d)/((1 + \rho )/(r + \delta ))$$
and the saving rate out of labour income, denoted
 $${s_L},$$
is
 $$1 - (\rho + d)(1 + r)/((1 + \rho )(r + d)) = (r - \rho )(1 - d)/((1 + \rho )(r + d)).$$
Blanchard shows that
 $$r \gt \rho $$
if
 $$d \gt 0$$
which means that the propensity to save out of labour income is positive. Since it is plausible that
 $$\delta \gt d$$
(i.e. on average agents/dynasties live longer than machines) the propensity to save out of capital income would be higher than the propensity to save out of labour income. So savings rates out of labour and capital income are positive but not equal.
In the more general case (where
 $\phi \ne 1;v \ne g$
) the OLG model with a constant probability of death implies that the relation between consumption, the present value of future labour incomes and non-human wealth (capital) remains linear. This allows straightforward aggregation and generates aggregate saving which is an additive function of aggregate capital income and of aggregate labour income, which is of the form assumed in the models used in this paper.
Share of human capital in total labour remuneration approaches 1
In the limiting case where human capital accounts for all returns to labour one eigenvalue of the dynamic system for the evolution of unjust physical and human capital becomes 1; the other is given by
 $$\left[ {1 - (\pi {\delta _H} + (1 - \pi ){\delta _K})} \right]/(1 + n + g) \lt 1$$
The unit eigenvalue means that the impact of initial unjust shares of either capital or of human capital never dies away. There is a convergence of unjust shares on steady state values. The process for the evolution of the unjust shares of capital and human capital is given by:
 $$\eqalign{\left[ {\matrix{ {\lambda _t^{UK}} \cr {\lambda _t^{UH}} \cr } } \right] = \left[ {\matrix{ 1 { - [(1 - \pi )({\delta _K} + n + g)]/[\pi ({\delta _H} + n + g)]} \cr 1 1 \cr } } \right]\cr\left[ {\matrix{ {c1} \cr {c2 * \left[ {1 - (\pi {\delta _H} + (1 - \pi ){\delta _K})} \right]/(1 + n + g{{)]}^t}} \cr } } \right]}$$
where
 $$c1 = [\lambda _0^{UK}\pi ({\delta _H} + n + g) + \lambda _0^{UH}(1 - \pi )({\delta _K} + n + g))]/[(1 - \pi )({\delta _K} + n + g) + \pi ({\delta _H} + n + g)]$$
 $$c2 = (\lambda _0^{UH} - \lambda _0^{UK})/[1 + (1 - \pi )({\delta _K} + n + g)/(\pi ({\delta _H} + n + g))]$$
 $$\lambda _t^{UH},\lambda _t^{UK}$$
both converge on a common value of
 $$c1,$$
which is also the level to which overall income unfairness,
 $$Y_t^U/{Y_t}$$
converges.
Results (1) to (6) in section 3.6 are immediate implications of the equation above showing the evolution of
 $$\lambda _t^{UH},\lambda _t^{UK}$$
. The key result is that
 $$\lambda _t^{UH},\lambda _t^{UK}$$
both converge on a common value of
 $$c1,$$
which is also the level to which overall income unfairness,
 $$Y_t^U/{Y_t}$$
converges.
David Miles is Professor of Economics at Imperial College, London. His research focuses on macroeconomic issues and the ways in which financial markets interact with the wider economy. The effects of monetary and fiscal policy on assets markets and the distribution of wealth, particularly housing wealth, has been a focus of much of his work. Between 2009 and 2015 he was a member of the Monetary Policy Committee at the Bank of England. He has been an advisor to the IMF, the central banks of Ireland and New Zealand, the UK Treasury and to the UK Debt Management Office. URL: http://www.imperial.ac.uk/people/d.miles