1. Introduction
Detailed and continuous satellite observations since the early 1990s have vastly expanded our knowledge of changes occurring in the polar ice sheets. Among the strongest signals observed are changes near their marine margins. In West Antarctica, fast-flowing ice streams feed large ice shelves which are grounded deep below sea level and support vast floating tongues. A region exhibiting one of the largest changes in terms of ice-sheet acceleration, thinning and mass loss is Pine Island Glacier (PIG) (Reference Hellmer, Jacobs, Jenkins, Jacobs and WeissHellmer and others, 1998; Reference RignotRignot, 1998; Reference Shepherd, Wingham, Mansley and CorrShepherd and others, 2001; Reference Joughin, Rignot, Rosanova, Lucchitta and BohlanderJoughin and others, 2003; Reference JakobssonJakobsson and others, 2011). Its extensive ice-shelf tongue, the Pine Island Ice Shelf (PIIS), is in direct contact with the ocean in the Amundsen Sea embayment (ASE). Observed flow speeds, deduced from interferometric synthetic aperture radar (InSAR), rose by 34% over the period 1996–2006, to an estimated average over PIG of 3 km a–1; associated mass discharge increased by ~23Gt a–1 to 107Gt a–1 (Reference RignotRignot, 2008; Reference RignotRignot and others, 2008) and more recently to higher values (Reference JoughinJoughin, 2010; Reference ThomasThomas and others, 2011). Mass discharge estimated independently from the space-borne time-varying gravimetry mission GRACE (Gravity Recovery and Climate Experiment) was 15–35Gt a–1 (Reference Velicogna and WahrVelicogna and Wahr, 2006; Reference Rignot, Velicogna, Van den Broeke, Monaghan and LenaertsRignot and others, 2011). According to latest estimates by Reference Jacobs, Jenkins, Giulivi and DutrieuxJacobs and others (2011), under-ice-shelf averaged melt rates rose from 22 ma–1 in 1994 to 33 ma–1 in 2009, and are thought to be an order of magnitude larger near the grounding zone than beneath the outer shallower parts of the shelf. Associated net thinning rates near the grounding zone estimated from European Remote-sensing Satellite-2 (ERS-2) and Envisat radar altimetry (Reference Wingham, Ridout, Scharroo, Arthern and ShumWingham and others, 1998, Reference Wingham, Wallis and Shepherd2009) and Ice, Cloud and land Elevation Satellite-1 (ICESat-1) laser altimetry (Reference Pritchard, Arthern, Vaughan and EdwardsPritchard and others, 2009) increased from 3 ma–1 in 1995 to 10ma–1 in 2006, leading to a cumulative thinning there of 80 m during the period 1995–2008. Reference JoughinJoughin (2010) estimated a grounding-line retreat of >20 km between 1996 and 2009. Attempts to discern potential causes of these observed changes are complicated by the limited period over which satellite data are available (1992 onward for InSAR and radar altimetry from ERS-1/2 and Envisat; 2003 onward for gravity field changes from GRACE (Gravity Recovery and Climate Experiment); 2003–09 for laser altimetry from ICESat). Early glaciological studies combined surface velocity observations with ice-flow models to assess the role of basal conditions in setting Pine Island’s fast ice-stream flow (Reference Vieli and PayneVieli and Payne, 2003), but the apparent co-location between regions of largest acceleration and their direct contact with the ocean through large ice shelves also suggests a significant contribution from oceanic processes in determining the glacial flow. This link is increasingly being recognized within the glaciological community (Reference Payne, Vieli, Shepherd, Wingham and RignotPayne and others, 2004; Reference Shepherd, Wingham and RignotShepherd and others, 2004; Reference ThomasThomas and others, 2004) and has spurred intense interest in ice-sheet/ocean interactions.
Several recent field programs (Reference JenkinsJenkins and others, 2010) have focused on PIG and the surrounding ASE to shed light on the detailed circulation and water mass properties, as well as bathymetry and cavity geometry, in the Pine Island embayment. These campaigns have been motivated by modelling efforts that attempt to quantify ocean-induced melt rates under the PIIS in the context of recent changes in water mass properties in the ASE (Reference Payne, Holland, Shepherd, Rutt, Jenkins and JoughinPayne and others, 2007).
Modelling ocean-induced melt rates goes back to at least the 1970s, when Reference RobinRobin (1979) conjectured that the shape of sub-ice-shelf cavities might be strongly influenced by heat and freshwater delivery to its base, and by the detailed patterns of subsequent sub-ice-shelf melting and refreezing effects. The initially simple parameterizations of melt rates have evolved over time into what is now referred to as a three-equation thermodynamic model (Reference Hellmer and OlbersHellmer and Olbers, 1989; Reference Jenkins and BomboschJenkins and Bombosch, 1995; Reference Holland and JenkinsHolland and Jenkins, 1999). This model solves two conservation equations for heat and freshwater flux at the ice/ocean interface under the constraint that the ice boundary is at the pressure-melting point (third equation). The total heat flux takes into account the ice/ocean temperature difference, a contribution from latent heat of fusion and heat diffusion through the ice shelf. The transfer coefficients employed in these parameterizations are either assumed constant or parameterized in terms of a boundary layer friction velocity (Reference Holland and JenkinsHolland and Jenkins, 1999) adopted from sea-ice modelling (Reference McPhee, Maykut and MorisonMcPhee and others, 1987). However, direct observations of melt rates are rare because of the technological challenge in obtaining them. (Reference MunkMunk (2011) referred to the interior of ice-shelf cavities as ‘this last piece of unknown ocean’.) This places large uncertainties on current approaches (Reference HollandHolland, 2008), and thus on magnitudes of melt rates. Among the few direct measurements are those of Reference Jenkins, Corr, Nicholls, Stewart and DoakeJenkins and others (2006) using phase-sensitive radar. They inferred melt rates from observed motions of basal reflectors over a 1 year period at 14 sites near the grounding line of Rutford Ice Stream, the southwest corner of the Filchner–Ronne Ice Shelf. The recent deployment of an autonomous underwater vehicle (AUV) under the PIIS holds the promise of dramatically increased observational capabilities (Reference JenkinsJenkins and others, 2010).
Recognizing melt-rate uncertainties as a serious gap in the chain which may link observed oceanic changes and ice-shelf thinning raises the question of the extent to which ocean hydrographic observations away from the ice/ocean boundary (which may be easier to obtain) are useful to constrain melt rates. The present study is a first step toward addressing this problem from an inverse modelling perspective. Using an ocean general circulation model (GCM) with realistic topography of the Pine Island embayment and geometry of the PIIS, we present comprehensive patterns of the sensitivities of sub-ice-shelf melt rates to changes in ocean circulation. The sensitivities are obtained with an adjoint model of a full-fledged ocean GCM that resolves the sub-ice-shelf circulation and includes a thermodynamic melt-rate parameterization (Reference LoschLosch, 2008). The sensitivities serve several purposes:
they identify dominant water mass pathways, timescales and dynamical processes which affect melt rates;
they carry information which may be useful for guiding oceanographic field campaigns which seek to deploy limited measurement assets in an optimal manner;
as a foundation for subsequent studies, they establish the feasibility of connecting hydrographic observations to constrain melt rates in formal estimation approaches, such as undertaken within the ECCO (Estimating the Circulation and Climate of the Ocean) consortium (Reference Wunsch and HeimbachWunsch and Heimbach, 2007; Reference Wunsch, Heimbach, Ponte and FukumoriWunsch and others, 2009).
We realize that inferred melt-rate sensitivities are dependent upon the parameterizations used, but regard this as an asset when using sensitivities for inverse calculations in which a model vs data misfit reduction is sought. Unrealistic melt-rate parameterizations may lead to unrealistic sensitivity fields whose use in a gradient-based optimization would fail to achieve the desired misfit reduction.
The remainder of the paper is organized as follows. We first provide a description of the model, its adjoint and its configuration in the Pine Island embayment (Section 2). Results from adjoint-based sensitivity calculations are presented in Section 3. In Section 4 we discuss the results and present some conclusions regarding the prospect of adjoint-based melt-rate estimation.
2. Model Description
2.1. Forward model
The Massachusetts Institute of Technology general circulation model (MITgcm; Reference Marshall, Hill, Perelman and AdcroftMarshall and others, 1997a, Reference Marshall, Adcroft, Hill, Perelman and Heiseyb) is a state-of-the-art, scalable, finite-volume numerical ocean GCM. In the configuration of this study, the model solves the Boussinesq, hydrostatic so-called primitive equations of ocean dynamics on a horizontal curvilinear grid on the rotating sphere and on vertical geopotential height surfaces (‘z’-levels) in a regional domain with open boundaries. General information about the code can be found at http://mitgcm.org (MITgcm Group, 2011).
The model is the first z-coordinate model with the capability to simulate the circulation in sub-ice-shelf cavities (Reference LoschLosch, 2008). The sub-ice-shelf package consists of two main parts:
MITgcm’s partial cell implementation to more accurately represent topography (Reference Adcroft, Hill and MarshallAdcroft and others, 1997) was extended to represent circulation in a cavity;
a three-equation melt-rate parameterization to simulate melting at the ocean/ice interface and associated freshwater fluxes into the ocean (Reference Hellmer and OlbersHellmer and Olbers, 1989; Reference Jenkins, Hellmer and HollandJenkins and others, 2001).
Details of this parameterization are summarized in the Appendix.
2.2. Adjoint model generation
The use of adjoint models for estimation or data assimilation has a long tradition in meteorology (e.g. Reference Le Dimet and TalagrandLe Dimet and Talagrand, 1986; Reference Talagrand and CourtierTalagrand and Courtier, 1987), oceanography (e.g. Reference Tziperman and ThackerTziperman and Thacker, 1989; Reference Marotzke and WunschMarotzke and Wunsch, 1993) and glaciology (e.g. Reference MacAyealMacAyeal, 1992, Reference MacAyeal1993). We limit ourselves here to an abbreviated introduction.
Why adjoints?
The present study focuses on how sub-ice-shelf melt rates change as a result of changes in the local and remote ocean circulation. Formally, obtaining a comprehensive set (or field) of sensitivity information amounts to computing the gradient of an objective function with respect to a very-high-dimensional control space spanning the full time-varying three-dimensional (3-D) oceanic state. For the case of the PIIS, the objective function, J, is chosen as the total melt rate integrated over the entire sub-ice-shelf/ocean boundary, ∫dA, and averaged over a period Δτ preceding the final time, τ f :

In practice, the integrals reduce to a sum over discrete space and time. The local melt rate at each gridpoint, (i, j, k), is the freshwater flux, q(t ) (expressed here as a volume flux; space indices are dropped). q(t ) is a function of the model state, x(t) = {T , S,U, η}(t ), consisting of all prognostic ocean state variables at time t , i.e. (potential) temperature, T , salinity, S, 3-D velocity, U, and sea surface elevation, η. The freshwater flux, q(t ), is obtained from a three-equationmelt-rate parameterization, Eqn (A1), described in detail in the Appendix.
In order to simplify the following discussion, we drop the time-average, i.e. we consider q at the final time-step, τ f , of the integration, and assume that we wish to infer the sensitivities of J(q(τ f )) to changes in the initial condition of the oceanic state, x(0). What we are faced with is the computation of perturbations of the objective function, δJ, to changes in any element of the control space, xi (0) (the control space is easily extended to allow surface forcing fields, open boundary conditions or model parameters, either spatially constant or varying). The ocean model operator, L, carries x(0) forward from time t = 0 to time t through the sequence

A direct approach to compute the gradient consists of calculating directional derivatives, i.e. perturbing each element, xi (0), of the initial state vector, x(0), (which determine the control space dimension, n) separately and integrating L each time. A perturbation of an individual melt-rate area element, δqi (t ), obtained from perturbing the initial state element, xi (0), has the form

for unit perturbations δxi (0) = δ ij . Here

is the tangent linear model (or model Jacobian) of the full ocean GCM operator, L. The full n-dimensional gradient can then be assembled from all separately calculated elements, δqi . For large-scale problems, where each forward calculation on its own is computer-intensive, and where the control space dimension is large (the dimension of the initial temperature field of the (1/32)° configuration described in Section 2.3 is Nx × Ny × Nz = 100 × 120 × 50 = 6 × 10⁵), this direct approach for obtaining the full gradient is not tractable. This is true, regardless of whether the exact tangent linear operator of J is used, or whether it is computed through finite-difference approximations of the form [J(x+ϵ)−J(x)]/ϵ for small perturbations ϵ ≪ x.
Recasting Reference Bindschadler, Vaughan and VornbergerEqn (2) as a scalar product and using the formal definition of the adjoint operator 〈x, Ly〉 = 〈L T x, y〉,

where for a finite-dimensional real vector space the adjoint operation reduces to the transpose, L T, and makes it possible to compute the gradient in a single simulation:

Important points to note are:
In the same way that in the tangent linear model (TLM) L carries small perturbations, x(0), of the initial state forward to perturbations in q(t ), the adjoint model (ADM) carries sensitivities of q(t) to x(t ) backward to sensitivities of q(t ) to the initial state x(0). Put differently, the TLM yields the impact of changes in one input on all outputs, whereas the ADM is used to infer how one output is influenced by all inputs.
Since the tangent linear and adjoint operators, L, L T, of the MITgcm are already available, Reference Bindschadler, Vaughan and VornbergerEqns (2) and Reference Giering and Kaminski(5) indicate that the work of obtaining a sub-ice-shelf cavity-enabled GCM is incremental, consisting mainly of the generation of an adjoint for the operators ∂q(t )/∂x(t ), which connect the model derivative at any time, t, to the melt-rate derivative.
Equation (5) implies that the adjoint integration occurs in reverse, carrying a scalar-valued unit perturbation, δq(t )T = δ *q(t ) = 1, at time t = τ f to time t = 0. It also implies that intermediate sensitivities at any time t are calculated and can be saved (e.g. for transient sensitivity analyses) within the integration.
Use of algorithmic differentiation
Rigorous application of algorithmic or automatic differentiation (AD) (Reference Griewank and WaltherGriewank and Walther, 2008) is key to the adjoint code generation of the MITgcm. The model has been developed from the outset with the perspective that adjoint modelling would be an important application (Reference Marotzke, Giering, Zhang, Stammer, Hill and LeeMarotzke and others, 1999). The AD tool used initially was the ‘tangent linear and adjoint model compiler’ (TAMC) of Reference Giering and KaminskiGiering and Kaminski (1998). Care was taken that coding was compatible with the AD tool’s language parsing and active flow dependency analysis capabilities and limitations. The two major initial applications were the use of the MITgcm adjoint to investigate Atlantic meridional heat transport sensitivities (Reference Marotzke, Giering, Zhang, Stammer, Hill and LeeMarotzke and others, 1999), and the use of the gradient of a least-squares model vs data misfit objective function in a gradient-based optimization of the MITgcm to available satellite and in situ observations as part of the ECCO consortium (Reference StammerStammer and others, 2002a, Reference Stammer, Wunsch, Fukumori and Marshallb).
Over the last decade, in a strongly symbiotic effort, both the MITgcm and the AD tool have evolved and matured significantly. The MITgcm evolved from code optimized for vector machines to code that can be adapted to various vector and parallel high-performance computing architectures by means of a flexible domain decomposition. The support routines, in which the adjoint code inherits the domain decomposition of the forward model (Reference Heimbach, Hill and GieringHeimbach and others, 2005), are the only part of the MITgcm adjoint code that is handwritten. The MITgcm has pushed the limits of the AD tool, which in turn has matured, and is now known in its commercial version as ‘transformation of algorithms in Fortran’ (TAF) (Reference Giering, Kaminski and SlawigGiering and others, 2005).
The AD approach has ensured that, over time, the adjoint model has kept up to date with various forward-modelimprovements, the inclusion of new model packages and application of the adjoint to various problems (for a recent overview of examples see Reference HeimbachHeimbach, 2008). Various tutorial introductions to AD in the context of ocean and ice-sheet modelling are available (e.g. Reference Giering and KaminskiGiering and Kaminski, 1998; Reference Marotzke, Giering, Zhang, Stammer, Hill and LeeMarotzke and others, 1999; Reference WunschWunsch, 2006; Reference Heimbach and BugnionHeimbach and Bugnion, 2009), and the MITgcm online manual has a dedicated chapter on this subject (MITgcm Group, 2011, ch. 5). It is crucial to realize that there is no unique adjoint model. Its structure and detail depends on the application, in particular on the choice of objective function and control variable (e.g. Reference Losch and HeimbachLosch and Heimbach, 2007).
In the context of AD of the sub-ice-shelf cavity capability, the general structure of the MITgcm is important. Because the sub-ice-shelf cavity capability is implemented as a separate package, the adjoint development largely consisted of incremental work to ensure that the package was properly handled by the AD tool and that correct and efficient adjoint code was generated.
We note that for legacy codes the application of AD is not necessarily straightforward. Significant code adaptation may be necessary to render it compatible with the requirements (or limitations) of the specific AD tool.
2.3. Pine Island Ice Shelf configurations
The domain chosen for our simulation is the immediate surroundings of the PIIS in the Amundsen Sea embayment, covering an area of 90 × 108 km2, between roughly 74°3’ S and 75°2’ S and 102°2’W and 99°1’W. The domain covers the entire floating ice shelf. It has one open boundary to the west with the wider Amundsen Sea embayment (the northern boundary is closed).
We present a high-resolution configuration at (1/32)° horizontal resolution in spherical coordinates, corresponding to 900±30m cell widths. Coarse-resolution configurations are also available, as they remain practical for global coupled climate simulations for the time being, but are not shown here. The configuration has an evenly spaced vertical grid consisting of 50 vertical z-levels of 20mcell thicknesses. The high vertical resolution ensures that the temperature gradient under the ice shelf is well represented. (Table 1 lists further numerical details.)
Some numerical model parameters and properties of the (1/32)° configuration

The high-resolution adjoint set-up was configured to run in parallel on 16 processors, with the full domain (Nx × Ny = 100 × 120) decomposed into 16 tiles of size Nx × Ny = 25 × 30 each (the choice of tile size represents a trade-off between on-processor floating-point operations per second and cross-processor communication requirements per time-step). Note that the use of AD ensures that the adjoint model inherits the domain decomposition for parallelization and scalability of the forward model.
Bathymetry and cavity geometry (from Reference TimmermannTimmermann and others, 2010) are shown in Figure 1. The initial state used for the 1 year combined forward and adjoint calculation was obtained from a 10 year spin-up calculation. The spin-up itself was initiated from climatological fields for temperature and salinity based on recent auto-sub measurement (Reference JenkinsJenkins and others, 2010) with open boundary conditions that are estimated from in situ data (five hydrographic stations along the edge of the ice shelf; personal communication from M. Schröder, 2011). The combined forward and adjoint calculations are performed over a 1 year period. They begin with a 1 year forward integration starting from the 10 year spin-up to establish the state around which the model is linearized, i.e. for which all adjoint derivative expressions are evaluated, followed by the backward adjoint integration itself. The integration inherits the time-stepping behavior of the forward model. Because the adjoint model is integrated backward in time, the state variables are required in reverse order compared to the forward model. To alleviate excessive storing or recomputations to make the state variable available to the adjoint model, a hierarchical check-pointing algorithm is incorporated in the MITgcm adjoint code (Reference Heimbach, Hill and GieringHeimbach and others, 2005). This algorithm ensures that forward state variables that are required to evaluate the derivative (e.g. for nonlinear expressions or conditional statements) are available in reverse order. Snapshots of the adjoint state (i.e.the sensitivities) are saved at 2 day intervals to enable detailed transient sensitivity analyses.
Bedrock bathymetry (m) in color and water column thickness (contours, 100m intervals) of the (1/32)° (900 ± 30 m) horizontal resolution model. The white contour indicates the ice edge, the white crosses the position of the three hypothetical drilling sites discussed in Section 3.3.

Our control space here consists of the 3-D initial state (temperature, salinity, velocity), which includes values at the open boundaries. Because of the nature of the adjoint integration, Eqn (5), this gives us access not only to the sensitivities of J to perturbations at initial time, but also to perturbations at arbitrary intermediate times (the Lagrange multipliers of the discretized model equations). Given the limited size of the domain, changes at the open boundaries (here the western boundary) at any time will influence the flow in the interior. Access to the time-varying 3-D Lagrange multiplier fields of the model state enables us to infer sensitivities to changes in open boundary conditions through time as well. Examples of how to take advantage of this and formulate adjoint-based open boundary estimation and control problems are described by Reference Ferron and MarotzkeFerron and Marotzke (2003), Reference AyoubAyoub (2006) and Reference Gebbie, Heimbach and WunschGebbie and others (2006).
Somewhat arbitrarily here, but as a useful example and in practice mandated by the question of interest, we choose our objective function, Eqn (1), to be an average over Δτ = 1 month. Alternative choices (e.g. melt rate evaluated for the very last time-step, or melt rate averaged over the entire 1 year integration period) are perfectly valid, and the particular choice needs to be taken into account when interpreting the transient sensitivity patterns. The shorter the averaging period, the sharper the transient sensitivity patterns will be. What we obtain by choosing the averaging period over the last month is a superposition of sensitivities that are still accumulating (the objective function is still ‘active’) and those that are propagating away from the objective function’s source region.
3. Results
3.1. Forward solution
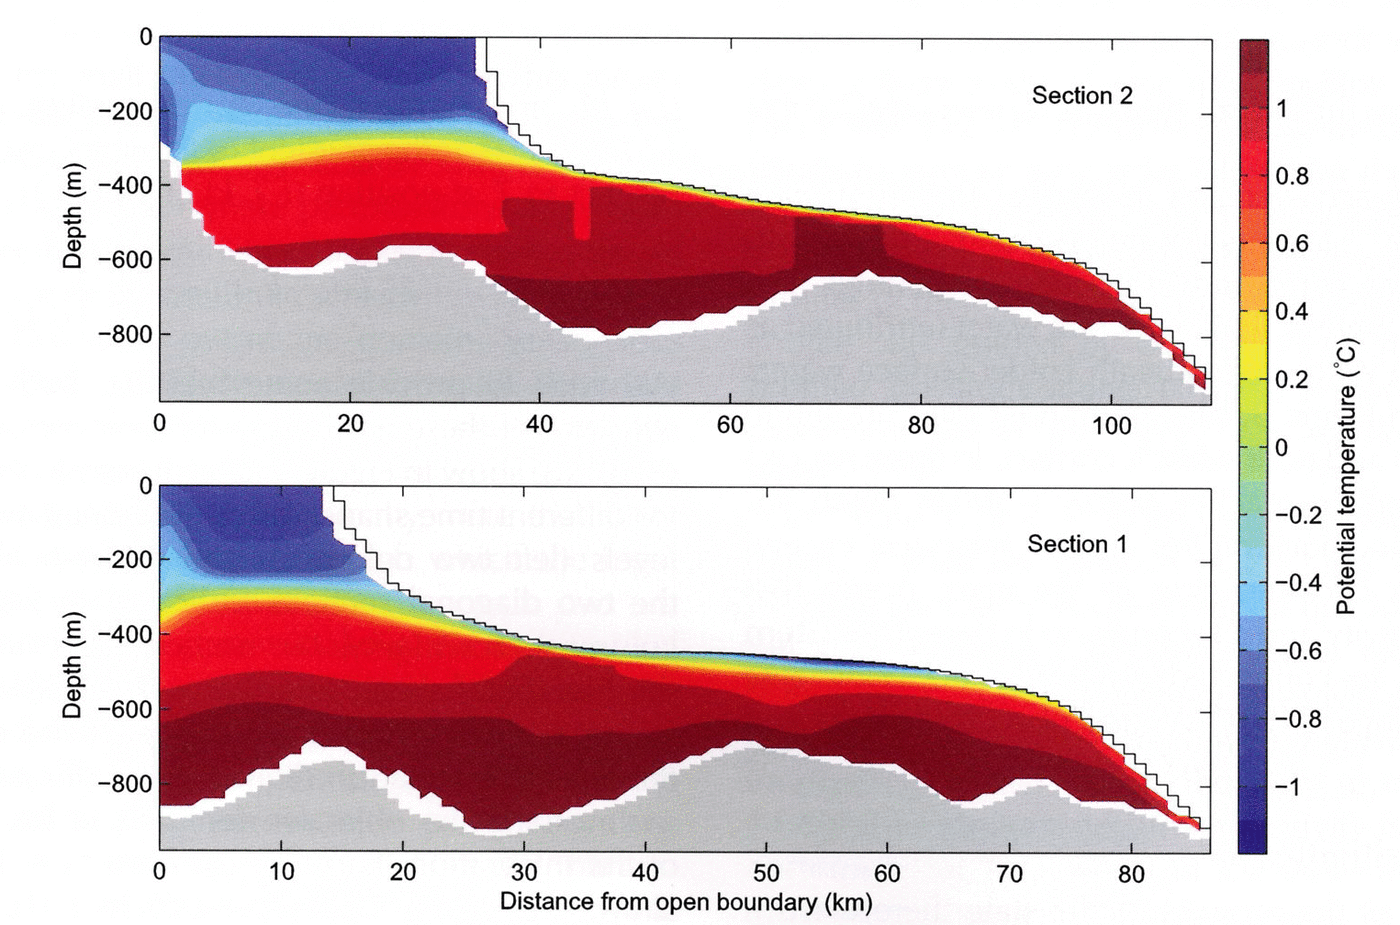
Figure 2 shows the mean melt rate (in color) and vertically integrated stream function (0.05 Sv interval contours). Time-averaged potential temperature distribution (°C) along two sections, marked by solid and dashed lines in Figure 2, is depicted in Figure 3, labelled as section 1 and section 2. The banded structure of the melt-rate field appears due to the partial cell representation of the ice bathymetry, as described by Reference LoschLosch (2008): thin cells cool faster and (vertical) mixing is not fast enough to homogenize the temperature field along the underside of the ice. A boundary layer scheme (described by Reference LoschLosch, 2008) reduces this inhomogeneity. Further tuning of the scheme seems warranted, but the banded structure has a negligible effect on the overall solution, so we postpone this tuning exercise.
Mean melt rate (m a–1) in color and vertically integrated stream function (contours, intervals 0.05 Sv, where 1 Sv = 106 m3 s–1). The cyan lines show the location of section 1 (solid) and section 2 (dashed).

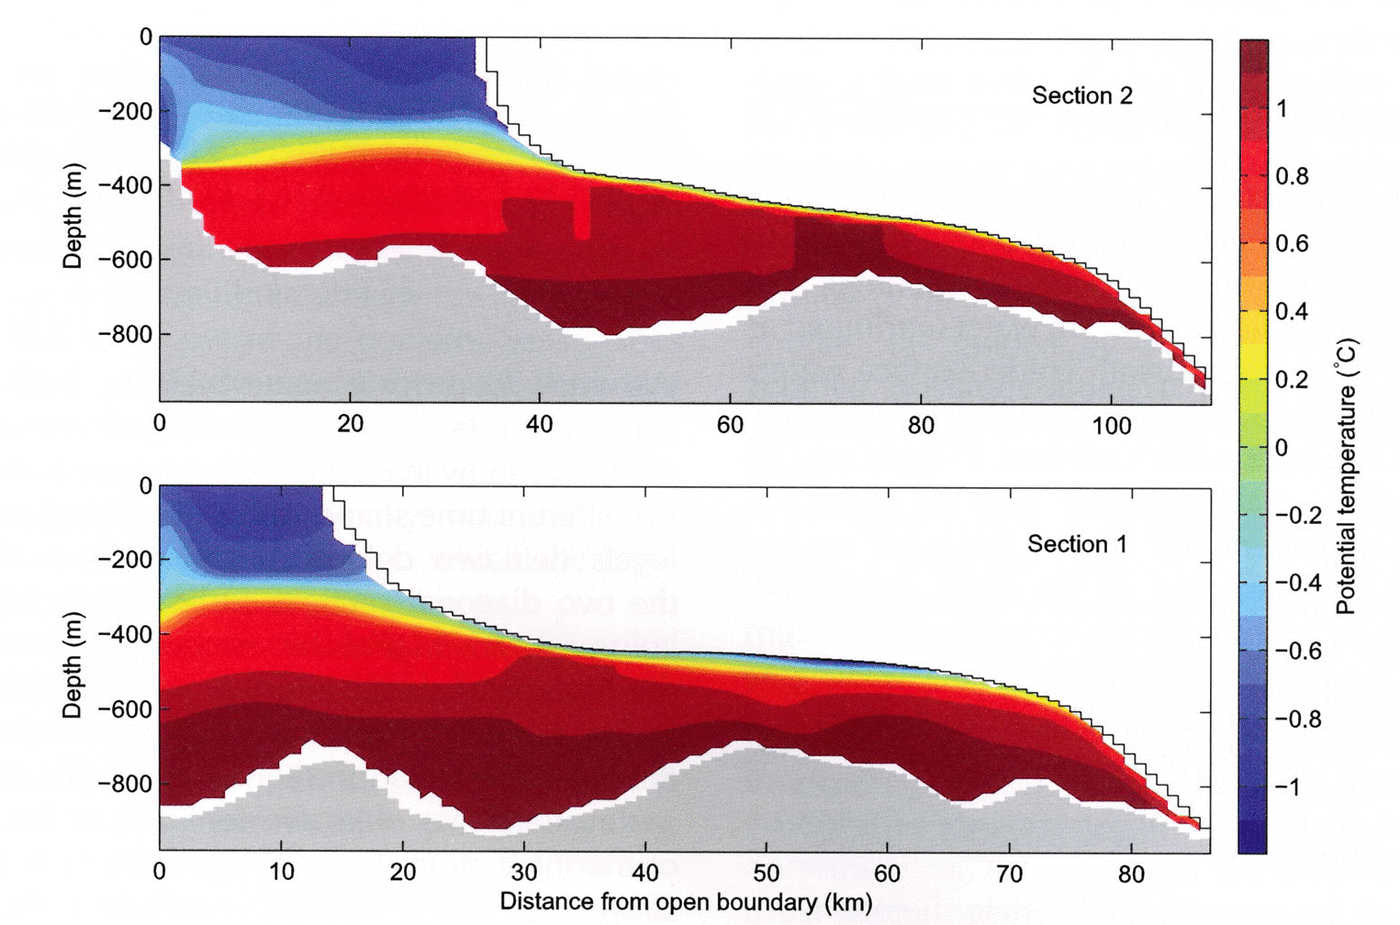
The time- and space-averaged freshwater flux (melt rate) is roughly –22ma–1 (freshwater flux is positive upward so that negative values correspond to ocean freshening). The layering of deeper (below ~400 m) warm water (attributed as Circumpolar Deep Water) underneath colder surface waters is clearly visible in Figure 3. Maximum melt rates are found in the southeastern and northeastern corners. In these regions the ice/ocean interface reaches below ~500m depth (cf. Fig. 1), and ocean temperatures at the interface exceed 0.5°C. There is a cyclonic gyre in the open ocean that barely enters the cavity and a second one in the southeastern cavity. These gyres are connected by a third anticyclonic gyre over the seabed ridge at 101°W, described by Reference JenkinsJenkins and others (2010).
3.2. Adjoint sensitivities
For each variable of the forward model state there exists a dual variable of the adjoint model state. Focusing most of our discussion on temperature, T (i, j, k, t ), at each point in space, (i, j, k), and time, t , the corresponding adjoint variable, δ *T (i, j, k, t), is the gradient of the objective function, J, with respect to T at position (i, j, k) and time t :

We wish to provide some insights, both into the spatial structure of these gradients and their transient behavior. To do so, we show in Figure 4 adjoint sensitivities, δ *T (i, j, k, t ), for different time snapshots as horizontal slices at two depth levels (left two columns), and as vertical sections along the two diagonal sections indicated in Figure 2 (right two columns). For clarity, the section lines are also drawn in the horizontal slices, and the two depth levels are marked in the vertical sections. Noting again the reverse nature of the adjoint integration (Eqn (5)) and the period over which we evaluate the objective function to be the last 30 days of the integration (Eqn (1)), i.e. from τ f – 30 days to τ f, we show, from top to bottom, sensitivities 10, 30 and 60 days back in time from τ f . Overall, sensitivities are predominantly negative, indicating an increase in melt rates with increasing temperatures (negative values of q correspond to freshening of the ocean).
Adjoint sensitivities, δ *T = (∂J/∂T)T, at t = τ f–10, –30 and –60 days. Horizontal slices at z = –350 and –650m on the left-hand side, vertical sections on the right-hand side. The solid lines in the horizontal-slice plots indicate section 1 and the dashed lines indicate section 2. The solid and dashed lines in the vertical-section plots indicate the positions of the horizontal slices. The black crosses mark the position of the profiles in Figure 5. Units of sensitivities are m3 s–1 K–1, where 0.1m3 s–1 K–1 ≈ 3 Mt a–1 K –1 ≈ 3 mma–1 K–1.

Note that in our terminology, the interpretation of adjoint sensitivities which are integrated backward in time is frequently mixed with their translation into the evolution of perturbations forward in time. Thus, in analyzing transient behavior and time evolution we usually imply backward-in-time evolution when describing sensitivity propagation (top to bottom in the figures), but forward-in-time evolution when discussing the propagation of perturbations. Also note that we are not considering responses, which would be obtained by multiplying the calculated sensitivities by expected (or calculated) anomalies, e.g. of the form  .
As context for interpretation, we recall that melt rates are largest in the southeastern and northeastern corners of the domain (Fig. 2). Therefore, the sensitivities at the beginning of the backward integration are confined mostly to these areas, and spread out over backwards-running time. Our discussion focuses on two broad sensitivity patterns, one emerging from the northern mid-depth part, and one from the southeastern deep interior of the cavity. We gain insight into the dominant pathways by following the sensitivities backward in time.
By τ f–10 days the largest sensitivities are still mostly found near the ice/ocean interface because the objective function, J, is an average over the last 30 days of the integration, and is thus still locally accumulating. At the same time, the southeastern sensitivity pattern has started to move away from its origin, with the interior-cavity cyclonic gyre and then the anticyclonic gyre across the ridge at 101° W. The northern sensitivity pattern evolves more slowly because the forward circulation is weaker.
By τ f – 30 days the southeastern sensitivity below 400 m has moved further towards the western open boundary of the domain, while some of the northern sensitivity has already reached the boundary in a narrow strip around 300 m depth. The objective function, J, is a time mean, such that the sensitivities are accumulated over this averaging period, which explains the persistent (apparently stationary) sensitivity deep inside the cavity.
By τ f – 60 days the sensitivity amplitudes in the cavity’s deep interior have subsided because the objective function stopped ‘measuring’ melt rates at τ f – 30 days. This means that no local hydrographic perturbations deep inside the cavity can influence melt rate significantly with a delay of 30 days or longer, and that remote perturbations away from the ice/ocean interface dominate changes in melt rates on this timescale. Some of the melt-rate sensitivities have moved across the open boundary out of the domain. Sensitivities at the western open boundary would form an important ingredient for a control problem in which uncertain open boundaries were adjusted to optimally estimate the interior flow and its impact on melt rates. Finally, note that there are regions in the model domain through which the high-amplitude sensitivity patterns never pass.
The large differences in patterns along the two vertical sections illustrate the high spatial variability of the sensitivity pathways. The adjoint sensitivities follow the reverse flow that is topographically steered by the sill at ~700m depth. Instead of propagating along the northern cavity boundary, the sensitivities in the horizontal map turn at the sill. This turn is the same deflection, albeit in reverse direction, that flow in rotating frames of reference undergoes in order to preserve potential vorticity (compensation of vortex stretching through changing relative vorticity of the water column) when it encounters changing topography. Indeed, the sensitivity tells us that a perturbation applied to the forward model to the west of the sill near the southern boundary would be deflected northward after crossing the sill, and a perturbation entering the deep cavity interior near its northern boundary would be deflected southward on reaching the sill and then northwards after crossing it.
Sensitivities with respect to salinity (δ *S = (∂J/∂S)T) have a very similar pattern to those of temperature but with reversed sign (not shown); thus, salinity decreases or temperature increases at a given point imply larger melt rates. At first this appears counter-intuitive, because the deep water reaching the cavities is usually warm and saline and thus warmer water is associated with more salinity. The adjoint sensitivities, however, do not ‘know’ anything about oceanographic water masses that have their origin in complicated generation processes far away from the study area. All components of the adjoint sensitivities (i.e. the gradient) are independent of each other. We interpret the salinity sensitivities as follows. Physically, salinity decreases or temperature increases imply more buoyancy. Less buoyant (more saline) water cannot rise as far along the inclined ice/ocean interface and thereby reduces the contact time of warm water with ice. In contrast, more saline water also reduces the freezing point of sea water, leading to more melting. The sign of the adjoint sensitivities with respect to salinity indicates that the buoyancy effect due to salinity dominates over the freezing-point effect.
3.3. Perturbation experiments and implications for monitoring
The rich information contained in the sensitivity maps can be explored in a variety of ways. Here we sketch how it would be possible to take advantage of adjoint sensitivity information in planning an observational campaign.
Consider an expedition to the PIIS with the goal of measuring near- and under-ice-shelf hydrography by means of conductivity–temperature–depth (CTD) casts, drilling through the ice shelf and autonomous underwater vehicle (AUV) deployment. In choosing the drilling location, a variety of criteria have to be considered and balanced. Among them is the choice of a position that is well suited for connecting (i.e. correlating) local hydrographic measurements to remote melt rates. How can the adjoint melt-rate sensitivities support the choice of suitable positions?
To address this question, in Figure 5 we plot three vertical profiles of melt-rate sensitivities as a function of time, whose choice was guided by the sensitivity maps (Fig. 4). The profiles’ positions along 101°W, a meridian crossing the prominent sill in the cavity, are marked in Figure 1 as white crosses.
Vertical sensitivity profiles as a function of time for three locations along the same meridian (101°W). Time is confined to the first 60 days of the adjoint integration. Units (as in Fig. 4) m3 s–1 K–1.

In Figure 5, at τ f – 30 days and between 600 and 650m depth, a southern position at 75.21° S indicates a strong negative sensitivity (southern tip of the ‘loop’ located across the sill), whereas a position slightly further to the north (75.16° S) suggests a slightly positive sensitivity (i.e. an increase in temperature there would decrease the melt rate). Proceeding further north, the sign reverts again, and at 74.89° S a moderate negative sensitivity is again visible. The corresponding time series of the three profiles in Figure 5 illustrate the sensitivity evolution and its vertical structure. The behavior, especially the sign reversal along the 101°W meridian, is surprising and warrants independent testing to confirm the adjoint results. To do so, we conducted a separate forward finite-difference perturbation experiment for each of the three locations. The calculation consisted of restarting the forward model from time τ f – 26 days, but applying a temperature perturbation of ΔT = +0.3°C in a 3-D box of 4 × 4 × 4 gridpoints centered around each individual location (identical longitudes, 101° W, and depth levels 640 m). The resulting melt-rate anomalies with respect to the unperturbed ones are plotted in Figure 6 as a function of time over the final 26 day time interval. These experiments, which do not use the adjoint model, confirm the ‘predictions’ of the adjoint sensitivities, i.e. a strong negative anomaly (significantly increased melt rates) for the southernmost location, a positive anomaly (decreased melt rates) slightly further north and a moderate (and time-lagged) negative anomaly at the northernmost position. Signs and amplitudes of the adjoint sensitivities at all three locations are thus confirmed via the finite differences.
Time series of melt-rate anomalies inferred from three independent finite-difference perturbation experiments at the locations considered in Figure 5. In each case a perturbation of +0.3°C was applied in a 4 × 4 × 4 gridpoint box centered around 640 m depth and run forward in time for 26 days.

There are significant implications for hydrographic instrument positioning. The strong sensitivity at the southernmost location seems to make it an efficient location if melt-rate variability is to be inferred from or correlated with these measurements. In contrast, measurements of a 0.3°C temperature increase obtained slightly further to the north would be misleading if interpreted naively as connecting increased temperatures to increased melt rates.
There are also important caveats. The first set of caveats refer to the formulation of the sensitivity problem. Choosing a different objective function (e.g. melt rates at a specific location as opposed to the sub-shelf integral, or instantaneous melt rates vs time averages) may alter the sensitivity pattern. In general, the averaged sensitivities are superpositions of the pointwise sensitivities in space or time. Their interpretation will also depend on whether responses (= sensitivities × perturbations) are to be calculated from correlated or uncorrelated control variable perturbations. Care needs to be taken, therefore, in formulating the objective function so it matches the science question addressed. Alternatively, a series of sensitivity calculations for different objective functions could be performed, and inferred patterns compared. A second set of caveats refer to the fact that the sensitivities are model-based, and corroboration is needed of
-
1. whether the model represents the regional circulation with sufficient skill, and
-
2. how robust the sensitivity patterns are in the face of realistic hydrographic variability.
Preceding the sensitivity calculation by an estimation study is an attractive strategy for addressing (1). Such an estimate makes available a reference state that has been fitted to the already available observations. Dealing with (2) could entail an ensemble of sensitivity studies for perturbed baseline trajectories to assess which patterns are robust (e.g. determined more by local topography than hydrographic variability), or recurring (e.g. predominant circulation). In any case, conducting a comparatively cheap modelling study, as presented here, seems warranted in the mix of decision tools for planning a comparatively expensive expedition such as the one imagined.
4. Discussion and Conclusion
Following the first implementation of sub-ice-shelf cavity circulation and melt-rate parameterization in a z-coordinate model (Reference LoschLosch, 2008), we have extended the MITgcm’s adjoint capability by including the corresponding code package in the adjoint code generation procedure. Rigorous application of AD made the required development straightforward, and only incremental steps were required in adjusting the code package.
The adjoint’s utility was demonstrated by studying the sensitivities of melt-rates under the PIIS to changes in sub-ice-shelf cavity circulation. The time-evolving sensitivities to changes in the oceanic state reveal dominant timescales over which the sub-shelf cavity entrance is connected to the deep interior of the cavity and its ice/ocean interface. The dominant pathways were found to be highly nonuniform. Topographic effects as a result of rotation are important in connecting outer water mass properties to sub-shelf circulation and to its impact on melt-rate changes.
The sensitivity amplitudes are determined by the linearized three-equation melt-rate parameterization and may offer insights into the complex interplay between the temperature, salinity and pressure variations considered here. An important question that one can begin to address is ‘What are the dominant controls on sub-ice-shelf melt rates?’ In doing so, one needs to extend the control space to include those controls whose variations are expected to exert significant changes on our objective function. In the present context of the small PIIS box, a dominant control is clearly the provision of uncertain western hydrographic boundary conditions. The spatial sensitivity pattern, which seems to be determined in part by the bathymetry, suggests bottom topography as a further control parameter (Reference Losch and WunschLosch and Wunsch, 2003; Reference Losch and HeimbachLosch and Heimbach, 2007), particularly in light of the recent discovery of a ridge underneath the PIIS (Reference JenkinsJenkins and others, 2010) and prominent features at the ice-shelf base (Reference Bindschadler, Vaughan and VornbergerBindschadler and others, 2011; Reference Rippin, Vaughan and CorrRippin and others, 2011). Another source of uncertainty comes from the poorly determined turbulent exchange coefficients for heat and salinity. In the absence of observational constraints we chose them constant here, but they are obvious choices to be added to the space of control variables. In the Appendix we sketch how the adjoint code would change as a result, and how it would be handled by AD. Melt rate itself is an alternative parameter to be estimated directly in an inversion.
The high degree of spatial variability, with regions exhibiting large (and recurring) sensitivities in the vicinity of others with little apparent sensitivities, has important implications for observation and monitoring. To the extent that these spatial patterns are robust they provide valuable information for guiding observational campaigns (e.g. for under-ice-shelf instrument deployment, or the determination of suitable drilling positions on the ice shelf for hydrographic instrument lowering). We advocate that studies such as this should be extended and considered in the mix of decision-making tools for designing an observing system.
The above discussion suggests ways in which the present study can be extended. Putting the PIIS in the context of the regional circulation of the Amundsen Sea and that of the wider Southern Ocean calls for an increase in the domain size to capture in more detail remote oceanic and atmospheric forcings of the PIIS circulation variability. This would also include atmospheric forcings as control variables. Suitable boundary conditions that capture the strong eddy variability of the Antarctic Circumpolar Current could come from optimized regional products, such as the Southern Ocean State Estimate (Reference Mazloff, Heimbach and WunschMazloff and others, 2010) or regional very high-resolution ECCO2 products (Reference Schodlok, Menemenlis, Rignot and StudingerSchodlok and others, 2012). With these extensions, comprehensive estimates of the regional circulation, melt rates and other uncertain parameters from all available hydrographic observations seem possible. An important caveat is the ability of the model to represent the relevant processes investigated. In the present example, omission of tidal forcing is likely to be an important source of error. Ideally, such imperfect representation should be assessed in the framework of an estimation system.
A long-term perspective is the ability to constrain the coupled ocean/ice-shelf system in which ocean circulation interacts with ice dynamics, through the combined use of hydrographic and ice-shelf observations. Such a coupled estimation system would weigh melt-rate changes, and thus sub-ice-shelf geometry changes mandated by oceanic observations, against ice-shelf geometry changes imposed by ice-flow speed and thickness observations, through adjoint sensitivity propagation between the components of the coupled model.
Acknowledgements
The authors benefited greatly from discussions with and encouragement from Adrian Jenkins, Paul Holland and Keith Nicholls. We thank Mike Schröder for providing the hydrographic data for setting up the model domain. This work is supported in part by the US National Science Foundation and NASA’s continued support of the Estimating the Circulation and Climate of the Ocean (ECCO) projects (ECCO-GODAE (Global Ocean Data Assimilation Experiment) and ECCO2). Useful comments and suggestions by two anonymous reviewers and the scientific editor helped to improve the manuscript.
Appendix: Melt rate Parameterization Gradients
Generating the adjoint code of the melt-rate parameterization is the technical innovation of this study. Rather than reproducing the full adjoint model, we highlight a few aspects that are related to algorithmic differentiation (AD).
Melt rates under the ice shelf are parameterized via a three-equation system (Reference Hellmer and OlbersHellmer and Olbers, 1989; Jenkins and others, 2001) for the freshwater flux, the heat flux balance and the water temperature at the ice/ocean interface:

Here, ρ is the density of sea water, cp
= 3998 J kg–1 K–1 the specific heat capacity of water and γ
T the turbulent exchange coefficient of temperature with values discussed by Holland and Jenkins (1999); Losch (2008) used γ
T = 10–4 ms–1. L = 334 kJ kg–1 is the latent heat of fusion. ρ
I = 917 kgm–3,  and T
S are the density, heat capacity and surface temperature of the ice shelf; κ = 1.54 × 10⁻⁶ m2 s–1 is the heat diffusivity through the ice shelf and h is the ice-shelf draft. The second term on the right-hand side of the heat flux balance describes the heat flux through the ice shelf. A constant surface temperature, T
S = –20°C, is imposed. T is the temperature of the model cell adjacent to the ice/water interface. The temperature at the interface, T
b, is assumed to be the in situ freezing-point temperature of sea water, T
f . The freshwater flux, q, is positive upwards, such that negative values indicate ocean freshening. It is a function of salinity of the model cell adjacent to the ice/water interface, S, and at the interface, S
b. γ
S = 5.05 × 10⁻³
γ
T is the turbulent freshwater exchange coefficient.
The melt rate, −q(t ), is (through S b) an implicit function of T , S and p, because the solution of Eqn (A1) involves a quadratic problem for S b as a function of T , S and p, whose roots have the general structure:

The coefficient, B, and discriminant, D, are functions of T , S and p; whereas A is a function only of the transfer coefficients, γ T and γ S, which are here assumed constant.
In the following we show that while q is an explicit function of S and S b, its implicit dependence on T , S and p is obtained through application of the chain rule, which is at the heart of AD.
The total derivative of q(S(t ), T (t ), p(t )) at a given time, t, is

This derivative explicitly depends on S b itself. It is evident from Eqns (A2) and (A3) that the derivative code can become complicated.
S b and, thus, δq depend on the state itself through coefficients A, B and D and the relative magnitudes of A, B and D. Therefore, the control flow requires the evaluation of two derivative expressions subject to a conditional statement (IF-statement). AD ensures correct adjoint code by rigorous application of the chain rule and generation of code for each conditional branch.
So far we have chosen the simplest control space possible that consists only of the model state variables. Various alternatives or extensions are possible. For example, we could add the (unknown) transfer coefficients γ T and γ S to the set of control variables. We see immediately, that in this case the derivative expression, Eqn (A3), would need to be augmented as follows:

This simple case illustrates that the tangent linear and adjoint models are not ‘unique’, even for a fixed forward model, but vary in structure depending on the choice of control variables. For estimation purposes, choosing melt rate directly as a control is an attractive choice, and will be discussed elsewhere.