Implications
This field study on Swedish commercial dairy farms showed the differences in P feeding between organic and conventional systems (CS) and examined different sampling methods for assessing P overfeeding of dairy cows. The results showed an over supplementation of P in both systems, more significant in the CS. The methods that were used were analysis of the soluble P in faeces as well as total P in faeces.
Introduction
Phosphorus (P) deficiency in dairy cattle can lead to depressed appetite and decreased milk production (Valk et al., Reference Valk, Sebek and Beynen2002). However in Europe and the United States, where deficiency is unusual, the current emphasis is on diminishing P from dairy operations because P overloading can be harmful to the environment (Nennich and Harrison, Reference Nennich and Harrison2008). Many studies have shown that dairy cows are often fed more P than they require according to current recommendations (Wu et al., Reference Wu, Satter, Blohowiak, Stauffacher and Wilson2001; Valk et al., Reference Valk, Sebek and Beynen2002; Knowlton et al., Reference Knowlton, Radcliffe, Novak and Emmerson2004; Nennich and Harrison, Reference Nennich and Harrison2008). Manure from dairy cows fed high levels of P has been shown to increase the potential for P runoff losses (Ebeling et al., Reference Ebeling, Bundy, Powell and Andraski2002). Dealing with P losses from livestock production is becoming increasingly important as farms grow larger in number of animals and the P load thereby is becoming concentrated to these spots. Furthermore, P is a finite resource (Cordell et al., Reference Cordell, Drangert and White2009). Therefore it is important to find relevant methods to detect overfeeding. The amount of P excreted with manure depends on P intake and the level of milk production, but under practical conditions more than two-thirds of the P consumed by cows is excreted with manure (van Horn et al., Reference van Horn, Wilkie, Powers and Nordstedt1994). In contrast to many other species, for example pigs, adult ruminants normally excrete excess P in faeces, while only trace amounts of P are excreted in urine (Valk et al., Reference Valk, Metcalf and Withers2000). When potentially absorbable P is provided in sufficient amounts or in excess, dairy cows have a profound ability to excrete the P surplus with faeces, largely as water-soluble inorganic P (Dou et al., Reference Dou, Knowlton, Kohn, Wu, Satter, Zhang, Toth and Ferguson2002; Ekelund et al., Reference Ekelund, Spörndly, Valk and Murphy2005). This fraction can serve as an indicator of excessive P feeding on farms (Dou et al., Reference Dou, Ramberg, Chapuis-Lardy, Toth, Wang, Munson, Wu, Chase, Kohn, Knowlton and Ferguson2007). Studies describing P feeding to ruminants on organic dairy farms appear to be lacking. Locally produced feeds rich in P, such as rapeseed meal, are commonly used in organic production and can possibly increase the P intake. On the other hand, the rations used for organic dairy herds have a higher proportion of forage, which generally has a low P content. This may reduce P intake by the cows. Thus one aim of this study was to screen P intake and faecal excretion of different P fractions in cows from conventional and organic dairy farms, in order to compare the two systems. A second aim was to compare P feeding in Swedish dairy herds with the current recommendations on P feeding. A third aim was to study different sampling and analysis methods for assessing the general status of P feeding on dairy farms.
Material and methods
This experiment was approved by the Uppsala Local Ethics Committee. During the winter of 2009 to 2010, 14 organic and 15 conventional farms participated in the current study. The farms chosen had earlier participated in a field study by Fall et al. (Reference Fall, Gröhn, Forslund, Essen-Gustafsson, Niskanen and Emanuelsson2008), to which 20 conventional and 20 organic farms were randomly selected from a group of 283 conventional farms and 52 organic farms. The 40 farms of the study of Fall et al. (Reference Fall, Gröhn, Forslund, Essen-Gustafsson, Niskanen and Emanuelsson2008) were all invited to participate in the current study and 29 of them agreed. Farms were located in southern Sweden (58°N to 60°N; 15°E to 19°E) and the cows were of the Swedish Holstein or Swedish Red breed. During the study all cows were housed indoors. The 14 organic farms were managed according to European Union standards and certified by the Swedish certification organisation for organic production (KRAV, 2008). According to the standards, organic dairy cows should be fed 100% certified organic feed, plus roughage ad libitum.
Within each herd, 10 cows in different stages of lactation were selected for faecal sampling. These comprised three cows in early lactation (from parturition until 3 months postpartum, lactation period (LP) 1); three cows in mid-lactation (4 to 5 months after calving, LP 2); two cows in late lactation (8 to 10 months after calving, LP 3); and two dry cows <2 months before expected calving (LP 4). Faecal samples were obtained from each cow by rectal grab sampling (1 kg fresh weight), stored at –20°C and handled individually throughout laboratory analysis. Samples of bulk stored slurry were taken on 26 of the farms and stored at −20°C. This slurry was a mixture of faeces, urine, bedding, some feed residuals and in some cases rinse water from the milking system. Slurry samples (1 kg fresh weight) were taken from the slurry storage tank after stirring with the pump for at least 10 min.
Daily feed consumption of the 10 selected cows on each farm was recorded during a 24-h period by weighing individual feed allocations or, when cows were fed in groups, by weighing the feed allocated to the group and dividing it by the number of animals. All farms practiced individually concentrate rations that was monthly adjusted and, in most cases, fed by computerised feeding equipment assuring constant daily allotment. The roughage, however, was in the loose housing systems distributed to a group where less accuracy as too individual daily variation was possible. All feeds used were sampled at the farm and stored at −20°C before P analysis. Data on daily milk production by the selected cows were obtained from the official milk records closest in time, not exceeding 14 days from the visit. Data on aspects of the dairy herd, such as herd size, average yearly milk production data, cow breeds and the calving date of each cow, were collected from the official milk recording scheme.
Descriptive statistics
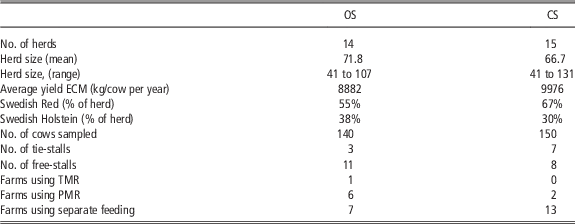
The organic and conventional herds studied were of comparable size, with an average herd size of around 70 cows (Table 1). In this study 290 cows were sampled, 140 of which were in organic systems (OS). The distribution of primiparous cows was similar between the management systems (MS). The feeding was managed differently depending on the housing system. Most conventional systems (CS) used separate feeding, with the concentrate fed separately from the roughage. For the OS, feeding a mixture and feeding the roughage separately from the concentrate were equally common (Table 1).
Descriptive statistics of the herds with OS and CS

OS=organic system; CS=conventional system; TMR=total mixed ration; PMR=partially mixed ration; at least 50% of the concentrates were fed separately.
Laboratory methods
After thawing, a subsample of the faeces was taken and immediately refrozen to –80°C, followed by freeze-drying and grinding in a hammer mill using a 1-mm sieve (Kamas, Malmö, Sweden). Thereafter the samples were stored until analysis of total P (TP). The remainder of the faeces stored at −20°C was thawed before analysis of soluble P (SP). The feed samples and the samples from the slurry storage tank were thawed, dried at 60°C for 18 h and ground to pass a 1-mm sieve. The feed, faeces and slurry samples were analysed for TP by plasma emission spectrometry in an accredited commercial laboratory (Agrilab, Uppsala, Sweden). The SP in the faeces was determined using a slightly modified version of the method described by Dou et al. (Reference Dou, Ramberg, Chapuis-Lardy, Toth, Wang, Munson, Wu, Chase, Kohn, Knowlton and Ferguson2007). In brief, 5 g faeces were mixed with 95 ml 12 mM HCl solution and shaken in a tumble shaker for 1 h, after which the mixture was centrifuged at 1800×g for 5 min (Hermle Z383K, Hermle Labor Technik, Wehingen, Germany), filtered through Whatman 42 paper and inorganic P was measured using a commercially available colorimetric kit (PH 1016, 2010; RANDOX, Crumlin, UK).
Ensiled feeds were pre-dried for 18 h at 60°C before milling. The pre-dried ensiled feeds and dry feeds produced at the farm were then milled to pass a 1.0 mm sieve and analysed for dry matter (DM) content (5 h at 105°C) and for ash (3 h at 550°C). In order to adjust for losses of volatiles, silage DM was corrected by 1.4% units as described by Rammer (Reference Rammer1996). For estimation of nutrient content the samples were analysed using the NIR method or for minerals other than P the atomic absorption spectrophotometry method (NMKL, 1998) (Eurofins, Lidköping, Sweden). Data on the composition of the concentrates were taken from the feed declarations by the manufacturers. The nutrient values of interest were: content of DM, P, calcium (Ca), magnesium (Mg), metabolisable energy (ME), CP, NDF and estimated amino acids absorbed in the duodenum (AAT, calculated as described by Madsen et al., Reference Madsen, Hvelplund, Weisbjerg, Bertilsson, Olsson, Spörndly, Harstad, Volden, Tuori, Varvikko, Huhtanen and Olafsson1995).
Calculated data input
The P recommendation for each of the selected cows was calculated for one day according to National Research Council data on the nutrient requirements of dairy cattle (NRC, 2001) and the Nordic feed evaluation system Norfor (Volden, Reference Volden2011). The P recommendation according to NRC is calculated as:
 $$\left( {{\rm DMI}\,{\rm }{\times}\,{\rm 0}{\rm .01}{\times}{\rm P}\,{\rm \,\%\,}\,{\rm of}\,{\rm DMI}} \right)\,{\times}\,{\rm 1000}$$
where P as a percentage of dry matter intake (DMI) ranges from 0.32 to 0.36 according to volume of milk production (NRC, 2001). The P recommendation according to Norfor is calculated as:
 $$\eqalignno{{\rm P}\,=\,\left( {{\rm 0}{\rm .03}{\times}{\rm BW}} \right)\,{\plus}\,\left( {{\rm 1}{\rm .6}\,{\times}\,{\rm ECM}} \right)\,{\plus}\,\left( {12\,{\times}\,{\rm LWG}} \right)\, \cr \quad{\plus}\,({\rm 0}{\rm .000334 \ DIP}^{2} -{\rm 0}{\rm .053}{\times}{\rm DIP}{\plus}{\rm 1})$$
As a mean BW of 630 kg was used, a mean value for the two breeds used was obtained (Volden, Reference Volden2011). Live weight gain for primiparous cows was estimated to be 0.25 kg (Spörndly, Reference Spörndly2003). Days in pregnancy (DIP), was set to 0, 8, 148 and 250 days for the four different lactation stage groups (LP 1 to 4), respectively. The production level of energy corrected milk (ECM) was set to the record from the closest test-milking performed at the official milk recording system performed within 15 days from the day of visit.
Statistical analysis
In the models comparing the MS and LPs the lactating cows were treated separately from those for the dry cows. The MIXED procedure was used for this analysis (SAS 9.3, SAS Institute Inc., Cary, USA) with MS and LP as fixed factors and farm was treated as random factor.
LP and MS were treated as fixed variables with the interaction LP×MS included in the model and differences were considered significant at P<0.05. Estimated least squares means were calculated. For the dry cows, a similar model without the LP factor was used.
Differences in P content in slurry from OS and CS farms were tested using the Student’s t-test. Correlations between P content in slurry and the various variables measured on individual cows were calculated after a herd average had been computed from the measurements on the cows. The frequency of mineral feeding on the farms was analysed using a χ 2 test. Differences in the amount of minerals fed were examined using the Student’s t-test.
Results
Comparing conventional v. OS
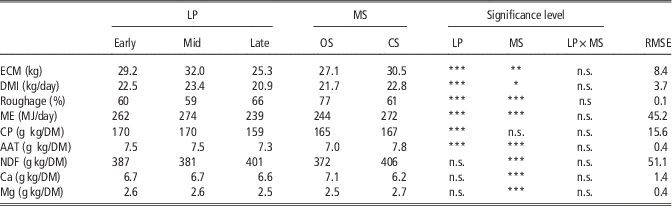
Of the total dataset of 290 cows, 13 cows were omitted from all calculations involving SP in faeces due to analytical errors. Lactating cows in CS generally had a higher DMI and consumed more energy per day than cows in OS (Table 2). The CP content in the rations did not differ between the two systems, but the protein quality calculated as AAT was higher in the rations used in CS. The CS herds were also fed rations with a higher Mg content. The amount of roughage fed as a proportion of the total ration was higher for the OS herds, as was the Ca content, but the NDF content was lower. The yield of ECM was higher among cows in CS herds (Table 2).
Effect of MS and LP on milk yield and ration constituents other than P

MS=management system; LP=lactation period; OS=organic system; P=phosphorus; CS=conventional system; ECM=energy corrected milk, DMI=dry matter intake; Roughage=% of total DM intake; ME=metabolisable energy; AAT=amino acids absorbed in the duodenum.
Values shown are least square means and n=236.
*P<0.05, **P<0.01, ***P<0.001.
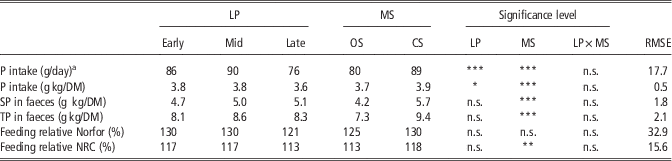
The CS herds had higher P content in the ration and were fed 11% more P on average than the OS herds. In addition, the P intake of CS cows was higher than that of OS cows (Table 3). Both OS and CS cows were fed P in excess of current recommendations according to NRC (2001) and Norfor (Volden, 2011) (Table 3). Supplementation with minerals did not differ significantly (P>0.05) between the two MS. About 90% of both CS and OS farms supplemented the diet of their dairy cows with minerals. The amount of mineral supplement was the same for both systems, on average 93 g per cow and day. However 86% of CS cows were fed rapeseed products, compared with only 43% of OS cows.
Effect of MS and LP on P content in feed and faeces of lactating cows and feeding level relative to NRC or Norfor recommendations

MS=management system; LP=lactation period; P=phosphorus; OS=organic system; CS=conventional system; SP=soluble P; TP=total P; Feeding relative=estimated P intake/recommended P intake.
Values shown are least square means and n=236.
*P<0.05, **P<0.01, ***P<0.001.
a Typical P content (g kg/DM) in feeds: roughages 2.5; cereals; 4.0; SBM 7.0; rapeseed meal 11.0.
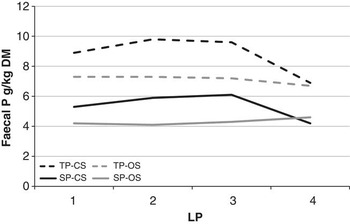
During the dry period, the OS cows were fed 121 MJ ME per day and the CS cows 145 MJ per day, on average. However, protein feeding during the dry period was higher on OS farms, where the protein content in the rations was 138 g kg/DM on average, compared with 122 g kg/DM on CS farms. The P intake and P content in the ration did not differ between the MS during the dry period. Furthermore, there was no difference between CS and OS herds in terms of TP or soluble P concentration in the faeces of the dry cows (Figure 1). The P feeding rate compared with the recommendation for the dry period was 147% (NRC) and 138% (Norfor) for OS cows and 136% (NRC) and 141% (Norfor) for CS cows.
Soluble P (SP) and total P (TP) in faeces for organic system (OS) and conventional system (CS) over the lactation period (LP). LP 1 to 3 is early, mid and late lactation and 4 is the dry period.

The P content in the slurry was significantly higher (P<0.05) for CS herds (6.6 g kg/DM, s.d.=1.34) than OS herds (5.3 g P g kg/DM, s.d.=1.17). The DM content in the slurry was 9% for CS herds and OS herds.
Comparing TP with soluble P
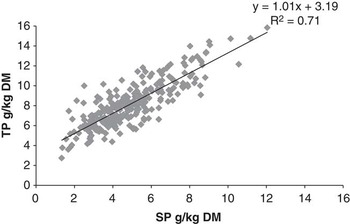
The content of TP in the faeces was 29% higher on CS farms than on OS farms and the content of SP was 36% higher (Table 3). The contents of faecal TP and SP for the three LPs (1 to 3) and the dry period (LP 4) are shown in Figure 1. There were significant differences in P excretion between the MS during the LPs, but these disappeared in the dry period. Figure 2 shows the relationship between TP and SP for all cows, which had a significant coefficient of determination (R 2=0.71). The relationship between dietary P content (g kg/DM) and faecal TP and SP was determined on all cows in the study:
 $${\rm TP}={\rm 2}{\rm .31X}-{\rm 0}{\rm .36};\,R^{{\rm 2}} ={\rm 0}{\rm .24}$$
 $${\rm SP}={\rm 1}{\rm .59X}\,{\minus}\,{\rm 1}{\rm .06};\,R^{{\rm 2}} =0.{\rm 18}$$
where X is the dietary P expressed in g kg/DM, and where TP and SP are also expressed in g kg/DM.
Relationship between soluble P (SP) and total P (TP) in faeces from cows in all 29 herds studied, n=277.

Assessing P overfeeding
The mean P content of the feed for all cows in the study was 3.7 g kg/DM, with a range from 2.1 to 5.2 g kg/DM. In order to examine the accuracy of TP and SP as possible indicators of P overfeeding, the relationship between the P intake relative NRC or Norfor and TP or SP was tested (Table 4). The relationship was poor when all cows were included. The relationship between the P intake relative NRC and SP or TP was stronger when only lactating cows were included. The correlation coefficients based on an average of 10 cows on each farm and on eight lactating cows on each farm further strengthened the correlation.
Pearson’s correlation coefficient (r) for the relationship between P content in faeces and P feeding relative NRC and Norfor

SP=soluble P; TP=total P.
r is computed using individual P data for all cows (n=277 to 290) and only for the lactating cows (n=228 to 236). r is also computed using the farm average for all cows and lactating cows, respectively (n=29). All correlations were significantly different from 0 (P<0.05).
Discussion
Comparison of conventional v. OS
Cows in conventional herds consumed 11% more P than cows in organic herds. The higher intake was to slightly less than half the extent due to higher P content in the feed and the rest due to higher DMI (Table 3). Faeces from CS cows had higher concentrations of P than faeces from OS cows, reflecting the higher P intake of the CS cows. The EU standards for organic milk production stipulate that at least 50% of the daily feed intake has to be in the form of roughage, which generally has a lower P concentration than cereals, protein feeds and other concentrate constituents. This was also reflected in the results and was possibly one of the reasons why the OS cows had a lower faecal P content.
The P concentration as a proportion of feed DM was only slightly higher for the CS herds, and the higher TP allocation of these herds was mainly due to the higher rate of concentrate feeding, which was 39% of the total ration, compared with only 23% for the OS herds, as the amount of mineral supplement fed did not differ between the systems. The constituents of concentrate play an important role in P losses. Soya bean meal (SBM), with a typical P content of 7 g/kg DM, can be replaced by rapeseed products, which contain 11 g P/kg DM (NRC, 2001). The use of SBM is not allowed in CS farms and it was therefore speculated that rapeseed was quantitatively more important in OS farms. Consequently, a higher dietary P content was anticipated on OS farms versus CS farms. However, it appeared that rapeseed was frequently used in CS farms because of economical reasons. Thus, the difference in P intake between CS and OS farms was smaller than expected before the study.
Comparison of TP with soluble P
Although different P availability in different feed ingredients has been suggested in earlier studies, more recent studies state that there is no reason to use different P availability for different concentrate ingredients fed to ruminants under normal feeding conditions (Ekelund et al., Reference Ekelund, Spörndly, Valk and Murphy2003). Analysis of SP in faeces has been suggested as a good way of estimating P overfeeding on farms (Dou et al., Reference Dou, Ramberg, Chapuis-Lardy, Toth, Wang, Munson, Wu, Chase, Kohn, Knowlton and Ferguson2007). Recent studies also show a reasonably strong relationship between SP concentration and P overfeeding according to NRC (2001) when calculated on farm data (Dou et al., Reference Dou, Ramberg, Chapuis-Lardy, Toth, Wu, Chase, Kohn, Knowlton and Ferguson2010) or on individual cow data (Nordqvist M 2012, unpublished). The correlation between SP and TP in faeces in the present study (R 2=0.71) was in line with previous observations based on field data, for example Dou et al. (Reference Dou, Ramberg, Chapuis-Lardy, Toth, Wu, Chase, Kohn, Knowlton and Ferguson2010) showed that SP was significantly correlated to TP (R 2=0.63) in a study based on 575 observations.
The correlation coefficients between P feeding according to NRC and TP and SP were higher when the individual samples from lactating cows were pooled into one value per herd (Table 4). When the mean values of individual cow data at three different stages during the LP were used, TP and SP showed the same pattern (Figure 1). The results of the present study therefore indicate that TP or SP can be used to identify cows overfed with P. Since any surplus P consumed is almost entirely excreted as SP (Dou et al., Reference Dou, Knowlton, Kohn, Wu, Satter, Zhang, Toth and Ferguson2002), it would probably be more appropriate to use SP as the indicator of P overfeeding. However, when it comes to the assessment of P overfeeding on farms under practical conditions, TP may be a more attractive alternative since the cost of analysis is lower and additional data, for example on other minerals, can be obtained through combined analysis. The result shows however, that also common ration calculation systems like NRC and Norfor provide valuable information on the level of P excretion other than milk.
Assessing P overfeeding
In the present study most organic and conventional herds were overfeeding P. Based on results for all 290 cows, the overfeeding appeared to be higher in relation to Norfor (Reference Dou, Ramberg, Chapuis-Lardy, Toth, Wang, Munson, Wu, Chase, Kohn, Knowlton and Ferguson2007) than NRC (2001). However, the P recommendations in these two systems are based on different parameters and are not readily comparable. Furthermore, the milk yield (ECM) was 13% higher for the CS cows and they therefore had a higher dietary P requirement than the OS cows.
As mentioned above, the TP or SP for all 10 cows per farm did not produce a satisfactory level of correlation. Excluding the dry cows improved the correlation to r=~0.5. Pooling the data for all cows and calculating the correlation between the overfeeding of lactating cows on the farm and the pooled analysis of SP or TP produced the best correlations (r=~0.7, see Table 4). If this were to be performed in practice, faecal samples would have to be taken manually from a number of lactating cows on the farm, pooled and sent as one sample for analysis of TP. A method that is yet easier would be to take a sample of the slurry. The average TP content in the slurry from the organic herds was 5.3 g kg/DM (range 3.4 to 7.0 g kg/DM), while it was higher for the conventional herds, (mean 6.6 g kg/DM, range 4.7 to 8.2 g kg/DM). The TP content of slurry could possibly be used as a quick indicator of excessive use of P on dairy farms. A value exceeding 6 g TP/kg DM of slurry would indicate possible overfeeding of P, because it corresponds to 100% compared with the NRC recommendation. As the slurry sometimes also collects, for example, rinse water, a high P content in the slurry could be due to other P-sources. Therefore a recommended limit value cannot be set too low. An analysis of the slurry can mainly be used for warning of very severe cases of overfeeding. However, TP is also of interest when it comes to environmental pollution. Besides being a possible indicator of P overfeeding, analysis of the N and P content of slurry can also indicate its fertiliser value. The range of TP in slurry was high in the present study, possibly due to great variation in P overfeeding, suggesting further studies with focus on the cause of this variation.
In most of the herds studied, mineral supplementation was unnecessary to meet the P requirement of the cows according to NRC. Only 30% of the cows needed P supplementation to meet the NRC recommendation. In average 73 g mineral supplement was fed containing in average 83 g P/kg. This makes 6 g P from mineral supplements per day, not far from 10% of TP intake. However, when the P in the mineral supplement was subtracted from the P content in the diet, there was still marked overfeeding of P in both systems. Without P supplementation, more than 70% of all cows were still fed above the NRC recommendations. In late lactation, that is 8 to 10 months after calving (LP 3), 52% of the OS cows were fed more P then recommended by NRC even without a mineral supplement, as were 76% of the CS cows. For cows in earlier lactation (LP 1 and 2), the proportion of cows overfed P was higher. For the dry cows, the corresponding figures were 93% overfeeding in OS and 89% in CS, very high figures. This suggests that mineral supplementation with P is most often unnecessary, more often in CS and in the dry period, while cows in late lactation might require extra P more often.
Conclusions
At most farms in the study, mineral supplementation was unnecessary to cover the P requirement according to NRC. Excess P was fed in both the organic and CS studied here, but particularly in the CS. The results suggest that the TP content or soluble P content of the faeces can be used as an indicator of the degree of P overfeeding. Analysis of TP is generally more easily available at laboratories and may therefore in many cases be the preferred over an analysis of soluble P. Rectal feaces sampling is the preferred sampling method but a sample taken from the slurry can serve as a first rough indication of P overfeeding at farm level.
Acknowledgements
The authors thank the participating farmers for providing access to the farms and presenting data about their production. The authors also thank the Swedish Dairy Association for providing statistics to enable the selection of farms. The project was financed by the Swedish Farmerʼs Foundation for Agricultural Research.