I. INTRODUCTION
Nickel-based single crystal superalloys (SC-superalloys) have been widely utilized to gas turbine engine components, due to excellent strength and microstructure stability, as well as resistance to creep and fatigue at elevated temperatures.Reference Reed1–Reference Roux, Chalons, Maigre and Nelias3 Compared to polycrystalline materials, the SC-superalloy presents noticeable microstructural and mechanical property anisotropy.Reference Zhao, Liu, Yu, Zhang and Fu4 Over the past years, many studies regarding the effect of crystallographic anisotropy on the mechanical properties of superalloys were conducted,Reference Tian, Chen, Xiao and Ma5–Reference Vattré and Fedelich10 combining theoretical calculations and experimental data.
Earlier studies were mainly focused on the mechanical behaviors along the 〈001〉, 〈011〉, and 〈111〉 orientations. Certain alloys displayed the highest yield strength along the 〈111〉 orientation, such as the first generation PWA 1480 alloy at room temperature.Reference Dalal, Thomas, Dardi, Bricknell, Gell, Kortovich and Radavich9 Certain SC-superalloys displayed the highest yield strength along the 〈001〉 orientation, such as the SRR99Reference Wang, Liu, Yu, Xu, Sun, Guan and Hu8 and CMSX-4Reference Vattré and Fedelich10 alloys. The mechanical property anisotropy could be affected by the SC-superalloy composition. Furthermore, the 〈001〉-oriented single crystals are widely utilized due to their good mechanical properties at high temperature.Reference Vattré, Devincre and Roos11,Reference Zhang, Yuan, Li, Guo, Yang and Song12
A potential problem is, as turbine blades are produced with increasingly complex shapes, along with the addition of more heat resistant metal elements to improve the high temperature performance, the 〈001〉 orientation would be more difficult to grow strictly along the stress axis.Reference Reed1,Reference Zhou, Volek and Singer13 The blade performance deterioration is caused by apparent orientation deviation, even unavailability of SC-superalloy castings.Reference Reed1 Consequently, researchers have begun to pay attention to the orientation deviation effect on the mechanical properties of SC-superalloys. The investigations regarding the misorientation from the 〈001〉 orientation were mainly concentrated on the high temperature creep and tensile properties. As an example, Matan et al.Reference Matan, Cox, Carter, Rist, Rae and Reed14 discovered that the dispersions of rupture strength and lifetime increased as the deviation angle increased. Shah et al.Reference Shah, Cetel, Pollock, Kissinger and Bowman15 reported that the yield strength and ultimate tensile strength of the PWA1483 alloy exhibited a nearly linear decrease as the misorientation increased from 0° to 30°.
In recent years, more attention has been paid to the mechanical behavior of SC-superalloys under dynamic loading conditions compared to static loading. Wang et al.Reference Wang, Guo, Su, Zhou and Yuan16,Reference Wang, Guo, Li, Zhou and Wang17 utilized a Split-Hopkinson bar system (SHPB) to study the dynamic mechanical properties of DD407 and DD6 alloys at high strain rate  $\left( {\dot{\varepsilon } > {{10}^3}\;{{\rm{s}}^{ - 1}}} \right)$. It was observed that the 〈001〉-oriented SC-superalloy stress–strain response varied significantly with strain rate values ranging from 10−3 s−1 to 4 × 10³ s−1. By contrast, the investigations regarding the mechanical behaviors at high strain rate were mainly concentrated on the [001] orientation. Dynamic mechanical behaviors along other orientations were rarely reported.
In this paper, the effect of misorientation on the SC-superalloy mechanical behavior at various strain rates was focused on, especially at high strain rates. The effect of misorientation on the stress–strain response was analyzed. Moreover, the flow stress and orientation changes subsequently to deformation difference were discussed between the low and high strain rates.
II. EXPERIMENTAL PROCEDURE
A. Materials
The material in this study was selected to be a second generation single crystal nickel-based DD5 superalloy. The DD5 nominal chemical composition was Ni–7.0Cr–7.5Co–1.5Mo–5.0W–6.5Ta–3.0Re–6.2Al–0.15Hf–0.02C (wt%).Reference Cui and Huang18 The single crystal with a nominal orientation [001] was cast in bars of roughly 16.5 mm in diameter and 15 cm in length, following directionally solidified in an industrial Bridgeman furnace through the grain selection technique.Reference Cui and Huang18
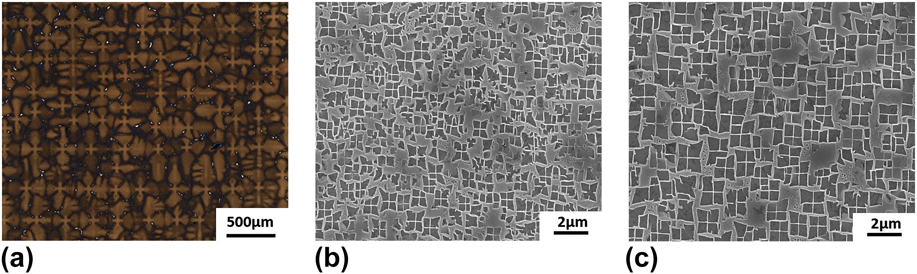
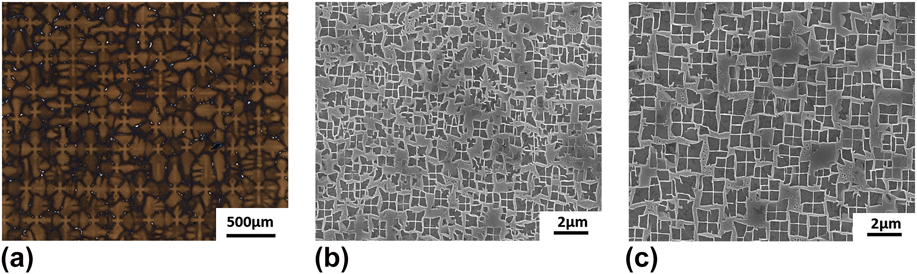
The directionally solidified microstructures of the DD5 SC-superalloys with a nominal [001] orientation are presented in Fig. 1. As it could be observed in Fig. 1(a), the microstructure exhibited a typically dendritic structure with γ/γ′ eutectic phase dispersion in the interdendritic regions (white region). Figures 1(b) and 1(c) present the SEM micrograph of the DD5 SC-superalloy in the dendrite core and interdendritic regions, respectively. It could be observed that the alloy consisted of γ′-precipitates dispersed within the γ-matrix. The morphology of γ′-precipitates in the interdendritic regions was nearly regular cubic, while the mean size was approximately 380 nm, which was higher compared to the dendrite core (235 nm).
Microstructure of DD5 SC-superalloys with [001] orientation, (a) dendrite structure, (b) SEM micrograph in the dendrite core, and (c) in interdendrite regions.
B. Cutting method of differently misoriented samples for testing
In this work, the effect of misorientation on the mechanical properties was mainly investigated. The samples for mechanical testing were cut from the bars in the as-cast state through electrical discharge machining, with various misaligned angles from [001] (angle between [001] orientation and axial direction). The detailed cutting method for the differently misoriented samples from [001] was conducted as follows: First, a cylinder of 20 mm in length was horizontally cut from the as-cast single bar. The cross section of the sample was mechanically ground, polished, and etched with a solution of 14 mL HCl, 21 mL H2O, and 8 g FeCl3 for optical observation. Second, a pair of second dendrite, with the same plane to the primary dendrite [(100) plane] was selected. The sample was cut parallel to the axial direction. Subsequently, the longitudinal section consisting of primary dendrites was gained and it was ground, polished, and etched. The primary dendrite direction, as the [001] orientation, was determined. Third, the differently misoriented angles (0°, 4.28°, 12.77°, 14.39°, 21.13°, 27.3°, and 45°) between the axial direction and the [001] orientation were calibrated. The wire direction was parallel to the calibrated direction. Finally, the samples differently misoriented from the [001] orientation were cut.
C. Quasi-static and dynamic tests
The samples were machined into cylinders of 5 mm in diameter and length and the ends of each specimen were carefully polished. Quasi-static compressive experiments were carried out with an Instron 3200 electromechanical testing machine at room temperature, with a nominal strain rate of 10−3 s−1.
An enhanced SHPBReference Suo, Li, Xie, Zhao, Zhang and Deng19 was utilized to perform dynamic compressive experiments at room temperature. The SHPB system consisted of the input and output bars of 12.8 mm in diameter, which were made of high strength steels. The specimens were located between the incident and transmit bars,Reference Zhang, Suo, Tan, Zhang, Liu, Wang and Li20 whereas consequently the incident bar was impacted by the striking bar. Subsequently to impact, the incident wave (εi), the reflective wave (εr), and the transmitted wave (εt) were detected at the strain gages and recorded with an oscilloscope. Based on the one-dimensional elastic-wave propagation theory, the compression strain (ε), the strain rate  $\left( {\dot{\varepsilon }} \right)$, and the stress (σ) of the specimens were calculated as followsReference Abotula, Shukla and Chona21,Reference Liu, Liu, Xia and Wang22 :
 $$\varepsilon = {{ - 2{C_0}} \over L}\int_0^t {{\varepsilon _{\rm{r}}}} {\rm{d}}t\quad ,$$
 $$\dot{\varepsilon } = {{ - 2{C_0}} \over L}{\varepsilon _{\rm{r}}}\quad ,$$
 $$\sigma = {{EA} \over {{A_{\rm{s}}}}}{\varepsilon _{\rm{t}}}\quad ,$$
where C 0 is the longitudinal-wave velocity in the bar, L is the effective gage length of the specimen, E is the Young’s modulus of the bar, and A and A s are the cross-sectional areas of the split bar and specimen, respectively. Therefore the stress–strain curves upon compression could be attained. The nominal strain rate was approximately 3 × 10³ s−1.
D. Determination of orientation
The crystallographic orientations of the predeformed and deformed single crystals were analyzed with a RIGAKU D/MAX-2400 diffractometer with a Cu Kα source (Rigaku, Tokyo, Japan). The misorientation of a single crystal was evaluated with the rotating orientation X-ray diffraction (RO-XRD) method. A good match between electron backscattered diffraction (EBSD) and RO-XRD technologies exists for the misorientation measurements of SC-superalloys.Reference Sadeghi, Kermanpur, Sarami, Heydari, Nematollahi and Bahmani23 The RO-XRD method details could be observed in the Refs. Reference Guo, Fu and Fu24 and Reference Xu, Guo and Li25. In this paper, EBSD was also utilized to acquire the pole and inverse pole figures of certain samples. The samples for EBSD examination were mirror-polished again and etched electrochemically to remove the deformed surface layers. EBSD measurements were carried out with a Tescan Mira 3 FEG SEM (Tescan, Brno, Czech Republic) enhanced with an Oxford Instruments HKL Nordly Max EBSD system (Oxford Instruments, London, United Kingdom). HKL Channel 5 software (Oxford Instruments, London, United Kingdom) was used for EBSD data processing and post analysis.
III. RESULTS
A. Misorientation of predeformed single crystal
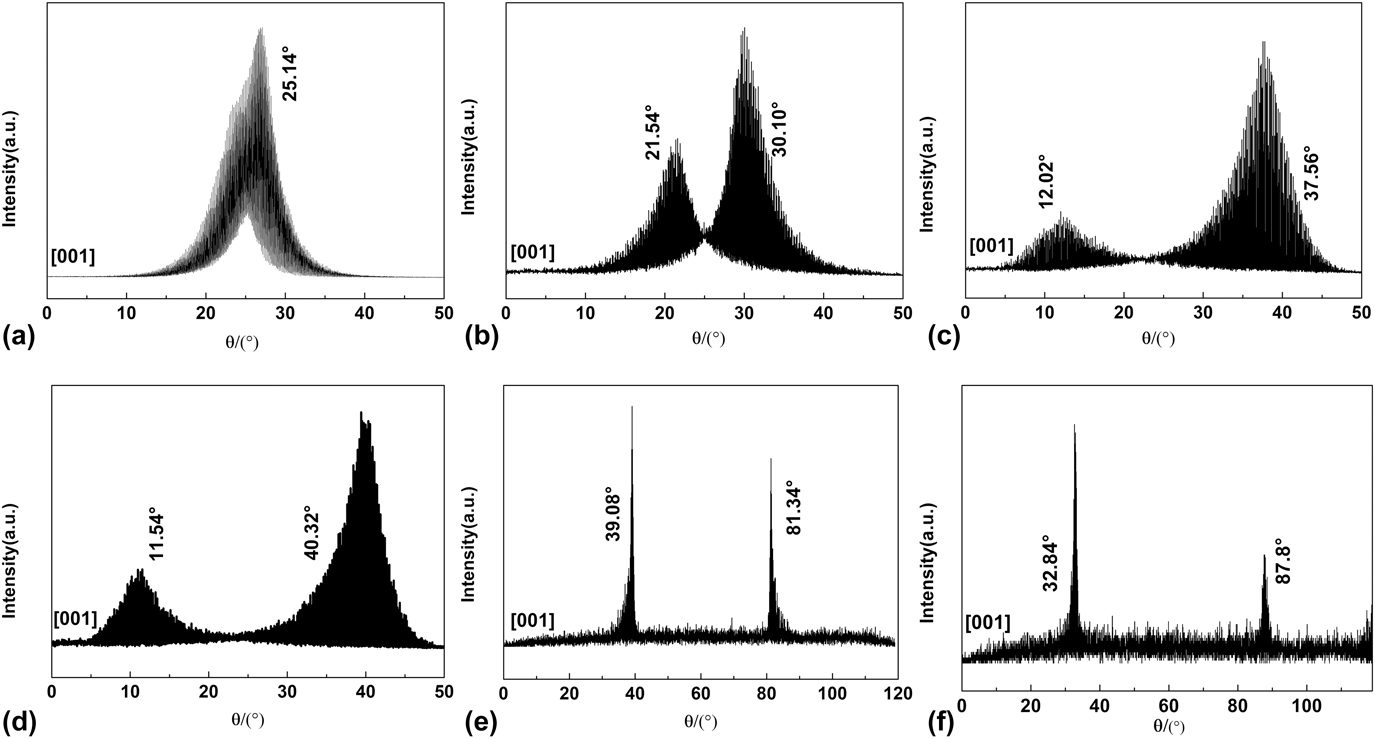
Figure 2(a) presents the RO-XRD patterns of the [001]-oriented DD5 single crystal. Apparently, the patterns had only one diffraction peak, which implied that the [001] orientation was parallel to the axial direction of the samples. The XRD patterns of various misaligned [001] single crystals are depicted in Figs. 2(b)–2(f). It could be observed that the patterns of all the samples exhibited two diffraction peaks. This meant that the [001] orientations of the single crystals deviated from the axial direction. The deviation angle (θ) is calculated through the following equationReference Guo, Fu and Fu24:
 $${\itheta = {{\left( {{\itheta _2} - {\itheta _1}} \right)} / 2}\quad ,$$
where θ 1 refers to the first diffraction peak angle and θ 2 refers to the second diffraction peak angle. The θ of the tested samples was measured as 0°, 4.28°, 12.77°, 14.39°, 21.13°, and 27.48°, respectively.
RO-XRD patterns of the [001] DD5 single crystal with different misorientations: (a) θ = 0°, (b) θ = 4.28°, (c) θ = 12.77°, (d) θ = 14.39°, (e) θ = 21.17°, and (f) θ = 27.3°.

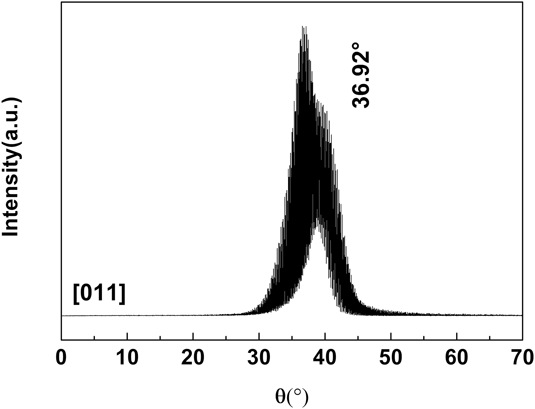
Based on the geometric principle, when the deviation angle between the [001] orientation and the axial is 45°, the single crystal orientation turns to the [011].Reference Yang, Liu, Zhao, Li, Zhang and Fu26 Consequently, the deviation angle of the [011]-oriented sample was measured at a fixed 2θ of the (220) diffraction plane. Figure 3 presents the XRD patterns of the [011]-oriented single crystal. Similarly, its patterns contained only one diffraction peak, which indicated that the sample had no deviation along the [011] direction.
RO-XRD patterns of [011]-oriented single crystal.

B. Quasi-static compressive deformation behavior
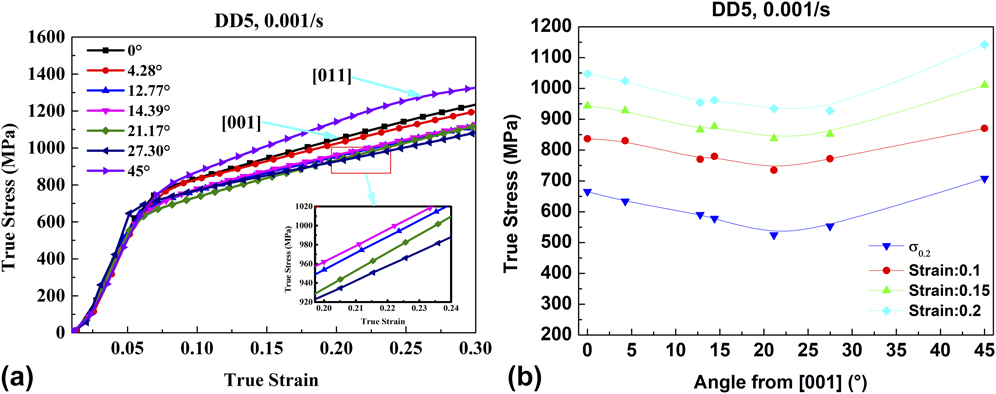
Uniaxial quasi-static compression tests of the DD5 SC-superalloy were carried out at room temperature with the strain rate of 10−3 s−1. The true stress–strain curves of differently misoriented single crystals are presented in Fig. 4(a). All stress–strain curves approximately exhibited elastic–plastic behavior. Also, the true stress is closely related to the true strain and misorientation.
(a) True stress strain curves and (b) relationship between flow stress and misorientation at different strain values, at the nominal strain rate of 10−3 s−1 for the DD5 single crystal.

Figure 4(b) presents the flow stress values under specific strain values. It could be observed that the flow stress decreased first as the deviation angle increased. When the deviation angle was approximately 22°, the flow stress reached the minimum. Following, the flow stress increased as the deviation angle increased. When the deviation angle was 45°, the maximum value was reached, while the corresponding crystallographic direction was [011]. Therefore, under the quasi-static condition of a 10−3 s−1 strain rate, the flow stress in the [011] direction was higher compared to the [001] direction. As an example, when the true strain was 0.15, the flow stress difference between the two crystallographic directions was approximately 70 MPa.
C. Dynamic compressive deformation behavior
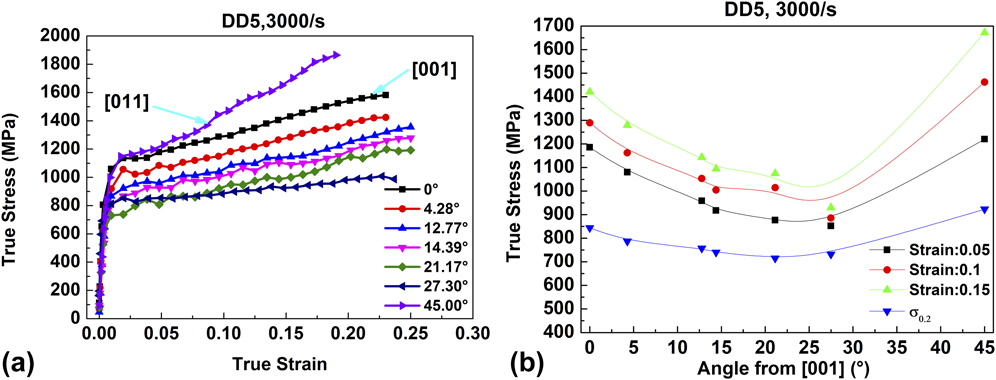
Similarly, uniaxial dynamic compressions were conducted for the DD5 single crystal with various misorientations at room temperature with the strain rate of 3 × 10³ s−1. Figure 5(a) presents the true stress–strain curves. It was evident that the stress–strain curves approximately exhibited elastic–plastic behavior. The true stress was more dependent on misorientation compared to the quasi-static conditions.
(a) True stress strain curves and (b) relationship between flow stress and misorientation at different strain values, at the nominal strain rate of 3 × 10³ s−1 for the DD5 single crystal.

The flow stress values corresponding to certain true strains for various disoriented single crystals are presented in Fig. 5(b). Under the dynamic loading condition, the relation between misorientation and flow stress exhibited a similar phenomenon to the quasi-static loading condition. As the misorientation increased, the flow stress decreased at first and consequently increased. Compared to the quasi-static condition, the flow stress variation along with the misorientation was significantly apparent. This phenomenon was interpreted as a consequence of dislocation heterogeneity under high strain rate in FCC single crystals.Reference Wang, Beyerlein and LeSar27 In addition, the flow stress along the [011] orientation was quite higher than along the [001] orientation. As an example, when the strain was 0.15, the flow stress difference between the two crystallographic directions was approximately 250 MPa.
It is worth noting that the flow stress difference corresponding to different misorientations is related to the strain value. As it could be observed from Fig. 4(b), when the strain was 0.1, the difference of flow stress between [001] and [011] orientations was approximately 34 MPa, whereas when the strain was 0.15, the flow stress difference was approximately 70 MPa. Under the high strain rate condition presented in Fig. 5(b), when the strain was 0.1, the flow stress difference between the [001] and [011] orientations was approximately 170 MPa; when the strain was 0.15, the flow stress difference was approximately 250 MPa. Consequently, as the true strain increased, the flow stress difference increased. This investigation was similar to a Ni3Al single crystal investigation.Reference Ezz, Sun and Hirsch28
IV. DISCUSSION
A. Effect of misorientation on compressive yield stress
The aforementioned experimental results indicated that the misorientation from [001] had a pronounced effect on the yield stress of the DD5 SC-superalloy. The yield stress versus misorientation relation was reported for the PWA1480 superalloy.Reference Österle, Bettge, Fedelich and Klingelhöffer29,Reference Shah, Duhl, Bricknell, Gell, Kortovich and Radavich30 The relation was caused by unequal Schmid factors along different orientations. In general, a SC-superalloy deforms through the {111} 〈011〉 slip system opening at room temperature. The yield strength depends on the critical shear strength of opened slip-systems.Reference Österle, Bettge, Fedelich and Klingelhöffer29 When the crystallographic orientation is [001], the critical shear strength of a single crystal is calculated through the following equation based on the Schmid Law:
 $$\itau = {\isigma _{\rm{y}}}\iOmega = {\isigma _{\rm{y}}}\cos \ivarphi \cos \ilambda \quad ,$$
where τ is the critical shear strength; σ y is the yield strength; Ω is the Schmid factor; φ is the angle between the axial direction and the normal direction of slip planes, while λ is the angle between the axial direction and the slip line direction. It is well known that the number of slip systems has a profound on the mechanical behaviors, especially the plasticity. Adversely, a SC-superalloy is deformed by only one or two octahedral slip systems prior to yielding.Reference Westbrooke, Forero and Ebrahimi31,Reference Li, Zhou, Zhou, Li, Jin, Sun and Zhang32 For all misoriented samples in this investigation, the Schmid factor was identical for all octahedral slip systems within a certain orientation. Consequently, it could be assumed that the specific (111) $\left[ {10\bar{1}} \right]$ slip system was activated and selected to simulate the Schmid factor in the following discussion. As it could be observed in Ref. Reference Shah, Duhl, Bricknell, Gell, Kortovich and Radavich30, the Schmid factor of a [001]-oriented single crystal is 0.41. As the deviation angle increases, the Schmid factor increases first and consequently decreases. The yield strength is inversely proportional to the Schmid factor; therefore, the yield strength decreases first and consequently increases as the misorientation increases.
In addition, the [011] and [001] orientations have the same Schmid factors. If only the (111) $\left[ {10\bar{1}} \right]$ slip system is considered, the yield strength of these two directions should be consistent from Eq. (5). Adversely, in the current test results, the compressive yield strength in the [011] direction was always higher compared to the [001] direction. This occurred due to the different cross-slip probabilities in the SC-superalloy. The parameter N represents the cross-slip extent.
 $$N = {{{\rm{Schmid}}\;{\rm{factor}}\;\left( {010} \right)\left[ {\bar{1}01} \right]} \over {{\rm{Schmid}}\;{\rm{factor}}\;\left( {111} \right)\left[ {\bar{1}01} \right]}}\quad .$$
Through calculations, the N value along near [011] orientation was higher than near the [001]. Therefore, the near [011] orientation was more likely to cross-slip, which impeded the octahedral slip. Consequently, the yield strength along the [011] orientation was higher.
Due to the matrix phase γ and strengthening phase γ′ coexistence, the strengthening mechanism of the SC-superalloy was quite complex. In many studies, certain constitutive models were established to describe the relationship between flow stress and crystallographic orientation under various experimental conditions.
On the basis of slip plane observation through TEM, in many studies,Reference Österle, Bettge, Fedelich and Klingelhöffer29,Reference Miner, Gabb, Gayda and Hemker33,Reference Nitz, Lagerpusch and Nembach34 it was suggested that the main deformation mechanism of the Ni-based superalloy along the [001] and [011] orientations was the octahedral slip system, when the temperature was below 873 K. Lall, Chin, and Pope proposed a model (LCP-model)Reference Lall, Chin and Pope35 to describe the critical resolved shear stress anisotropy of an SC-superalloy at the given temperature and strain rate. Also, a good agreement in yield strength values between the simulated values through the LCP model and the experimental results existed in the SC16 and Nimonic 105 alloys.Reference Österle, Bettge, Fedelich and Klingelhöffer29 The LCP-model equation is
 $${S_1}{\sigma _{\rm{y}}} = {T_{\rm{n}}} + {A_0}\exp \left[ {{{\left( { - {H_0} + {A_2}{S_2}{\sigma _{\rm{y}}} + \delta {A_3}{S_3}{\sigma _{\rm{y}}}} \right)} / {RT}}} \right]\quad ,$$
where the Schmid factors 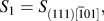 ${S_1} = {S_{\left( {111} \right)[\overline 1 01]}},$
 ${S_2} = {S_{\left( {010} \right)[\overline 1 01]}},$ A 0, A 2, A 3 are constants, T is the temperature, and T n is the resolved shear stress under a specified temperature. In the equation, the exponent of
 $\exp \left[ {{{\left( {{A_2}{S_2}{\sigma _{\rm{y}}} + \delta {A_3}{S_3}{\sigma _{\rm{y}}}} \right)} / {RT}}} \right]$ is relatively low and it could be approximated as
 $1 + {{\left( {{A_2}{S_2}{\sigma _{\rm{y}}} + \delta {A_3}{S_3}{\sigma _{\rm{y}}}} \right)} / {RT}}$ through the Taylor expansion at a zero point. Following a rearrangement of terms, the variables are separated in the form:
 $${1 / {{\sigma _{\rm{y}}}}} = {b_1}{S_1} + {b_2}{S_2} + \delta {b_3}{S_3}\quad ,$$
where b 1 = 1/[T n+A 0 exp(−H 0/RT)], b 2 = (−b 1A 0A 2/RT)/exp(−H 0/RT), and b 3 = (−b 1A 0A 3/RT)/exp(−H 0/RT). δ is +1 for tensile loading and −1 for compressive loading. In this form, the orientation dependence of σy at a given strain rate could be numerically evaluated through regression analysis.
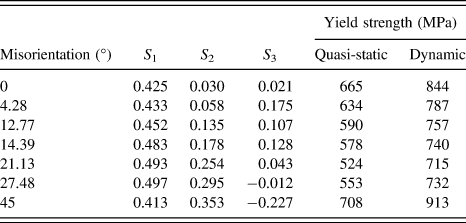
The Schmid factors and the compressive yield strength values of specimens with different misorientations are listed in Table I. Through multiple regression analysis according to Eq. (8) with the authors’ experimental results, the fitting constants were obtained. Under the quasi-static loading condition, b 1 = 3.46 × 10⁻³, b 2 = 0.36 × 10⁻³, and b 3 = 0.50 × 10⁻³, while under the dynamic condition, b 1 = 2.8 × 10⁻³, b 2 = −0.032 × 10⁻³, and b 3 = 0.26 × 10⁻³. The b 1 term represents the primary octahedral slip. For the dynamic condition, insufficient time existed for the dislocation to slip, consequently leading to dislocation pile-up at the γ/γ′ interface. Subsequently, the b 1 was lower under the dynamic condition than under the quasi-static condition. Miner et al.Reference Miner, Gabb, Gayda and Hemker33 argued that the b 2 term (cross-slip term) could be neglected under lower temperature. In the authors’ results, the b 2 was positive under quasi-static conditions, which coincided with the SC16 and René N4 alloys according to the experimental results by Miner et al.Reference Miner, Gabb, Gayda and Hemker33 and Österle et al.Reference Österle, Bettge, Fedelich and Klingelhöffer29 Adversely, the b 2 becomes negative under dynamic conditions. Österle et al.Reference Österle, Bettge, Fedelich and Klingelhöffer29 considered that the b 2 term consisted of two parts; one part was the negative term caused by the cube cross-slip, while the other part was positive, as derived from the shear deformation of the γ matrix channel. In the present result, it could be considered that the shear deformation extent of the γ matrix was higher than the cube cross-slip probability, leading to the b 2 term positive value under quasi-static loading. Moreover, the b 2 negative value was caused by the higher probability of the cube cross-slip under dynamic loading.
Schmid factors of different misorientations and yield strength of corresponding specimens under quasi-static and dynamic compression.

To check the validity of the LCP, the yield strength was calculated:
 $${\sigma _{\rm{y}}} = {\left( {3.46{S_1} + 0.36{S_2} - 0.5{S_3}} \right)^{ - 1}} \times {10^3}\quad ,$$
 $${\sigma _{\rm{y}}} = {\left( {2.80{S_1} - 0.032{S_2} - 0.26{S_3}} \right)^{ - 1}} \times {10^3}\quad .$$
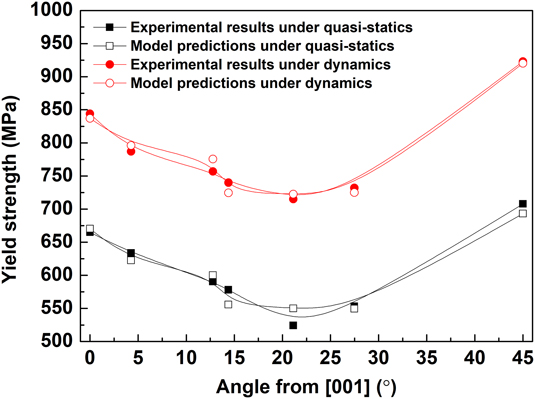
The yield strength calculated according to Eqs. (9) and (10) is plotted in Fig. 6. For comparison, the experimental results of the DD5 SC-alloy are also presented. The experimental values were in good agreement with the calculated values, which could display the misorientation effect on the yield strength.
Relationship between yield strength and crystallographic misorientation, comparison of LCP model predictions with experimental results.

B. Comparison of flow stress between quasi-static and dynamic compression
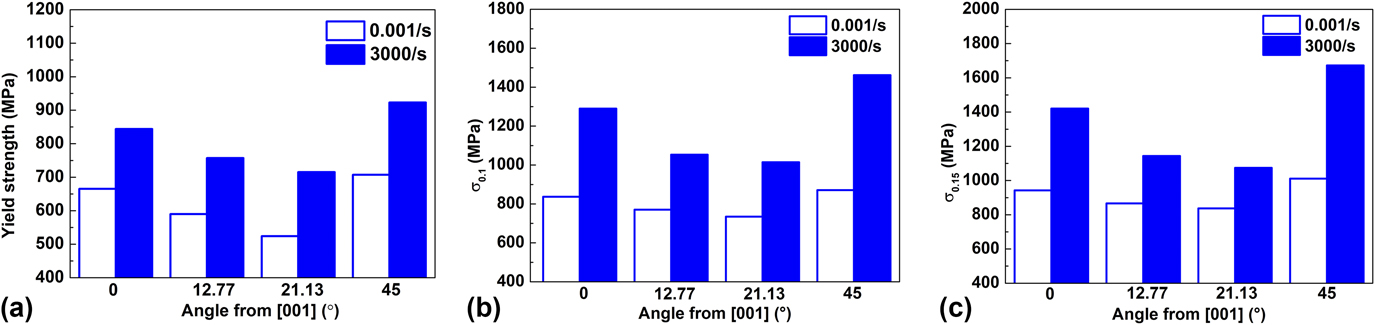
The flow stress values from quasi-static and dynamic compression were compared with specimens of different crystallographic misorientation values (0°, 12.77°, 21.13°, and 45°). It could be observed from Fig. 7(a) that the difference in yield strength between dynamic and quasi-static compression was approximately 200 MPa.
Compressive flow stress at different strain rates (10−3 s−1 and 3 × 10³ s−1) and crystallographic misoreintation: (a) Yield strength, (b) true stress at ε = 0.1, and (c) true stress at ε = 0.15.

As it could be observed from Figs. 7(b) and 7(c), at a strain value of 0.1, the difference in flow stress along the [011] orientation between dynamic and quasi-static compression was nearly 590 MPa. At a strain value of 0.15, the difference was approximately 660 MPa. The flow stress under dynamic condition was significantly higher compared to quasi-static flow stress.
It could also be observed from Fig. 7 that the misorientation had a more pronounced effect on the flow stress at high strain rates. In Fig. 7(b), the flow stress along the [011] orientation (45°) was improved by 4.02% than at the [001] orientation (0°) at a strain rate of 10−3 s−1 and improved by 13.3% at a strain rate of 3 × 10³ s−1. Moreover, in Fig. 7(c), the flow stress along the [011] orientation (45°) was improved by 7.2% than that at the [001] orientation at a strain rate of 10−3 s−1 and improved by 17.7% at a strain rate of 3 × 10³ s−1.
C. Crystal orientation deviation following compressive deformation
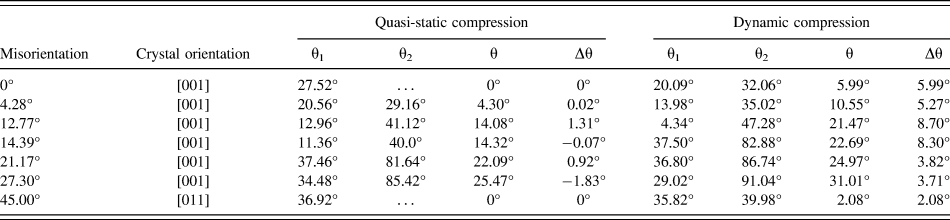
Subsequent to quasi-static and dynamic compression, the crystallographic orientation deviations of the single crystal samples were measured through the RO-XRD method. Compared to the undeformed sample, not only under quasi-static compression but also under dynamic compression, the nominal orientation had not changed, whereas only the diffraction angle changed slightly. The deviation angle obtained through RO-XRD testing is presented in Table II.
Misorientation of samples after quasi-static and dynamic compression.

Following quasi-static compression, the misorientation of the single crystal varied from 0°, 4.28°, 12.77°, 14.39°, 21.13°, and 27.30° to 0°, 4.30°, 14.08°, 14.32°, 22.09°, and 25.47°. By contrast, the misorientation of single crystal changed to 5.99°, 10.55°, 21.47°, 22.69°, 24.97°, and 31.01° subsequently to dynamic compression. It was evident that under high strain rate compression, the orientation difference of the single crystal samples was quite higher than that under quasi-static loading. For the sample with a misorientation of 12.77°, following quasi-static compression, the orientation deviation between the sample and the [001] direction was 14.08°, increased by 10.3%, while the orientation deviation was 21.47°, increased by 68.1% following dynamic compression.
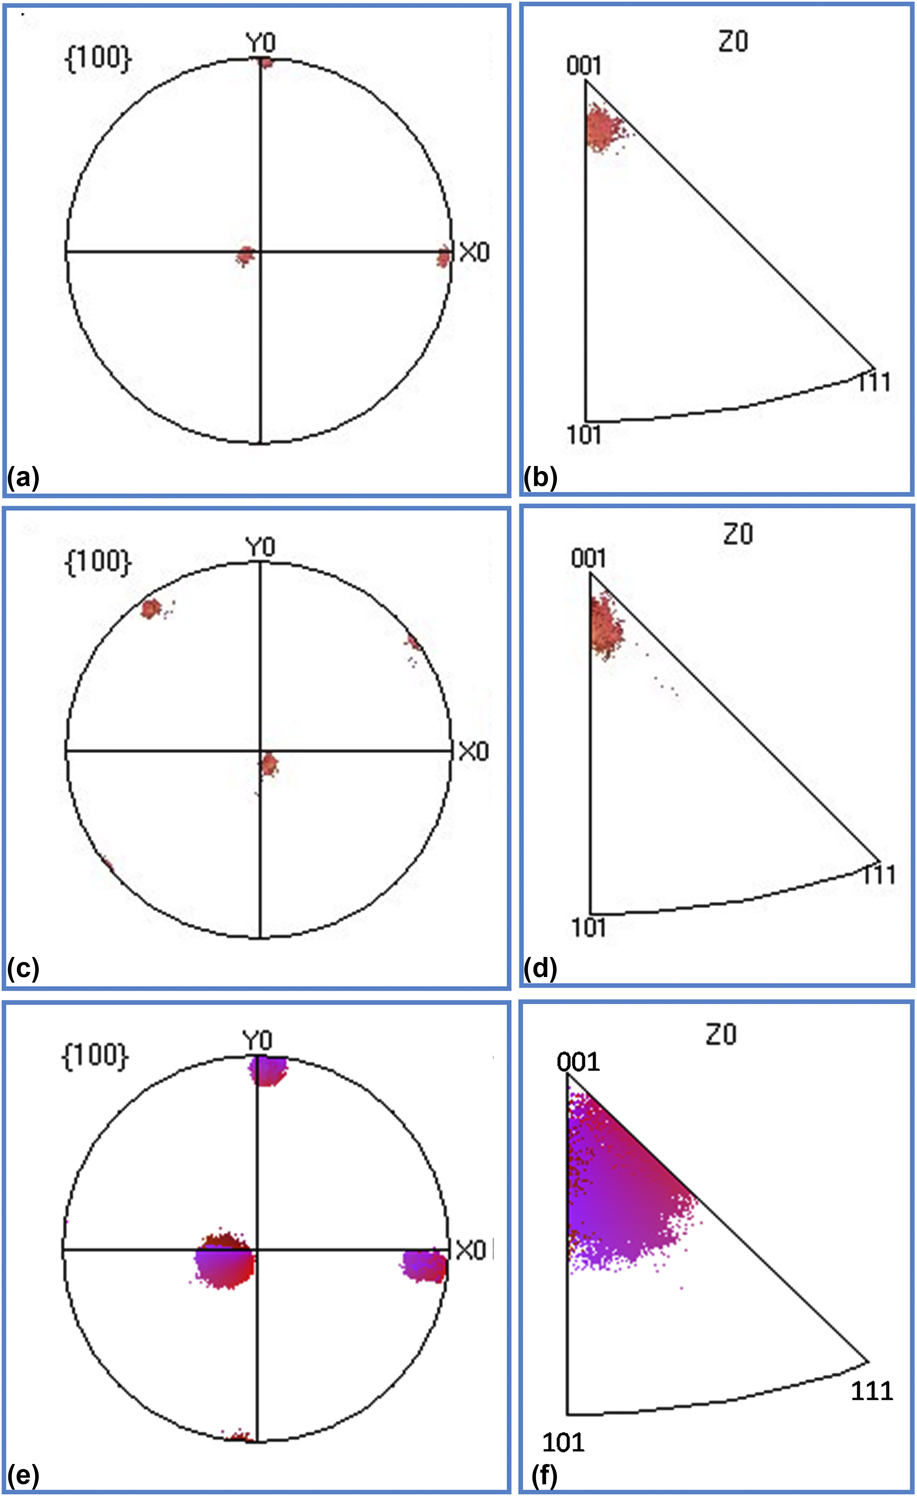
Figure 8 presents the pole figure and inverse pole figure of the [001] orientation sample prior to and following quasi-static and dynamic compression. Prior to compression, the single crystal orientation was mainly near the [001] orientation. Following quasi-static compression, the orientation dispersion had no more changes but became more apparent subsequently to dynamic loading, as presented in Figs. 8(c) and 8(d). Therefore, the reason for the higher misorientation change subsequently to dynamic compression might be the higher orientation dispersion.
(a), (c), and (e) {001} pole figures and (b), (d), and (f) inverse pole figures of the 〈001〉 oriented sample, (a) and (b) before deformations, (c) and (d) after quasi-static deformations (e) and (f) after dynamic deformations.

V. CONCLUSIONS
In this study, the mechanical behavior of DD5 single crystals with different misorientations was investigated under quasi-static and dynamic compression at room temperature. The conclusions drawn from this study were as follows:
(1) Through the experimental and modeling results, the yield strength and the flow stress of the DD5 SC-superalloys exhibited apparent anisotropy and similar trends: first a decrease and consequently an increase as the deviation angle increased within the misorientation of 0–45° under all the strain rates. This was related to the different Schmid factors for different misorientations.
(2) The yield strength and the flow stress of the DD5 SC-superalloy along the [011] orientation were higher compared to the [001] orientation.
(3) The yield strength and the flow stress under dynamic compression were higher compared to the quasi-static compression. Also, under high strain rate, the flow stress was more sensitive to the misorientation of single crystals.
(4) The misorientation changed subsequently to compressive deformations. In quasi-static compression, the degree of the misorientation was negligible, of approximately 1–2°. Adversely, the misorientation degree change was more apparent, of 3–9° following dynamic compression.
ACKNOWLEDGMENTS
The authors wish to thank Tao Suo for performing SHPB experiments. This work was supported by the National Natural Science Foundation of China (No. 51674201), the Fundamental Research Funds for the Central Universities (3102014JCQ01021), and the Research Fund of the State Key Laboratory of Solidification Processing (NWPU), China (No. 101-QP-2014).