I. INTRODUCTION
Molybdenum (Mo) is an element with interesting and complicated chemistry that impacts on numerous scientific and technological fields. Mo is an essential trace element in living organisms, present in a wide variety of enzymes and cofactors critical for life (Garner, Reference Garner, Braithwaite and Haber1994; Schwarz et al., Reference Schwarz, Mendel and Ribbe2009). Isotopically, the element is notable for having seven stable isotopes of relatively high (>5%) abundance (Anbar, Reference Anbar2004). Mo compounds in general (Green, Reference Green, Braithwaite and Haber1994; Roggan and Limberg, Reference Roggan and Limberg2006), and Mo oxides in particular (Chippendale and Cheetham, Reference Chippendale, Cheetham, Braithwaite and Haber1994; Sławiński et al., Reference Sławiński, Fjellvåg, Ruud and Fjellvåg2016), are well known to exhibit unusual and varied crystal chemistry. Mo sees widespread usage in steel and corrosion resistant alloys (Lasheen et al., Reference Lasheen, El-Almady, Haasib and Helal2015), catalysis (Haber, Reference Haber, Braithwaite and Haber1994; Zaman and Smith, Reference Zaman and Smith2012), and medical isotope production, where reactor produced 99Mo is used to produce technetium-99m (99mTc), the most widely used radioisotope for medical imaging (Banerjee et al., Reference Banerjee, Pillai and Ramamoorthy2001).
99Mo has historically been produced using nuclear reactors, but concerns with the use of HEU (highly enriched uranium) and supply insecurity because of production by only a small number of aging reactors have led to significant interest in alternative production routes (National Research Council, 2009; Van Noorden, Reference Van Noorden2013). This has necessitated development of complementary chemical processes for Mo recycling to make these alternative production routes viable (Tkac and Vandergrift, Reference Tkac and Vandergrift2016). The compound characterized in this work was observed during development of Mo recycling processes for accelerator based production of 99Mo. Based on the formula and lattice parameters, the phase appears to have been observed previously (Fӧrster et al., Reference Fӧrster, Kreusler and Fuchs1985) without a detailed description of the crystal structure.
II. EXPERIMENTAL
A specimen of Mo processing powder supplied by Canadian Isotope Innovation Corp. was mounted in a 0.5 mm ID Kapton capillary, which was sealed at both ends with adhesive.
Powder X-ray diffraction (PXRD) patterns were collected using a Canadian Macromolecular Crystallography Facility beamline (CMCF-BM or 08B1-1, Fodje et al., Reference Fodje, Grochulski, Janzen, Labiuk, Gorin and Berg2014) at the Canadian Light Source (CLS). 08B1-1 is a bending magnet beamline with a Si (111) double crystal monochromator. Two-dimensional (2D) data were obtained using a Rayonix MX300HE detector with an active area of 300 × 300 mm2. The patterns were collected at an energy of 18 keV (λ = 0.688 80 Å) and a sample–detector distance of 250 mm.
The 2D PXRD patterns were calibrated and integrated using the GSASII software package (Toby and Von Dreele, Reference Toby and Von Dreele2013). The sample–detector distance, detector centering, and tilt were calibrated using a lanthanum hexaboride (LaB6) standard reference material (NIST SRM 660a LaB6) and the calibration parameters were applied to all patterns. After calibration, the 2D patterns were integrated to obtain standard 1D powder diffraction patterns. A pattern collected from an empty Kapton capillary (using the same conditions) was subtracted from the sample data during integration.
Initial search/match phase identification performed with the Powder Diffraction File (ICDD, Reference Kabekkodu2015) failed to find any suitable matches, although similar phases with significant lattice parameter differences were identified after ab initio indexing.
Pattern indexing with DICVOL06 (Boultif and Louer, Reference Boultif and Louer2004) suggested an orthorhombic unit cell with lattice parameters a = 13.5570, b = 9.3063, c = 7.6188 Å, and a cell volume of 961.22 Å3 (M 20 = 50.9, F 20 = 236.8). Space-group determination with ChekCell (Laugier and Bochu, Reference Laugier and Bochu2000) suggested space groups Pnam and Pna21 as equally plausible options. Subsequently, a reduced cell search of the Inorganic Crystal Structure Database (Hellenbrandt, Reference Hellenbrandt2004) using an unusually large tolerance of 3% yielded the structure of diammonium trimolybdate, (NH4)2Mo3O10 (Range and Fässler, Reference Range and Fässler1990), in space group Pnma.
Insufficient powder was available for an elemental analysis, but it was known that both sodium and ammonium were present during the processing. The ab initio lattice parameters were also reasonably similar to lattice parameters attributed to an orthorhombic trimolybdate phase observed by Fӧrster et al. (Reference Fӧrster, Kreusler and Fuchs1985), with formula Na(NH4)Mo3O10·H2O (lattice parameters a = 9.25, b = 7.58, and c = 13.47 Å). Therefore, a matrix was prepared for structure solution using the two space-group options with three cation compositions including: (1) two Na1+ ions, (2) two NH4 1+ ions, and (3) a mixed cation composition. Ammonium and MoO6 fragments were converted to Fenske–Hall Z-matrices using Open Babel (O'Boyle et al., Reference O'Boyle, Banck, James, Morley, Vandermeersch and Hutchison2011) and the full matrix of two space groups with three compositions was used to solve the structure using FOX (Favre-Nicolin and Černý, Reference Favre-Nicolin and Černý2002). While the mixed cation compositions were clearly superior options, both space groups yielded comparable solutions and were examined in detail with Rietveld refinement. The Pnma structure was eventually chosen to be correct, based on similar agreement indices between structures with fewer parameter for Pnma, and by analogy with the diammonium trimolybdate structure (Range and Fässler, Reference Range and Fässler1990).
Rietveld refinement of the crystal structure was performed with the GSAS/EXPGUI program (Toby, Reference Toby2001; Larson and Von Dreele, Reference Larson and Von Dreele2004). Anomalous scattering factors were interpolated from the tables of Sasaki (Reference Sasaki1989) and input into GSAS. The background was refined using a Chebyshev polynomial with 12 terms. The positions of the Na, N, Mo, and O atoms were refined, while the positions of the ammonium H atoms remained fixed, but were periodically optimized using Avogadro (Hanwell et al., Reference Hanwell, Curtis, Lonie, Vandermeersch, Zurek and Hutchison2012). Isotropic displacement parameters were refined for the Na, N, and Mo atoms, with the H atoms for the ammonium ion constrained to 1.3 times the value of the N atom. The isotropic displacement parameter for the O atoms refined to a fairly low value, a common issue in the presence of heavy atoms (Kaduk, Reference Kaduk2007), but stayed positive with the use of the anomalous scattering factors. The position of the H atom for the water molecule was added late in the refinement based on the results of the density functional theory (DFT) calculation.
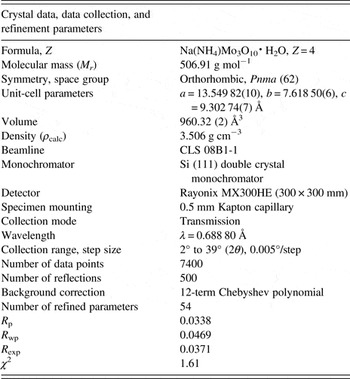
The crystal data, data collection, and refinement details are summarized in Table I.
The crystal data, data collection and refinement parameters obtained for Na(NH4)Mo3O10·H2O.

A density functional geometry optimization (using a fixed experimental unit cell) was carried out using CRYSTAL14 (Dovesi et al., Reference Dovesi, Orlando, Erba, Zicovich-Wilson, Civalleri, Casassa, Maschio, Ferrabone, De La Pierre, D'Arco, Noel, Causa, Rerat and Kirtman2014). The basis sets were obtained from the literature for the H, N, and O (Gatti et al., Reference Gatti, Saunders and Roetti1994), Na (Dovesi et al., Reference Dovesi, Roetti, Freyria Fava, Prencipe and Saunders1991), and Mo atoms (Cora et al., Reference Cora, Patel, Harrison, Roetti and Catlow1997). The calculation was run on eight 2.1 GHz Xeon cores (each with 6 Gb RAM) of a 304-core Dell Linux cluster at the Illinois Institute of Technology (IIT), used 8 k-points and the B3LYP functional, and took approximately 1 day.
III. RESULTS AND DISCUSSION
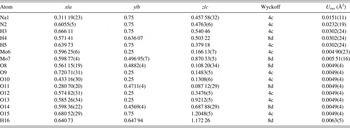
Figure 1 illustrates the final Rietveld refinement of Na(NH4)Mo3O10·H2O, which yielded a final reduced χ 2 of 1.61, while the refined atomic coordinates and DFT-optimized coordinates are given in Tables II and III, respectively. The root-mean square (RMS) Cartesian displacement between the Rietveld refined and DFT calculated structures for the heavy (non-hydrogen) atoms is 0.0415 Å, suggesting excellent agreement between refined and calculated structures. The largest peak and hole in the difference Fourier map were 0.357 and −0.395 e Å−3 respectively.
(Colour online) A plot illustrating the final Rietveld refinement of Na(NH4)Mo3O10·H2O obtained with GSAS.

The refined crystal structure of Na(NH4)Mo3O10·H2O with lattice parameters a = 13.549 82(10), b = 7.618 50(6), c = 9.302 74(7) Å. All atoms were refined with fixed site occupancies of 1.

The DFT optimized crystal structure of Na(NH4)Mo3O10·H2O calculated with fixed lattice parameters a = 13.5527, b = 7.6203, and c = 9.3047 Å.

The refined lattice parameters [a = 13.549 82(10), b = 7.618 50(6), c = 9.302 74(7) Å] differ from the lattice parameters tabulated by Fӧrster et al. (Reference Fӧrster, Kreusler and Fuchs1985), yielding a 1.7% increase in the unit-cell volume. The cell volumes for two additional compounds tabulated by Fӧrster et al. (Reference Fӧrster, Kreusler and Fuchs1985), K2Mo3O10 and Cs2Mo3O10, were compared with independent analyses in the literature (by Seleborg, Reference Seleborg1966; Enjalbert et al., Reference Enjalbert, Guinneton and Galy1999, respectively). The independent analyses of K2Mo3O10 and Cs2Mo3O10 yielded unit-cell volume differences of −5.1 and +2.5%, respectively, relative to the cell volumes of Fӧrster et al. (Reference Fӧrster, Kreusler and Fuchs1985), suggesting the volume difference observed in this work is not unreasonable for the expected formula. An experimental pattern for Na(NH4)Mo3O10·H2O (PDF 00-036-0335, submitted by A. Fӧrster, private communication) shows approximate agreement with the main reflection positions observed in this work, but has visually estimated intensities. A plot comparing the current data with PDF 00-036-0335 is contained in the online supplementary material.
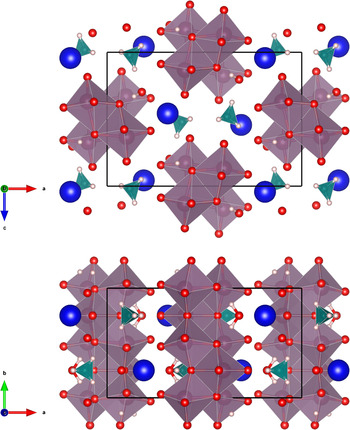
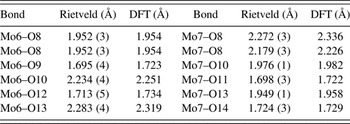
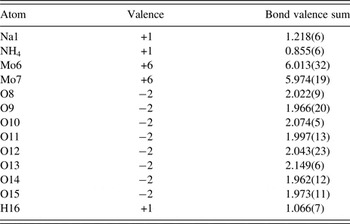
The crystal structure, illustrated in Figure 2, is characterized by molybdate (Mo3O10 2−) chains running parallel the b-axis, where adjacent molybdate octahedra share edges. The cations and water molecule provide linkages between the chains. Similar molybdate chains have been observed previously in a number of structures, with both orthorhombic and monoclinic symmetry (P21/m), including (NH4)2Mo3O10 (Range and Fässler, Reference Range and Fässler1990), Na(NH4)Mo3O10 (Xu et al., Reference Xu, An and Koh1996) and (NH4)2Mo3O10·H2O (Lasocha et al., Reference Lasocha, Jansen and Schenk1995). The MoO6 octahedra observed in the previous studies have generally been distorted, and the current structure is no exception; the Rietveld refined Mo–O bond lengths cover a range of nearly 0.6 Å for each Mo atom, as summarized in Table IV. In terms of both range and limits, these values are consistent with previous single-crystal observations (Range and Fässler, Reference Range and Fässler1990; Xu et al., Reference Xu, An and Koh1996), although Lasocha et al. (Reference Lasocha, Jansen and Schenk1995) observed two larger Mo–O distances of 2.50 and 2.62 Å using powder data. The bond valence sum (BVS) values (Brown, Reference Brown2002) are given in Table V. Despite the distortion of the MoO6 octahedra, the BVS values for the Mo atoms are very close to the expected values [6.013(32) for Mo6, 5.974(19) for Mo7]. The BVS value for the Na ion [1.218(6)], which is six-coordinate, is somewhat larger than the value for the ammonium ion [0.855(6)], but comparable with the BVS value for Na [1.193(1)] observed in the similar compound Na(NH4)Mo3O10 (Xu et al., Reference Xu, An and Koh1996). While the ammonium ion BVS value is low, if two oxygen bonds at 3.24 Å are included (above the current calculation limit of 3 Å), the BVS value increases to 0.984(7).
(Colour online) The crystal structure of Na(NH4)Mo3O10·H2O, viewed along the b-axis (top) and c-axis (bottom). The polyhedra and atom types can be identified by color including NH4 (green tetrahedra), MoO6 (purple octahedra), Na (dark blue), hydrogen (pink), and O (red). The unit cell is outlined in black. The figure was prepared with VESTA (Momma and Izumi, Reference Momma and Izumi2011).

Mo–O bond lengths obtained from the Rietveld refinement and DFT calculation.

Some bond valence parameters calculated from the refined Na(NH4)Mo3O10·H2O structure, using a maximum bond distance of 3 Å.

Hydrogen bonding in the structure, based on the DFT model, is summarized in Table VI. The short bonds Mo6–O9, Mo6–O12, Mo7–O11 and Mo7–O14 are double bonds, and with the exception of the water molecule, O15, all of the hydrogen bonds involve these O atoms as acceptors. The ammonium ion forms discrete N–H…O bonds between two adjacent chains (via O9 in one chain, via O12 and O14 in the second chain) in addition to a fourth bond with the water O15, itself hydrogen bonded to a third chain. The water molecule forms two hydrogen bonds within a single chain, where the O–H…O hydrogen bonds form a R1,1(6) ring, which includes both a Mo and the Na. The hydrogen bonds also participate in a number of more-complex rings and chains.
Hydrogen bonds observed in the Na(NH4)Mo3O10·H2O structure and their parameters as determined by the DFT modeling.

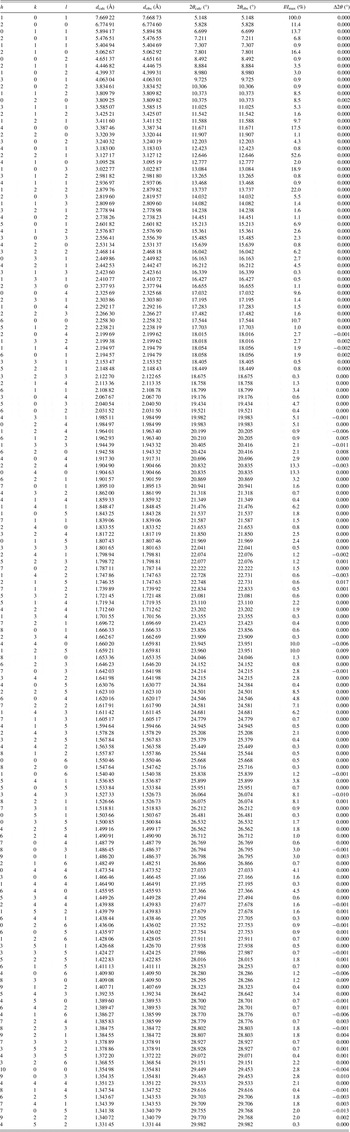
A Bragg reflection list, shown in Table VII, was prepared by summing reflections closer than 0.02°2θ as multiple reflections and assigning a weighted average reflection position, then including all reflections with relative integrated intensities of 0.3% or greater up to 30°2θ. The Bragg reflection list and raw data are contained in a crystallographic information file (CIF) in the online supplementary material. Individual CIF files containing the Rietveld refined and DFT calculated structures are also included as online supplementary material.
The Bragg reflection list obtained from the final Rietveld refinement, prepared by summing reflections closer than 0.02 °2θ as multiple reflections and assigning a weighted average reflection position, then including all reflections with relative integrated intensities of 0.3% or greater up to 30 °2θ.

SUPPLEMENTARY MATERIAL
The supplementary material for this article can be found at https://doi.org/10.1017/S0885715617000380.
ACKNOWLEDGEMENTS
The authors thank Andrey Rogachev for the use of the computing resources at the Illinois Institute of Technology, and suggestions from two anonymous reviewers which significantly improved the manuscript. This paper is dedicated to Professor Emeritus Michael Sayer (Queen's University) and his enthusiasm for all things physics, chemistry, materials science and beyond. Research described in this paper was performed using beamline 08B1-1 at the Canadian Light Source, which is supported by the Canadian Foundation for Innovation, the Natural Sciences and Engineering Research Council of Canada, the National Research Council Canada, the Canadian Institutes of Health Research, the Government of Saskatchewan, Western Economic Diversification Canada, and the University of Saskatchewan.